Growth arrest-specific transcript 5 represses endometrial cancer development by promoting antitumor function of tumor-associated macrophages
Funding information
Shenzhen Science and Technology Innovation Committee, Grant/Award Number: JCYJ20210324102806018, JCYJ20210324103001003; Sanming Project of Medicine in Shenzhen, Grant/Award Number: SZSM201812041; Clinical Research Funding from Shenzhen Second People’s Hospital, Grant/Award Number: 20203357030
Abstract
The tumor-suppressor role of long noncoding RNA (lncRNA) growth arrest-specific transcript 5 (GAS5) has been proven in various types of cancer. However, the specific function of GAS5 in tumor-associated macrophages (TAMs) of endometrial cancer (EC) is elusive. Quantitative PCR results showed that GAS5 expression decreased in EC tissues and primary TAMs from EC tumors. Tumor-associated macrophage infiltration was significantly positively associated with the developmental stage of EC. Direct coculture of GAS5-overexpressing TAMs and EC cells showed that GAS5 enhanced phagocytosis, antigen presentation, and activation of cytotoxic T cells, and repressed “Don’t eat me” signals between TAMs and EC cells. Tumor formation in immunodeficient mice showed that GAS5-overexpressing macrophages could repress EC formation in vivo. GAS5 promoted M1 polarization by activating the microRNA-21– phosphatase and tensin homolog (PTEN)–AKT signaling pathway and directly repressing the nuclear accumulation and phosphorylation of oncogenic yes-associated protein 1 (YAP1) in TAMs. GAS5 inhibited the development of EC from both innate and adaptive immunity by transforming TAMs from a protumor to an antitumor phenotype. These antitumor effects of GAS5 on TAMs were mediated by the activation of the miR-21-PTEN-AKT pathway and inhibition of YAP1.
1 INTRODUCTION
Endometrial cancer (EC) is one of the most common gynecological malignancies, and its pathogenesis remains unclear.1 Considerable attention has been recently focused on long noncoding RNAs (lncRNAs), which have been shown to regulate many key biological functions.2 Increasing evidence has shown that abnormal expression of certain lncRNAs could play an important function in cancer biology.3, 4 Long noncoding RNAs can act as oncogenes (such as HOX transcript antisense RNA)5 or tumor suppressors (such as growth arrest-specific transcript 5 [GAS5]).6 Evidence shows that GAS5 is abnormally expressed in a variety of cancers, such as non-small-cell lung cancer, hepatocellular carcinoma, breast cancer, and gastric cancer.7-10 However, the function and mechanism of GAS5 in EC are largely unknown.
The relationship between cancer and immunity was first identified from observations of significant immune cell infiltration in malignant tumor samples.11 Tumor-associated macrophages (TAMs) are the most common immune cells and are essential effector cells in the tumor microenvironment.12 M2 polarization (protumor type) is more abundant in cancer tissues than M1 (antitumor type) and has been shown to play an important role in promoting tumor progression.13 Extensive TAM penetration (mainly M2 type) is usually directly related to the poor prognosis of certain gynecological malignancies, including breast, ovarian, and endometrial cancers.14-16 Tumor-associated macrophages isolated from EC can significantly promote tumor progression by inducing angiogenesis and accelerating cancer metastasis.17 Interestingly, GAS5 has been proven to promote the transition of M2 to M1 polarization of macrophages under different conditions,18, 19 indicating that GAS5 might also play a pro-inflammatory and anticancer role in the TAMs of EC. Therefore, we aimed to elucidate the function and mechanism of GAS5 lncRNA in inhibiting the development of EC by promoting antitumor function of TAMs.
In the current study, we found that GAS5 expression was significantly reduced in EC and TAMs isolated from EC tissues. Growth arrest-specific transcript 5 indirectly inhibited the proliferation and migration of EC cells. In addition, GAS5 activated the effect of devouring tumor cells and enhanced the antigen presentation to T cells, thus activating both innate and adaptive antitumor immune responses, thereby inhibiting EC growth and progression. In the EC tumor microenvironment, GAS5 inhibited EC development by activating the microRNA-21 (miR-21)–phosphatase and tensin homolog (PTEN)–AKT signaling pathway and repressing a key oncogenic factor, yes-associated protein 1 (YAP1), in TAMs. Collectively, GAS5 could reshape the tumor immune microenvironment to inhibit the development of EC tumors by translating TAMs from a protumor to an antitumor state. Therefore, GAS5 is a potential therapeutic target for EC immunotherapy.
2 MATERIALS AND METHODS
2.1 Patients with EC and ethics statement
Patients with EC were recruited from the Second People’s Hospital of Shenzhen. With the approval of the Ethics Committee for Health Medical Research of the Second People’s Hospital of Shenzhen, EC tissues and adjacent normal tissues were surgically removed. All patients with EC provided informed consent to the relevant experimental scheme.
2.2 Primary culture of EC cells from patients
Tumor tissues and adjacent tissues were placed in Petri dishes, PBS was added, and the tissues were cut into pieces in a sterile culture condition after UV sterilization. The shredded tissue were placed into PBS containing 0.4% type IV collagenase and digested twice in a shaker (200 rpm) at 37°C for 15 min. The tissue that has not been digested into single cells was placed in a culture dish and ground with a sterile nylon net. After centrifugation at 2700 g for 5 min at 4°C, the digestion solution was discarded, cells were washed with PBS, and red blood cell lysate was added. The red blood cells were lysed at room temperature for 9 min, then centrifuged and the supernatant was discarded. The cell pellet was resuspended in PBS and filtered with a sterile nylon mesh (70 μm) to obtain single cell suspension. The primary EC cells were cultured in an incubator (5% CO2 at 37°C) with culture medium (DMEM-F12 medium; Sigma-Aldrich), 1% penicillin–streptomycin, 1% L-glutamine, and 20% FBS (Gibco, Thermo Fisher Scientific).
2.3 Sorting and primary culture of TAMs
Endometrial cancer tissues were digested in ImmunoCult-SF Macrophage Medium (STEMCELL Technologies) containing 1 mg/ml collagenase IV (Sigma-Aldrich) for 10 min at 37°C at a speed of 200 rpm. Individual cells from EC tissues were centrifuged after filtering using a sterile nylon mesh (70 μm; Falcon). Cell particles were resuspended in 100 μl PBS and sorted using anti-CD45, CD1c, CD15, CD20, CD11b, and CD206 (Miltenyi Biotec) Abs for 40 min at 4°C. After washing with PBS, the cells were resuspended in PBS for subsequent sorting (FACSAria II; BD Biosciences). The primary TAMs were sorted using CD45+CD1c−CD15−CD20−CD11b+CD206+ cells.
The dissected clinical EC tissues were digested in RPMI-1640 medium (Gibco) containing 1 mg/ml collagenase IV type (Sigma-Aldrich) and incubated at 37°C for 10 min (200 rpm). The digested single cells of the EC tissues were filtered and pelleted. Cells were resuspended in 100 μl PBS, and the cells were incubated with anti-human CD45 (Miltenyi Biotec) and CD3 (BioLegend) Abs at 4°C for 40 min. After washing, the cells were resuspended in PBS and sorted (FACSAria II; BD Biosciences) using the CD45+CD3+ sorting strategy.
2.4 Cell lines, transfection, and treatments
Cells of the EC cell line Ishikawa were cultured in an incubator (5% CO2 at 37°C) with culture medium (MEM [Sigma-Aldrich], 1% penicillin–streptomycin, 1% non-essential amino acid [NEAA], 2mM glutamine, and 10% FBS [Gibco, Thermo Fisher Scientific]). The EC cell lines AN3CA and HEC-1-B were cultured in an incubator (5% CO2 at 37°C) with culture medium (MEM [Sigma-Aldrich], 1% penicillin–streptomycin, 1% NEAA, and 10% FBS [Gibco, Thermo Fisher Scientific]). Small interfering RNAs of GAS5, YAP1, PTEN, and miR-21 mimics/inhibitor were purchased from GenePharma; GAS5 shRNA and overexpression lentivirus were purchased from Genechem. The transfection and transduction were carried out according to the manufacturer’s instructions.
2.5 Xenograft tumor model in nude mice
BALB/c nude mice (female, 20 ± 4 g, 5 weeks old) were purchased from the Animal Model Research Center. The animals were kept in the Specific Pathogen-Free Animal Laboratory of Anhui Medical University and fed ad libitum. All experiments were approved by the Animal Experimental Ethics Review Committee of Anhui Medical University. Nude mice were divided into four groups: Ishikawa, Ishikawa+THP-1-M, Ishikawa+THP-1-M-NC, and Ishikawa+THP-1-M GAS5. Ishikawa or THP-1-M cells (1 × 10⁶) were used for each mouse. A 100-μl cell suspension was injected under the skin into the right back of each mouse. Four weeks later, the mice were killed, and the tumors were removed for further evaluation. Tumor volume was calculated according to the following formula: length × width2 × 0.5.
2.6 Histopathological analysis
The tumor tissues were fixed in 4% formaldehyde. Paraffin-embedded tissues were cut into 5-μm sections for H&E staining. The sections were analyzed and examined under an optical microscope (Olympus).
2.7 Immunohistochemical assays
Paraffin-embedded tumor tissues were placed in 4% formaldehyde and baked at 60°C for 2 h. The tumor tissue was deparaffinized with xylene, dehydrated with gradient ethanol, and permeabilized for 30 min with 0.5% Triton X-100. After washing with PBS three times, samples were heated in a microwave for 10 min for antigen retrieval in 0.01 M citric acid buffer (pH 6.0). Slides were incubated for 15 min in 3% hydrogen peroxide to block endogenous peroxidase activity. The tissues were then incubated with anti-proliferating cell nuclear antigen (PCNA) (ab92552; Abcam), vascular endothelial growth factor (VEGF) (ab1316; Abcam), PTEN (22034–1-AP; Proteintech), AKT (10176–2-AP; Proteintech), p-AKT (4060s; Cell Signaling Technology) CD68 (ab125212; Abcam), CD163 (ab182422; Abcam), or YAP1 (12395s; Cell Signaling Technology) Abs at 4°C. After washing with PBS, slides were incubated at 37°C for 30 min in polyoxygenase anti-mouse/rabbit IgG. The specimen was dyed with a 3,3′-xylene tetrahydrochlorine solution and an erythrome resin.
2.8 Luciferase reporter assay
The sequence of GAS5 or PTEN 3′-UTR containing miR-21 binding sites was cloned into the pmirGLO vector (Promega). HEK293T cells were cotransfected with empty pmirGLO vector or pmirGLO reporter vectors containing GAS5 or PTEN 3′-UTR and negative control (NC) or miR-21 mimics. Dual luciferase reporter assay kits (Promega) were used to measure the activity of dual luciferase (firefly/Renilla) according to the manufacturer’s instructions.
2.9 Western blot analysis
The lysed total protein was electrically transferred to a PVDF membrane after electrophoresis. After blocking nonspecific proteins (Invitrogen), the PVDF membrane was incubated overnight at 4°C with primary Abs. After washing with PBS, the membrane was incubated with secondary Abs for 1 h and then visualized using the ECL-Chemical Luminescent Kit. The primary Abs used were as follows: anti-PTEN (22034–1-AP; Proteintech), AKT (10176–2-AP; Proteintech), p-AKT (4060s; Cell Signaling Technology), YAP1 (12395s; Cell Signaling Technology), p-YAP1 (ab76252; Abcam), and anti-β-actin (sc-47778; Santa Cruz Biotechnology).
2.10 Flow cytometry
Tumor tissues from EC cell-bearing mice were removed, minced, and digested into single cells. The cells were resuspended in 100 μl PBS and incubated with the indicated Abs at 4°C for 40 min. Anti-mouse MHC class II (BioLegend), CD11b (101263; BioLegend), CD86 (105032; BioLegend), CD206 (141708; BioLegend), CD3 (100235; BioLegend), CD8a (100713; BioLegend), γ-interferon (IFN-γ) (505808; BioLegend), anti-human CD11b (101263; BioLegend), CD86 (305412; BioLegend), CD206 (321119; BioLegend), CD3 (344747; BioLegend), CD8 (344747; BioLegend), IFN-γ (502528; BioLegend), p-P65 (Cell Signaling Technology), and Ki-67 (130–100–340; Miltenyi Biotec) were used. Cells were incubated with PBS twice before analysis using a flow cytometer (CytoFLEX; BD Biosciences). CytExpert analysis software (BD Biosciences) was used for the analysis.
2.11 Phagocytosis
THP-1-M cells were transfected with GAS5 siRNA and siRNA NC and cultured in a 37°C, 5% CO2 incubator for 48 h. Ishikawa cells were digested in a 1.5 ml Eppendorf tube, mixed evenly with carboxyfluorescein succinimidyl amino ester (CFSE) working solution, and incubated at 37°C and 5% CO2 for 20 min. After centrifugation, cells were washed with PBS. THP-1-M cells were centrifuged, resuspended in 100 μl PBS, and labeled with anti-human CD11b Ab for 40 min at 4°C. After washing with PBS once, THP-1-M (3 × 10⁵) cells were mixed with CFSE-labeled Ishikawa cells (1 × 10⁵) and cultured for 5 h. After washing with PBS, the cells were resuspended in 100 μl PBS and analyzed with an imaging flow cytometer (ImageStreamX Mark Ⅱ).
2.12 Live cell imaging
THP-1-M cells were transfected with GAS5 siRNA and siRNA NC and cultured in a 37°C, 5% CO2 incubator for 48 h. Ishikawa cells were digested in a 1.5 ml Eppendorf tube, mixed evenly with the CFSE working solution (BestBio), and incubated at 37°C and 5% CO2 for 20 min. After centrifugation, cells were washed with PBS. After centrifugation, THP-1-M cells were resuspended in 100 μl PBS, and the cells were labeled with anti-human CD11b Ab at 4°C for 40 min. After washing with PBS, THP-1-M cells were mixed with CFSE-labeled Ishikawa cells, and then THP-1-M cells (1 × 10⁵) and Ishikawa cells (3 × 10⁴) were cocultured for 2 h and monitored with a live cell imaging system (DMi8; Leica), with 5-min interval shooting for 2 h.
2.13 Chemotaxis
Human CD3+ cells were separated by flow cytometry using an anti-CD3 Ab (Miltenyi Biotec) according to the manufacturer’s instructions. Resting T cells were labeled using CFSE (BestBio) and used immediately after resuspension in RPMI and 0.5% BSA. A 24-well Transwell system (Corning) was coated with 10 µg/ml fibronectin (R&D Systems) in PBS for 3 h at 37°C. The PBS solution was carefully aspirated and labeled T cells were added to the top of the inserts. Conditioned media of THP-1 cells (siRNA NC or GAS5 siRNA) was then added to the bottom of the wells. After 4 h, the insert was removed, and the medium in the bottom reservoir was read for CFSE using a plate reader. The chemotactic index was defined as the fractional difference in fluorescence between treatment conditions and RPMI control, divided by the fluorescence of the control.
2.14 Evaluation of macrophage-dependent activation of CD8+ T cells
Mixed primary EC cells and Ishikawa cells (1 × 10⁵) were cocultured with primary TAMs (3 × 10⁵) and THP-1-M cells (3 × 10⁵) and incubated at 37°C, 5% CO2 for 24 h. Human CD3+ T cells (1 × 10⁵) from tumor tissues from EC patients were sorted by flow cytometry and cocultured with TAMs and THP-1-M cells in a 37°C, 5% CO2 incubator for 24 h. After digestion, the cells were washed with PBS and resuspended in 100 μl PBS, and the mixed cells were labeled with anti-human CD8 and anti-human IFN-γ Abs at 4°C for 40 min. After centrifugation at 370 g for 5 min, 200 μl PBS was added to resuspend the cells, and they were detected by flow cytometry.
2.15 RNA isolation and quantitative real-time PCR analysis
Total RNA was extracted from patient tissues or cultured cells using TRIzol reagent (TAKARA). The Hairpin-it miRNA qPCR Quantitation Kit (GenePharma) was used to measure the expression of miR-21 after reverse transcription. Quantitative PCR (qPCR) was carried out using the 7500 real-time PCR system (Applied Biosystems) using the following qPCR protocol: 95°C for 3 min, 40 cycles of 95°C for 12 s, and 62°C for 50 s. GAPDH and U6 were used as endogenous controls. All primers were designed by GenePharma. Relative mRNA expression levels were analyzed using the comparative period threshold (ΔΔCt) method.
2.16 Docking of lncRNA GAS5 to YAP1 protein structural model
Docking simulation of LncRNA GAS5 with YAP1 protein was carried out with the program Discovery Studio 2020 Client (DS 2020, Accelrys Software Inc.). Firstly, we used SWISS MODEL to build homology models based on the primary amino acid sequence of LncRNA GAS5 and YAP1 protein. Secondly, we used ZDOCK program in DS 2020 to analyze the rigid docking of LncRNA GAS5 and YAP1 protein. ZDOCK is a rigid-body docking algorithm that uses Fast Fourier Transform (FFT) to perform an exhaustive six-dimensional grid-based search in the translational and rotational space between the two molecules. Further refinement through RDOCK, followed by the evaluation of electrostatic and desolvation energies using CHARMM polar H force field. A full potential final minimization was then used to refine the substrate poses.
2.17 Statistical analysis
Student’s t-test, one-way ANOVA, and Kaplan–Meier survival curves were carried out for statistical analysis using SPSS version 21.0 (IBM). All experiments were carried out independently at least in triplicate, and data are expressed as mean ± SEM. Differences were considered statistically significant at p < 0.05.
3 RESULTS
3.1 Growth arrest-specific transcript 5 and TAMs are associated with endometrial hyperplasia and development of EC
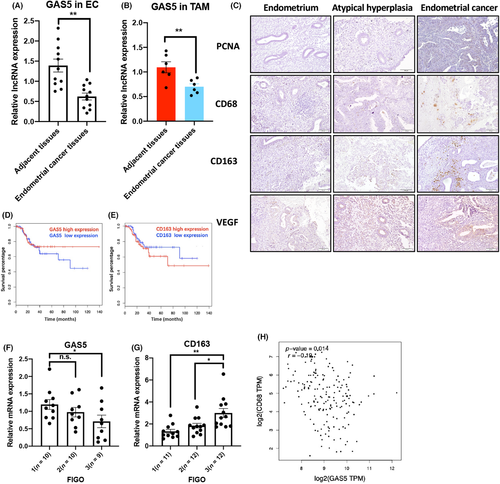
To investigate the role of GAS5 in the TAMs of EC, qPCR was used to compare the expression of GAS5 in EC tissues and sorted TAMs (sorting strategy in Figure S1). Compared with adjacent tissues, GAS5 significantly decreased in both EC tissues and sorted TAMs from EC tissues (Figure 1A,B). Given that TAMs are the most abundant cellular component in the EC microenvironment, CD68 (pan-macrophage marker) and CD163 (M2 macrophage marker) positivity were used to detect TAMs in EC tissues. Immunohistochemical (IHC) staining showed that CD68+ and CD163+ TAM infiltration gradually increased from normal endometrium and atypical hyperplasia of the endometrium to EC (Figure 1C). Other malignant markers of tumor, such as proliferation marker of tumor (PCNA) and neovascularization marker of tumor (VEGF), were also upregulated in EC tumor tissues (Figure 1C). By analyzing published RNA sequencing data (GEPIA2: http://gepia2.cancer-pku.cn/#index), both high expression of GAS5 and low expression of CD163 indicated a longer disease-free survival (Figure 1D,E). In G1–G3 EC (FIGO stage), the minimum expression of GAS5 and maximum infiltration of CD163+ TAMs suggest that GAS5 and TAMs might play opposing roles in EC progression (Figure 1F,G), which was validated by the negative correlation between GAS5 and CD163 in tumor tissues from patients with EC (Figure 1H). Taken together, this suggests that GAS5 could act as a tumor suppressor in EC by regulating TAMs.
3.2 Growth arrest-specific transcript 5 enhances the direct phagocytic ability of macrophages on EC cells
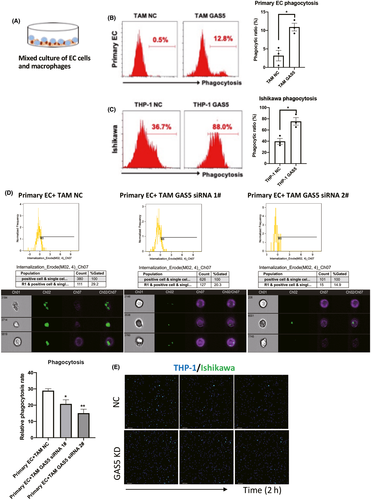
Macrophages are one of the main effector cellular components that cleave invading pathogens, including tumor cells.20, 21 To determine whether GAS5 enhances the ability of macrophages to directly devour EC cells, we cocultured CFSE-labeled primary EC cells or EC cell lines with GAS5-overexpressing macrophages (Figures 2A and S2). Flow cytometry was used to detect the phagocytic effect of GAS5-overexpressing macrophages on EC cells. Compared with the control group, GAS5 overexpression enhanced the ability of primary TAMs and THP-1 cells to devour primary EC cells and Ishikawa cells (EC cell line), respectively (Figure 2B,C). By contrast, GAS5 knockdown (KD) repressed the phagocytic ability of primary TAMs (Figures 2D and S3). To directly observe the dynamics of EC cells devouring by macrophages, we observed images of the uptake of CFSE-labeled Ishikawa cells by THP-1 cells during a 2-h live cell imaging experiment (Figure 2E). The images showed that GAS5 KD THP-1 cells demonstrated repressed phagocytotic ability of EC cells. Therefore, GAS5 enhanced the phagocytic ability of macrophages.
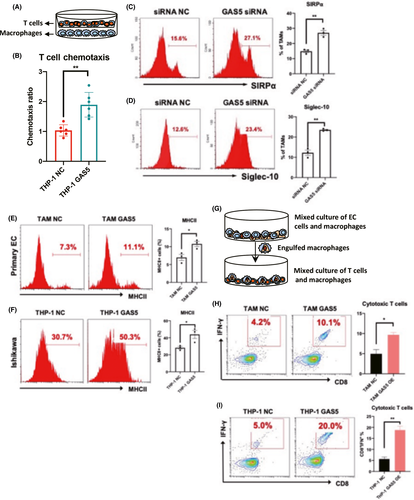
In addition, GAS5-overexpressing THP-1 cells directly induced the recruitment of T cells using an in vitro chemotaxis assay (Figure 3A,B). Interestingly, two antiphagocytic markers, signal regulatory protein α (SIRPα)22 and Siglec-10,23 were induced in GAS5 KD TAMs (Figure 3C,D) and THP-1 cells (Figure S4). To further determine whether the enhancement of phagocytic ability also strengthens antigen presentation in macrophages, EC cells and macrophages were cocultured, and the costimulatory molecule MHC class II was detected on macrophages. As predicted, we found an increase in MHC II in GAS5-overexpressing TAMs and THP-1 cells (Figure 3E,F). Furthermore, as shown in Figure 3G–I, the amount of IFN-γ-producing CD8+ effector T cells was also increased by GAS5 overexpression after mixed coculture with tumor-devouring macrophages.
3.3 Macrophages overexpressing GAS5 inhibit the formation of EC tumors in vivo
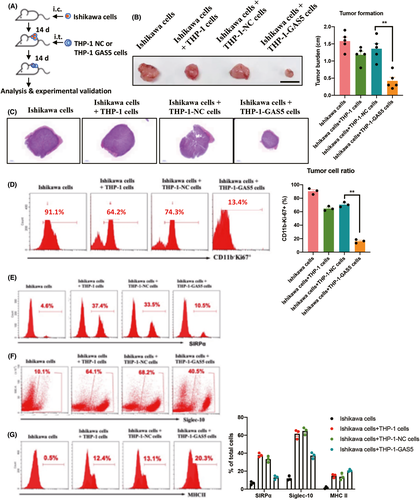
To determine whether GAS5-overexpressing macrophages inhibit the development of EC in vivo, nude mice were used to establish a tumor transplantation model. Ishikawa cells, an EC tumor cell line, were injected subcutaneously. After 2 weeks of tumor formation, THP-1-NC or THP-1-GAS5 cells were injected intratumorally (Figure 4A). After 4 weeks of tumor formation, the size of the tumor from Ishikawa+THP-1GAS5 cells was significantly smaller than that of the other control groups (Figures 4B,C and S5). Further analysis of tumor tissue showed a significant decrease in CD11b−Ki-67+ tumor cells formed by Ishikawa+THP-1-GAS5 cells (Figure 4D). As expected, “Don't eat me” pathway-related proteins, SIRPα and Siglec-10, were repressed in GAS5-overexpressing THP-1 cells (Figure 4E,F). In addition, FACS analysis further showed a significant increase of the antigen-presenting signal MHC II in tumors formed by GAS5-overexpressing THP-1 cells (Figure 4G). Together, these results showed that GAS5-overexpressing macrophages inhibit tumor formation of EC cells in vivo. This antitumor effect of GAS5 on EC cells was, at least partially, by direct devouring of tumor cells.
3.4 Growth arrest-specific transcript 5–miR-21–PTEN competitive endogenous RNA regulatory axis in TAMs
Bioinformatics analysis using DIANA Tools24 and online prediction software (miRanda25) showed a common binding site of an oncogenic miRNA, miR-21,26 in GAS5 and the 3′-UTR of PTEN, a well-known tumor suppressor27 (Figure 5A,B). To prove this, the miR-21 binding sites of GAS5 and PTEN and corresponding mutants were cloned into the dual luciferase-reporting gene vector (pmirGLO) and co-infected in HEK-293T cells with miR-21 mimics. Overexpression of miR-21 significantly reduced the fluorescence activity of the WT reporter group, but the fluorescence activity of the NC and mutant groups did not change. This indicates that GAS5 and PTEN could be suppressed by miR-21 through their corresponding binding sites (Figure 5C,D). Quantitative PCR and western blot analyses showed that miR-21 inhibited the expression of GAS5 and PTEN in primary TAMs (Figure 5E,F) and THP-1 cells (Figure S6). As expected, miR-21 and PTEN expression was upregulated (Figure 5G,H) and downregulated (Figure 5I), respectively, in EC tissues compared with adjacent tissues. An analysis of published databases indicated that patients with EC with high PTEN levels showed a prolonged disease-free period (Figure 5J). In addition, by analyzing published oncomiR datasets (http://oncomir.org/oncomir/search_miR_surv.html), we found that miR-21 was also a potential diagnostic marker of EC (Figure 5K). Although the expression of PTEN and GAS5 was relatively low in EC tissues, a positive correlation was still observed in patients with EC (Figure 5L). Western blot and qPCR results further indicated that GAS5 and PTEN were mutually regulated by miR-21 in a competitive endogenous RNA (ceRNA) regulatory axis (Figure 5M,N).
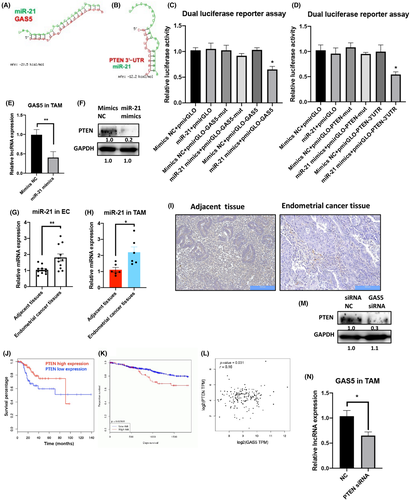
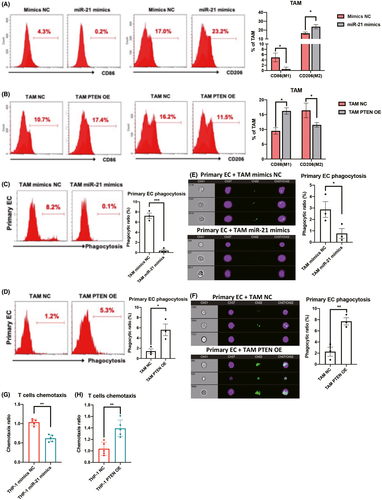
Furthermore, to prove the functions of the GAS5–miR-21–PTEN axis in macrophages, miR-21 mimics and PTEN-overexpression constructs in lentiviruses were used (Figure S7). Flow cytometry and qPCR results showed that miR-21 mimics could induce M2 expression while repressing the M1 marker (Figures 6A and S8). In contrast, PTEN overexpression promoted M1 expression and inhibited M2 markers (Figures 6B and S8). MicroRNA-21 mimics and PTEN overexpression repressed and induced the phagocytic effects of TAMs and THP-1 cells (Figures 6C,D and S9), which was further validated by imaging cytometry (Figure 6E,F). In addition, by using an in vitro coculture system of T cells and miR-21 or PTEN-overexpressing TAMs and THP-1 cells, T cell recruitment was repressed and induced by miR-21 mimics and PTEN overexpression, respectively (Figure 6G,H). Collectively, miR-21 and PTEN exert opposing functions in TAMs of EC through direct interaction.
3.5 Phosphatidylinositol 3-kinase/AKT is a closely associated signaling pathway of GAS5 in TAMs
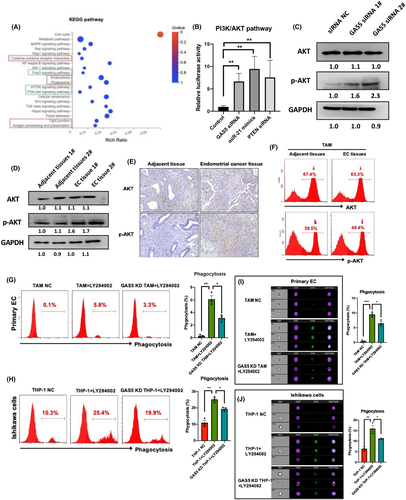
To further determine the related pathway of GAS5, RNA sequencing was used to assess the effects of GAS5 on TAMs at the transcriptome level. Kyoto Encyclopedia of Genes and Genomes (KEGG) pathway analysis results indicated that the PI3K/AKT pathway was significantly related to GAS5 in TAMs (Figure 7A). Phosphatidylinositol 3-kinase/AKT is a known oncogenic pathway in various tumor cells, including EC,28, 29 but the role of this pathway in TAMs of EC is still elusive. We initially used a pathway reporter assay to show that the GAS5–miR-21–PTEN axis could repress the PI3K/AKT pathway in THP-1 cells (Figure 7B). Combined with western blot results, it was further confirmed that GAS5 inhibits the PI3K/AKT pathway in both TAMs and THP-1 cells (Figures 7C and S10). Immunohistochemistry, western blot and FACS results also indicated that the PI3K/AKT pathway was activated in EC tissues and primary TAMs (Figure 7D–F). To confirm the effects of the AKT pathway on the phagocytosis of TAMs and THP-1 cells, the PI3K/AKT pathway inhibitor LY294002 was used to treat primary TAMs and THP-1 cells in vitro. Flow cytometry results indicated that LY294002 could induce phagocytic effects of macrophages on primary EC cells and Ishikawa cells in vitro (Figure 7G–J). Furthermore, treatment of GAS5 KD macrophages with LY294002 repressed the LY294002-induced phagocytosis of macrophages (Figure 7G–J). Taken together, GAS5–miR-21–PTEN-PI3K/AKT is a potential antitumor axis in TAMs of EC.
3.6 Growth arrest-specific transcript 5 represses oncogenic effects of YAP1 through direct interaction in TAMs
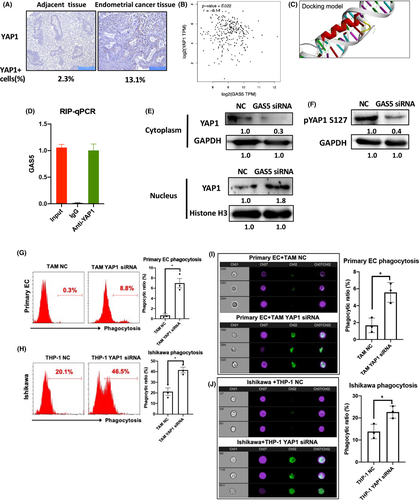
Both GAS5 and YAP1 have been reported to directly interact in colon cancer,30 and we investigated the relationship between GAS5 and YAP1 in EC. First, YAP1 expression was detected in EC tissues using IHC. Results showed that YAP1 increased in EC tissues compared with adjacent tissues (YAP1+ cells were 2.3% in adjacent tissue and 13.1% in EC tissues; Figure 8A). A negative correlation was found between GAS5 and YAP1 in EC (Figure 8B). In addition, the docking of GAS5 and the YAP1 fragment was superimposed (Figure 8C). An RNA immunoprecipitation assay confirmed that GAS5 and YAP1 bound directly in THP-1 cells (Figure 8D). In addition, western blot results of the cytoplastic/nuclear protein ratio of YAP1 isolated from TAMs showed that GAS5 inhibited the nuclear accumulation of YAP1 (Figure 8E). Notably, GAS5 KD also reduced the phosphorylation of YAP1 serine 127 (p-YAP1) (Figure 8F). In general, these results show that GAS5 inhibits YAP1 by promoting YAP1 phosphorylation and inhibiting YAP1 cytoplasm–nucleus transition. To prove the function of YAP1 in macrophages, YAP1 siRNA was used to decrease endogenous expression of YAP1 in THP-1 cells (Figure S11). The siRNA-mediated KD of YAP1 induced the phagocytic effects of both TAMs and THP-1 cells (Figure 8G,H). Imaging cytometry results further proved that the devouring of primary EC cells and Ishikawa cells was promoted in YAP1 KD TAMs and THP-1 cells, respectively (Figure 8I,J). In summary, GAS5 could repress the oncogenic effects of YAP1 by directly inhibiting nuclear accumulation and phosphorylation of YAP1 in TAMs.
4 DISCUSSION
Endometrial cancer is the most common gynecological cancer, and its incidence is increasing.31 Macrophages in the tumor microenvironment are referred to as TAMs. In EC, evidence showed that TAM accumulation in the tumor microenvironment is associated with tumor progression and metastasis (including angiogenesis and invasion). Tumor-associated macrophages are an important part of the microenvironment of solid tumors and are associated with adverse prognostics, which is becoming an attractive target as a novel treatment strategy to improve outcomes for patients with EC. Tumor-associated macrophages are recruited from PBMC or resident macrophages, and the recruitment of macrophages into tumors is “domesticated” by tumor cells. Tumor cells secrete a variety of cytokines and chemokines, such as colony-stimulating factor-132 and monocyte chemoattractant protein-1,33 to attract and recruit macrophages. In the present study, our data revealed that GAS5 is downregulated in TAMs from EC tissues. We also observed a correlation between the inhibition of GAS5 and the increase in TAMs infiltration, particularly M2-like TAMs. Therefore, we hypothesize that GAS5 may play a “tumor suppressor” role in the TAMs of EC.
Studies have shown that chronic inflammation is closely associated with EC.34 However, the correlation between inflammation and endometrial hyperplasia remains elusive. The results showed that macrophages were significantly infiltrated in the early stages of endometrial hyperplasia, and the degree of macrophage infiltration was positively related to EC progression. Monocytes were recruited into the EC microenvironment and differentiated into CD163+ M2 TAMs. Tumor-associated macrophages have been reported to promote cancer development by promoting proliferation, migration, and angiogenesis, and inhibiting cytotoxic T cell activity.17, 35
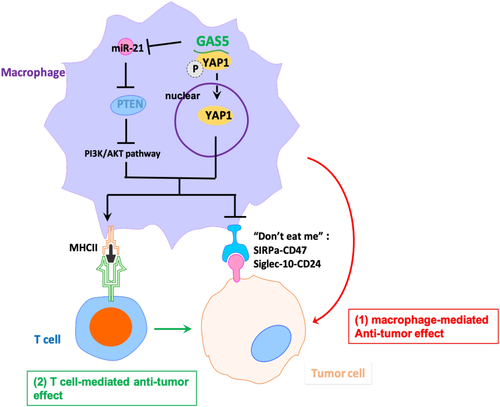
In the present study, we proposed a dual molecular mechanism for the antitumor effects of EC by TAM reprogramming. Growth arrest-specific transcript 5 and PTEN initially form a ceRNA regulatory axis through competitive suppression of oncogenic miR-21, which further inhibits the AKT signaling pathway by repolarizing TAM from M2 to M1. The direct anticancer effects of PTEN have been proven in various tumor cells, including EC.36, 37 However, the effect of PTEN on TAMs in EC has not yet been reported. We found that PTEN inhibited M2 polarization of TAMs and promoted the direct phagocytosis of EC cells and subsequent antigen-promoting ability of TAMs, which broadens the anticancer mechanism of PTEN in EC. Moreover, we showed that GAS5 directly binds to YAP1 and inhibited YAP1 phosphorylation and nuclear accumulation of YAP1 in TAMs, thereby inhibiting the oncogenic effects of YAP1 in TAMs. Although the oncogenic effects of YAP1 have been reported in a variety of tumors,38, 39 the role of YAP1 in TAMs from the EC environment remains elusive. For the first time, we found that YAP1 expression was quite high in EC TAMs and that YAP1 KD in TAMs mimicked the effects of GAS5 overexpression. In summary, GAS5 simultaneously achieved the anticancer effect of promoting TAM M1 polarization of ECs through a dual antitumor mechanism. Combined with the direct anticancer effects of GAS5 in EC cells, we believe that GAS5 could inhibit the development of EC as a key noncoding regulatory factor through multiple mechanisms (Figure 9).
However, there are some limitations to our study. First, the specific role of GAS5 in EC tumor cells is not fully illustrated. If we could prove that GAS5 plays an antitumor role in both EC tumor cells and TAMs, this dual effect could be a novel treatment target against EC. Second, we are constructing a GAS5 macrophage-conditional KO mouse model to further explain the role of GAS5 in TAMs in EC in vivo. Finally, we need to expand the sample size of EC patients. The role of GAS5 in different subtypes of EC and the synergic relationship between GAS5 and existing EC therapeutic drugs are also worth investigating in the future.
ACKNOWLEDGMENTS
This study was supported by grants from Shenzhen Science and Technology Innovation Committee (JCYJ20210324102806018 and JCYJ20210324103001003), the Sanming Project of Medicine in Shenzhen (SZSM201812041) and Clinical Research Funding from Shenzhen Second People’s Hospital (20203357030).
CONFLICTS OF INTEREST
The authors declare no competing interests.


