PVT1-derived miR-1207-5p promotes breast cancer cell growth by targeting STAT6
Funding Information
Medical Scientific Research Foundation of Tianjin, China, (Grant / Award Number: ‘Project No. 13KG140‘) National Natural Science Foundation of China, (Grant / Award Number: ‘Project No. 81330029‘).
Abstract
Accumulating evidence indicates that ectopic expression of non-coding RNAs are responsible for breast cancer progression. Increased non-coding RNA PVT1, the host gene of microRNA-1207-5p (miR-1207-5p), has been associated with breast cancer proliferation. However, how PVT1 functions in breast cancer is still not clear. In this study, we show a PVT1-derived microRNA, miR-1207-5p, that promotes the proliferation of breast cancer cells by directly regulating STAT6. We first confirm the positive correlated expression pattern between PVT1 and miR-1207-5p by observing consistent induced expression by estrogen, and overexpression in breast cancer cell lines and breast cancer patient specimens. Moreover, silence of PVT1 also decreased miR-1207-5p expression. Furthermore, increased miR-1207-5p expression promoted, while decreased miR-1207-5p expression suppressed, cell proliferation, colony formation, and cell cycle progression in breast cancer cell lines. Mechanistically, a novel target of miR-1207-5p, STAT6, was identified by a luciferase reporter assay. Overexpression of miR-1207-5p decreased the levels of STAT6, which activated CDKN1A and CDKN1B to regulate the cell cycle. We also confirmed the reverse correlation of miR-1207-5p and STAT6 expression levels in breast cancer samples. Therefore, our findings reveal that PVT1-derived miR-1207-5p promotes the proliferation of breast cancer cells by targeting STAT6, which in turn controls CDKN1A and CDKN1B expression. These findings suggest miR-1207-5p might be a potential target for breast cancer therapy.
Breast cancer is by far the most common malignancy in women, causing approximately 400 000 deaths annually worldwide.1 Chemoresistance and the development of distant metastasis are the major challenges in the treatment of breast cancer. MicroRNAs (miRNAs) are small, non-coding RNAs (18–23 nt in length) that downregulate the expression of target genes by blocking the translation or degradation of mRNAs.2 MicroRNAs play important roles in several biological processes, including cell growth, differentiation, and development.3-5 MicroRNAs that are dysregulated in breast cancer are of special interest, because in many cases, they are responsible for tumorigenesis by targeting and downregulating cancer-related genes. For example, miR-34c downregulation in breast cancer cells upregulates GIT1, which in turn promotes the migration and invasion of breast cancer.6 Overexpression of miR-1229 promotes cell proliferation and tumorigenicity and activates Wnt/β-catenin signaling in breast cancer.7 Thus, the identification of markers that would predict a patient's responsiveness to treatment, as well as track tumor progression and establish potential target therapies, is becoming increasingly important.8, 9
PVT1 is a long non-coding RNA located in the 8q24 gene desert, which spans a genome interval of more than 300 kb.10-12 An increased copy number and overexpression of PVT1 associate with many types of cancers, including breast and ovarian cancers, acute myeloid leukemia, and Hodgkin's lymphoma.13-17 However, how PVT1 functions in breast cancer progression is still not clear. PVT1 produces a wide variety of spliced non-coding RNAs, as well as a cluster of six annotated miRNAs (miR-1204, miR-1205, miR-1206, miR-1207-5p, miR-1207-3p, and miR-1208).18 Recently, there has been increased interest in the role of miR-1207-5p in cancer. For example, Chen et al.19 reported decreased miR-1207-5p expression in gastric cancer after regulation by the target gene human telomerase reverse transcriptase (hTERT), which was unrelated to patient age, sex, or survival time. Lü et al.20 reported that LncRNA BC032469 could competitively bind to miR-1207-5p to regulate hTERT expression and promote tumor suppression. Yang et al.21 showed that miR-1207-5p decreased the target gene STOML-2 in esophageal cancer, which was related to the differentiation status and pathological stage of the tumor, as well as to the presence/absence of lymph node metastasis. Wu et al.22 reported that increased expression of miR-1207-5p in ovarian cancer promoted the transformation of tumor cells to stem cells by activating the Wnt/β-catenin pathway. However, the role of miR-1207-5p in breast cancer, especially whether miR-1207-5p mediates its host PVT1's function in breast cancer, remains unknown.
In this study, we show that PVT1-derived miR-1207-5p promotes cell proliferation of breast cancer cells by directly regulating STAT6, which in turn activates CDKN1A and CDKN1B to control cell cycle. Moreover, correlated expression of PVT1, miR-1207-5p, and STAT6 were confirmed in breast cancer specimens.
Materials and Methods
Tissue samples and cell lines
Normal and primary breast cancer tissues harvested from 50 patients were collected with informed consent and confirmed by pathologists of the Tianjin Medical University General Hospital (Tianjin, China) and the ethics committee of the institute. Specimens were obtained during surgery and stored in the Department of Pathology of Tianjin Medical University General Hospital; they were formalin fixed and embedded in paraffin following the standard methods. All clinical data of patients such as age, tumor stage, and estrogen receptor, progesterone receptor, and human epidermal growth factor receptor 2 status were available and reviewed. The human breast cancer cell lines and 293T cells were obtained from the Chinese Academy Medical Science (Beijing, China). T-47D, MDA-MB-231, and BT-474 were cultured in RPMI-1640 medium (Gibco, Grand Island, NY, USA) supplemented with 10% FBS, 100 U/mL penicillin, and 100 μg/mL streptomycin at 37°C in a humidified atmosphere of 5% CO2. MCF-7, SKBR3, and 293T cells were cultured in DMEM (Gibco) supplemented with the same factors as described for T-47D, MDA-MB-231, and BT-474 cells. MCF-10A cells were cultured in M-171 medium supplemented with mammary epithelial growth factors (Invitrogen/Life Technologies, Carlsbad, CA, USA) at 37°C in a humidified atmosphere of 5% CO2. Each cell line was authenticated by inspecting the cell morphology and monitoring contamination by other cell types.
Ectopic expression and knockdown of PVT1 in T-47D cells
The PVT1 level was upregulated by treating T-47D cells with 10 nM estradiol (Solarbio Science and Technology, Beijing, China) for 24 h. Ethanol served as the vehicle control. The PVT1 level was knocked-down in T-47D cells by siRNA targeting the 5′-CAGCCATCATGATGGTACT-3′ sequence of cDNA and the non-silencing siRNA oligonucleotide that does not target any known mammalian gene was used as a negative control (Sangon Biotech, Shanghai, China). The cells were cultured in 6-well plates for 24 h, followed by transfection of target and control siRNAs with Lipofectamine 3000 (Invitrogen/Life Technologies) for 24 h. Thereafter, the cells were used for RNA extraction or functional assays.
RNA extraction and quantitative real-time PCR
To isolate miRNAs, total RNA was extracted from cells or tissues using TRIzol Reagent (TaKaRa Bio, Shiga, Japan). Total RNA was eluted with RNase-free water and stored at 80°C. DNase was used to remove contaminating genomic DNA. The concentration of RNA was determined by spectrophotometry using a NanoDrop instrument (Thermo Fisher Scientific, Waltham, MA, USA). To quantify the PVT1, MYC, pS2, STAT6, CDKN1A, and CDKN1B expression levels, total RNA was reverse transcribed to cDNA using an oligo-dT primer and the FastQuant RT Kit (Tiangen Biotech, Beijing, China). For miR-1207-5p, total RNA was reverse transcribed using a specifically designed stem-loop primer (Guangzhou RiboBio, Guangzhou, China). Quantitative real-time PCR (qPCR) was carried out using the SYBR-Green PCR Master Mix (TaKaRa Bio) in a Fast Real-Time PCR 7500 System (Life Technologies). The mature miR-1207-5p DNA sequence was used to design the forward primer, and the 3′ universal primer (Guangzhou RiboBio) was used as the reverse primer. The human U6 mRNA was amplified in parallel and served as the internal control. For mRNA detection, the gene-specific primers (Sangon Biotech) were as follows: PVT1 (forward, 5′-GTCTCCCTATGGAATGTAAG-3′; reverse, 5′-AGTGTCCTGGCAGTAAAAGG-3′); Myc (forward, 5′-TGGTCGCCCTCCTATGTTG-3′; reverse, 5′-CCGGGTCGCAGATGAAACTC-3′); pS2 (forward, 5′-GCGCCCTGGTCCTGGTGTCCAT-3′; reverse, 5′-GAAACCACAATTCTGTCTTTCAC-3′); STAT6 (forward, 5′-CCTCGTCACCAGTTGCTT-3′; reverse, 5′-TCCAGTGCTTTCTGCTCC-3′); CDKN1A (forward, 5′-CGACTGTGATGCGCTAATGG-3′; reverse, 5′-AGAAGATCAGCCGGCGTTTG-3′); and CDKN1B (forward, 5′-GTCAAACGTAAACAGCTCGAAT-3′; reverse, 5′-TGCATAATGCTACATCCAACG-3′). GAPDH (forward, 5′-GGAGCGAGATCCCTCCAAAAT-3′; reverse, 5′-GGCTGTTGTCATACTTCTCATGG-3′) served as the internal control. The qPCR reactions were undertaken at 95°C for 10 min, followed by 40 cycles at 95°C for 15 s and 60°C for 34 s. The ΔCt was calculated by subtracting the Ct of the U6 or GAPDH mRNA from the Ct of the miR-1207-5p or target mRNA. The ΔΔCt was then calculated by subtracting the ΔCt of the control from the ΔCt of the treatment group. The fold-change of the miRNA or mRNA was calculated using the 2−ΔΔCt method.
Transfection with miR-1207-5p mimic or miR-1207-5p inhibitor
Overexpression or knockdown of miR-1207-5p was carried out by transfection with the miR-1207-5p mimic or miR-1207-5p inhibitor (Guangzhou RiboBio), respectively. The cells were plated in 6-well plates for 24 h and then transfected for 48 h with the miR-1207-5p mimic (50 nM) or miR-1207-5p inhibitor (100 nM) using Lipofectamine 3000 (Invitrogen/Life Technologies). In parallel experiments, the cells were transfected with mimic and inhibitor negative controls (Guangzhou RiboBio). Thereafter, the cells were used for RNA/protein extraction or functional assays.
MicroRNA target prediction
We used TargetScan (http://www.targetscan.org/) to predict the target genes interacting with miR-1207-5p. The miR-1207-5p sequence was obtained from the miRBase webpage (http://www.mirbase.org/), and the 3′-UTR sequence of the target mRNA was downloaded from TargetScan.
Knockdown of STAT6 expression
STAT6 expression was silenced by siRNA as described elsewhere.23 Small interfering RNA oligonucleotide duplexes were chemically synthesized by GenePharma (Shanghai, China) based on the following sequences: STAT6-specific siRNA: 5′-AGACCUGUCCAUUCGCUCATT-3′ (sense), 5′-UGAGCGAAUGGACAGGUCUTT-3′ (anti-sense), NC: 5′-UUCUCCGAACGUGUCACGUTT-3′ (sense), 5′-ACGUGACACGUUCGGAGAATT-3′ (anti-sense). The knockdown of STAT6 was confirmed by Western blot analysis.
Luciferase reporter activity assay
To generate the pMIR-RB-3′-UTR construct, the STAT6 3′-UTR containing the target sites of miR-1207-5p and its mutant form were cloned into the pMIR-Report luciferase vector (Guangzhou RiboBio) between the HindIII and SacI sites. Approximately 1 × 10⁵ human breast cancer cells were seeded in 12-well plates and cultured for 24 h. Then 2 μg pMIR-control or recombinant pMIR report plasmid and 50 nM miR-1207-5p mimic or negative control were cotransfected into cells. The activity of firefly luciferase was measured using the Dual-Luciferase Reporter Assay (Beyotime, Jiangsu, China). The relative luciferase activity was normalized to the firefly luciferase activity.
Cell proliferation assay
Cells were seeded in a 96-well plate at 5 × 10³ cells per well and cultured at 37°C for an additional 1–4 days in medium supplemented with 10% CCK-8 (Solarbio Science and Technology Co., Ltd.) of the total volume until color conversion. Thereafter, the absorbance at 450 nm was measured using an ELISA plate reader. This assay was carried out independently at least three times.
Colony formation assay
Cells transfected with the miR-1207-5p mimic or miR-1207-5p inhibitor were seeded at 1 × 10³ cells per 60-mm culture dish. Fourteen days later, after Wright–Giemsa staining, the number of colonies was counted.
Cell cycle
For cell cycle analysis, detached cells were fixed overnight at 4°C in 70% ethanol, stained with propidium iodide, and analyzed with a FACScan flow cytometer (BD Biosciences, San Jose, CA, USA) and ModFit 3.0 software (Verity Software House, Topsham, ME, USA).
Western blot analysis
Western blot analysis was carried out using anti-STAT6 (1:2000), anti-CDKN1A (1:1000), anti-CDKN1B (1:1000), and anti-β-actin (1:1000) antibodies (all Abcam, Cambridge, MA, USA). The cells were detached with a cell lifter and lysed in RIPA lysis buffer (Solarbio Science and Technology). Approximately 25 μg protein was resolved on 12% T SDS–polyacrylamide gels and transferred to Immobilon-P membranes (Millipore, Billerica, MA, USA). After blocking with 5% non-fat milk, the membranes were incubated with primary antibodies at room temperature for 2 h, washed with Tris-buffered saline containing 0.1% Tween-20, and incubated with species-compatible secondary antibodies conjugated to HRP (1:10 000). The signals were visualized by enhanced chemiluminescence (Amersham Life Sciences, Little Chalfont, UK), and the individual intensities of the protein bands were quantified with ImageJ software (National Institutes of Health, Bethesda, MD, USA).
Statistical analysis
Data were expressed as the mean ± SEM from at least three independent experiments. For real-time PCR experiments, as well as the CCK-8, plate colony formation, and luciferase reporter assays, differences between two groups were analyzed by two-tailed Student's t-test. The Wilcoxon signed-rank test was used to compare the miR-1207-5p level in non-cancerous and cancerous breast tissues. The χ2-test was used to analyze the association of miR-1207-5p expression level with clinicopathological characteristics. Pearson's correlation was used to identify correlations among the miR-1207-5p, PVT1, and STAT6 expression levels. Differences were considered statistically significant for P-values less than 0.05 (*P < 0.05, **P < 0.01, ***P < 0.001).
Results
Correlation between miR-1207-5p and PVT1 expression levels
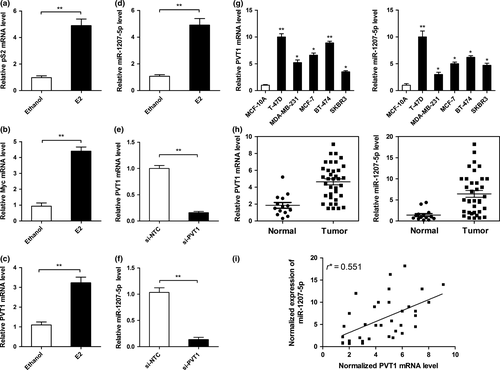
PVT1 gives rise to miR-1207-5p18 which prompted us to investigate the relationship between PVT1 and miR-1207-5p. In a previous study, estradiol was found to increase Myc expression, resulting in the binding of Myc to the E-box regions of PVT1 and in the activation of transcription.24 These findings suggest that there may be an estradiol–Myc–PVT1 regulatory axis in hormone-responsive cancer cells. Compared with the vehicle control (ethanol), the PVT1 level increased after treating the breast cancer cell line T-47D with estradiol for 24 h. The effects of estrogen were validated by a significant increase (P < 0.01) in the level of pS2, an estradiol-responsive gene, at 1–24 h after treatment (Fig. 1a). Quantitative PCR showed that PVT1 and Myc expression also increased in estrogen-treated T-47D cells and that the miR-1207-5p level increased significantly compared with that of the control (P < 0.01, Fig. 1b–d). We also silenced PVT1 by siRNA, which significantly reduced miR-1207-5p expression in T-47D cells (P < 0.01; Fig. 1e,f). The miR-1207-5p level was not affected after transfection with the control siRNA. Moreover, we investigated PVT1 and miR-1207-5p expression in T-47D, MDA-MB-231, MCF-7, BT-474, and SKBR3 cell lines; the results were compared with those of the human mammary epithelial cell line MCF-10A (Fig. 1g). PVT1 and miR-1207-5p expression was higher in cancer cell lines than in the MCF-10A cell line. To further investigate the relationship between the two genes, the levels of PVT1 and miR-1207-5p were quantified in non-cancerous and cancerous human breast tissues (Fig. 1h). PVT1 and miR-1207-5P expression was significantly higher in cancerous breast tissues than in non-cancerous tissues (P < 0.01 for PVT1; P < 0.05 for miR-1207-5p). In addition, there was a positive correlation in expression tendency for PVT1 and miR-1207-5p (Fig. 1i). Next, we analyzed the association between miR-1207-5p expression and the clinicopathologic status of breast cancer patients (Table 1). We found that miR-1207-5p levels were not correlated with age, tumor stage, lymph node stage, or estrogen receptor, progesterone receptor, or human epidermal growth factor receptor 2 among breast cancer patients.

| Characteristic | Cases | miR-1207-5p | P-value | |
|---|---|---|---|---|
| Low | High | |||
| Age, years | ||||
| ≤55 | 11 | 5 | 6 | 0.888 |
| >55 | 25 | 12 | 13 | |
| Tumor stage | ||||
| I | 13 | 7 | 6 | 0.549 |
| II–III | 23 | 10 | 13 | |
| N stage | ||||
| 0 | 20 | 11 | 9 | 0.296 |
| 1–4 | 16 | 6 | 10 | |
| ER status | ||||
| Positive | 26 | 14 | 12 | 0.199 |
| Negative | 10 | 3 | 7 | |
| PR status | ||||
| Positive | 20 | 8 | 12 | 0.332 |
| Negative | 16 | 9 | 7 | |
| HER-2 status | ||||
| Positive | 32 | 16 | 16 | 0.345 |
| Negative | 4 | 1 | 3 | |
- ER, estrogen receptor; HER-2, human epidermal growth factor receptor-2; PR, progesterone receptor.
miR-1207-5p promotes breast cancer cell proliferation
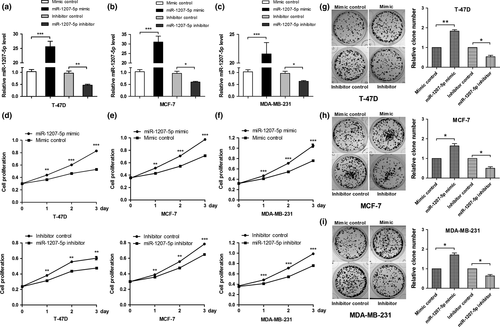
To investigate the role of miR-1207-5p in breast cancer cell proliferation, T-47D, MCF-7, and MDA-MB-231 cells were transfected with the miR-1207-5p mimic or miR-1207-5p inhibitor and their respective controls. miR-1207-5p expression in cells transfected with the miR-1207-5p mimic was significantly higher (P < 0.001) than in the control, whereas miR-1207-5p expression in cells transfected with the miR-1207-5p inhibitor was significantly lower (P < 0.01) than in the control (Fig. 2a–c). Cells were counted for four consecutive days by the CCK-8 assay. Increased miR-1207-5p expression promoted cell proliferation, whereas decreased miR-1207-5p expression suppressed cell proliferation (Fig. 2d–f). These data show that overexpression of miR-1207-5p promotes breast cancer cell proliferation.

miR-1207-5p promotes breast cancer cell colony formation
To investigate the effects of miR-1207-5p in breast cancer cell colony formation, T-47D (Fig. 2g), MCF-7 (Fig. 2h), and MDA-MB-231 (Fig. 2i) cells were transfected with the miR-1207-5p mimic or miR-1207-5p inhibitor and their respective controls. The cells were cultured for 14 days to allow colony formation. Compared with their respective controls, the number of colonies increased in cells transfected with the miR-1207-5p mimic, whereas the number of colonies decreased in cells transfected with the miR-1207-5p inhibitor. These data indicate that miR-1207-5p can regulate colony formation in breast cancer cells.
Effects of miR-1207-5p overexpression on the cell cycle in breast cancer cells
To better understand the role of miR-1207-5p in the proliferation of breast cancer cells, the cell cycle of T-47D, MDA-MB-231, and MCF-7 was analyzed by flow cytometry. Compared with the control, the percentage of breast cancer cells at G2 phase increased after transfection with the miR-1207-5p mimic (Fig. 3), whereas the percentage of cells at G2 phase decreased after transfection with the miR-1207-5p inhibitor. These data illustrate that miR-1207-5p regulates breast cancer cell proliferation by arresting the cell cycle.

miR-1207-5p regulates STAT6 expression by directly targeting the 3′-UTR of STAT6 mRNA
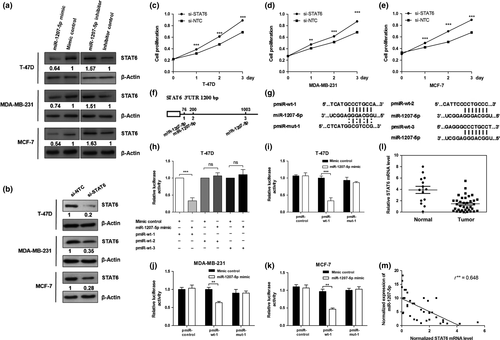
To investigate the role of miR-1207-5p in cell proliferation and cell cycle progression, the computational algorithm (TargetScan) was used to search for potential miR-1207-5p target genes. Among these candidate target genes, STAT6 was identified by the algorithm and selected for further study. We transfected T-47D, MCF-7, and MDA-MB-231 cells with the miR-1207-5p mimic or miR-1207-5p inhibitor. By Western blot analysis, the miR-1207-5p mimic significantly reduced the STAT6 protein levels in the three cell lines, whereas the miR-1207-5p inhibitor increased the STAT6 and protein levels (Fig. 4a). We also found that knockdown of STAT6 expression, as confirmed by Western blot analysis (Fig. 4b), promoted the proliferation of T-47D, MDA-MB-231, and MCF-7 cells (Fig. 4c–e). Thereafter, we used a dual luciferase activity assay to verify STAT6 as a target gene of miR-1207-5p. Bioinformatics analysis showed that there are three binding sites for miR-1207-5p in the 3′-UTR of STAT6 (Fig. 4f). To further investigate the target sites, we used a pMIR-reporter system that utilized the 3′-UTR of STAT6 containing the binding sites of miR-1207-5p (named pMIR-wt-1, pMIR-wt-2, and pMIR-wt-3) embedded in the pMIR-Report luciferase vector (Fig. 4g). As shown in Figure 4(h), only the pMIR-wt-1 luciferase level was decreased by miR-1207-5p. Then we generated some mutant sites (pMIR-mut-1) in pMIR-wt-1. Figure 4(i–k) showed that luciferase activity of pMIR-wt-1 was suppressed after transfection with miR-1207-5p mimic in breast cancer cells. In contrast, pMIR-mut-1 abolished the effect of miR-1207-5p on luciferase activity. To further validate miR-1207-5P and STAT6 relationships, the levels of miR-1207-5p and STAT6 were examined in non-cancerous and cancerous human breast tissues. Compared with the control, the levels of miR-1207-5p increased in cancerous breast tissues, as mentioned above, whereas the STAT6 level decreased (P < 0.01, Fig. 4l). Figure 4(m) also showed that there was a negative correlation in expression tendency for miR-1207-5p and STAT6. These results show that miR-1207-5p can regulate STAT6 expression by directly targeting the 3′-UTR of the STAT6 mRNA in breast cancer cells.

miR-1207-5p regulates the cell cycle in T-47D cells through CDKN1A and CDKN1B
To determine how miR-1207-5p regulates the cell cycle in T-47D cells, we measured the levels of the cell cycle-dependent kinase inhibitors CDKN1A and CDKN1B, which are activated by STAT6 in breast cancer cells.25 By Western blot analysis and qPCR, miR-1207-5p overexpression decreased CDKN1A and CDKN1B mRNA and protein levels, whereas miR-1207-5p inhibition increased CDKN1A and CDKN1B mRNA and protein levels (Fig. 5). These results indicate that miR-1207-5p regulates the cell cycle in T-47D cells via CDKN1A and CDKN1B.

Discussion
There has been little research on the function of PVT1 in breast cancer. Zhang et al.26 found that frequent mutation of rs13281615 was significantly associated with cell proliferation by influencing PVT1 expression in breast cancer. Guan et al.16 reported that amplification of PVT1 contributed to the pathophysiology of ovarian and breast cancer. Huppi et al.18 reported that PVT1 introns produced a cluster of six miRNAs, namely, miR-1204, miR-1205, miR-1206, miR-1207-5p, miR-1207-3p, and miR-1208. However, it is not known how PVT1 and PVT1-derived miRNAs regulate breast cancer progression. Their study is important, because it provides new insights on breast cancer progression, and if it can be halted. In the current study, we investigated the relationship between PVT1 and PVT1-derived miR-1207-5p and their involvement in human breast cancer. We speculated that PVT1 might act a host gene by regulating miR-1207-5p expression and then influencing breast cancer progression. Among the six annotated miRNAs, we found that miR-1207-5p was the most abundantly expressed miRNA in different breast cancer cells (Fig. S1). Our results first showed that there was a significant positive correlation between miR-1207-5p expression and that of its host gene, PVT1, in breast cancer tissues and different breast cancer cells, suggesting that the expression of one is dependent on that of the other.
Several investigators have shown coexpression of intronic miRNAs that act similarly on their host genes; however, other studies have suggested that their expression level is opposite to that of their host genes.27 Interestingly, Alvarez et al.28 reported no change in miR-1207-5p expression after a decrease in the PVT1 level. miR-1207-5p could also increase the levels of transforming growth factor-β1, plasminogen activator inhibitor 1, and fibronectin 1, but in a manner that was independent of PVT1 in normal human mesangial cells. These authors hypothesized that miR-1207-5p expression and regulation might be independent of the host gene. A change in the epigenetics of tumor cells might explain these differences in PVT1 and miR-1207-5p in tumor and other cells, which alludes to their different roles in different cell types and diseases. The relationship between intronic miRNAs and host genes is complicated, and at this point, additional research is required.
In this study, we found that abnormal miR-1207-5p expression influenced the proliferation, colony formation and cell cycle progression of breast cancer cells. Based on these results and bioinformatics, we predicted STAT6 to be a target gene of miR-1207-5p. Results from the luciferase activity assay also illustrated that miR-1207-5p downregulates STAT6 expression by directly binding to its 3′-UTR. STAT6 belongs to the STAT transcription factor family, which contains seven members (STAT 1–4, 5a, 5b, and 6), and they can be activated by an array of hormones, cytokines, and growth factors.29 STATs dissociate from the receptor after activation and then translocate to the nucleus, activating the transcription of their target genes by binding to cognate DNA response elements.30, 31 For example, STAT6 is an important member of the JAK–STAT pathway that can be activated by interleukin 4 (IL4) to activate the transcription of downstream genes. In breast cancer cells, STAT6 mediates IL4-induced growth inhibition.32 Papageorgis et al.33 found that targeting interleukin 13 receptor subunit α2 (IL13Rα2) activated the STAT6–tumor protein p63 pathway, which suppressed breast cancer lung metastasis. Wei et al.25 showed that STAT6 directly interacted with the transcription factor specificity protein 1, thereby activating the promoter activities of the cell cycle-dependent kinase inhibitors CDKN1A and CDKN1B in human breast cancer cells. This inhibited cyclin-dependent kinase activity at the G1 phase and retinoblastoma protein phosphorylation, which maintained cells at this phase of the cell cycle. There are other genes regulating the cell cycle, such as CDKN2A, CDKN2B34 and TP5335 that require further research. In our study, a decreased STAT6 level after miR-1207-5p overexpression downregulated the levels of CDKN1A and CDKN1B in T-47D, MCF-7, and MDA-MB-231 cells, whereas an increased STAT6 level after miR-1207-5p inhibition upregulated their protein levels.
In summary, PVT1-derived miR-1207-5p controls the cell cycle suppressors CDKN1A and CDKN1B by affecting the expression of the target gene STAT6, thereby regulating cell proliferation and inducing breast cancer. These results suggest that miR-1207-5p might be a potential target for breast cancer therapy.
Acknowledgments
This work was supported by the National Natural Science Foundation of China (Project No. 81330029) and the Medical Scientific Research Foundation of Tianjin, China (Project No. 13KG140). We thank Dr. Lan Xia Liu for her help throughout the study.
Disclosure Statement
The authors have no conflict of interest.


