Testing the environmental prediction hypothesis for community-wide mass flowering in South-East Asia
Associate Editor: Ferry Slik
Handling Editor: Sabrina Russo
Funding information
This study was funded by JSPS KAKENHI (JP26251042; JP17H06478) to A.S. and by Ministry of Science and Technology (MOST 107-3621-B-259-001-MY3), Republic of China, to YY.C.
Abstract
General flowering, in which hundreds of species synchronize their flowering at multi-year intervals, is a puzzle to ecologists. It is hypothesized that species taking part in general flowering time their reproduction to meet favorable environmental conditions for seedling establishment. We tested this environmental prediction hypothesis using 14-year weekly flower records of five Shorea species (Dipterocarpaceae) and daily meteorological data in a lowland rain forest in Malaysia. We first investigated causal inference between three potential flowering triggers (cooling, drought, and the synergistic signal of cooling and drought) and flowering. We then explored the causality between flowering triggers and moisture condition during seedling establishment. Our results demonstrated that the synergistic signal of cooling and drought causally influences flowering phenology with the highest predictability for the timing of flowering. Both drought and the synergistic signal of cooling and drought are causally linked to favorable wet conditions during seedling establishment, but the predictability of future rainfall by the synergistic signal was higher than the drought alone. These results support the environmental prediction hypothesis and raise the question as to whether climate change allows the prediction to hold for plant regeneration in the future.
1 INTRODUCTION
Evolutionary advantages of masting, the episodic synchronous production of a large amount of flowers and seeds, have long been debated (Norton & Kelly, 1988; Silvertown, 1980). One of the most frequently cited evolutionary explanations for masting is the predator satiation hypothesis (Janzen, 1971, 1974), which argues that masting evolved because of the survival advantage by satiating seed and seedling predators, thereby improving seedling recruitment. Other commonly cited explanations for masting are improved pollination efficiency for wind- (Herrera et al., 1998; Kelly et al., 2001) and animal-pollinated species (Sakai et al., 1999) and environmental prediction, namely “large reproductive episodes timed to anticipate favorable conditions for establishment” (Kelly, 1994). These hypotheses are not mutually exclusive but rather multiple evolutionary advantages attributable to masting.
The ultimate extreme example of masting is general flowering, in which hundreds of plant species reproduce synchronously at irregular multi-year intervals (Chan & Appanah, 1980; Janzen, 1974). General flowering is limited to the least seasonal lowland tropical rain forests of South-East Asia dominated by trees of the Dipterocarpaceae family (Appanah, 1985; Ashton et al., 1988; Curran, 1994). An even higher degree of synchrony occurs at the seeding stage. Hosaka et al. (2017) reported that seed fall peaked within three weeks among most species in section Mutica of genus Shorea in Dipterocarpaceae, irrespective of staggered flowering among these species (Ashton et al., 1988). Previous empirical studies showed that predator satiation prevails for both pre- and post-dispersal processes in dipterocarp species which are loyal to general flowering (Curran & Webb, 2000; Hosaka et al., 2011, 2017; Iku et al., 2017; Nakagawa et al., 2005; Sun et al., 2007). The community-wide synchronous flowering in South-East Asia, spanning over 3–4 months, has also been reported to increase the activity of pollinators through pollinator migration and quick response in pollinator reproduction (Appanah & Chan, 1981; Sakai, 2002) around the time of general flowering. This would lead to improved pollination efficiency. Despite the wealth of evidence supporting the predator satiation and pollination efficiency hypotheses, there are no studies that test the environmental prediction hypothesis in these general flowering species. This is partly because of the difficulty in disentangling multiple factors affecting flowering time and in establishing a link between these factors and favorable conditions for seedling establishment.
The environmental prediction hypothesis (Burns, 2012; Williamson & Ickes, 2002) potentially bridges the proximal and ultimate explanations of general flowering. The hypothesis stresses that environmental cues used for flowering (i.e., a proximate factor) impart a significant success on seedling recruitment (i.e., an ultimate factor), suggesting flowering cues are linked to benign environmental conditions suitable for seed germination and seedling establishment. Proximate cues for synchronized flowering of tropical plants include drought (Brearley et al., 2007; Curran et al., 1999; Kobayashi et al., 2013; Sakai et al., 2006; Whitmore, 1984), El Niño Southern Oscillation (ENSO; Cannon et al., 2007; Chechina & Hamann, 2019; Numata et al., 2003; Wich & Van Schaik, 2000), cloud-free conditions and high solar radiation (Ng, 1977; van Schaik et al., 1993; Wycherley, 1973), a drop or a rise in mean temperature (Appanah, 1985, 1993; Wycherley, 1973), a drop of minimum temperature at night (Ashton et al., 1988; Yasuda et al., 1999), and a synergism of drought and cool temperature (Azmy et al., 2016; Chen et al., 2018; Satake et al., 2019; Ushio et al., 2019). Using drought as a flowering cue should be advantageous in less seasonal climates because drought-induced mortality and/or leaf shedding of canopy trees increases light levels in the understory, providing favorable regeneration environments for seedlings (Williamson & Ickes, 2002). In aseasonal tropical rain forests, light levels in the understory do not fluctuate much because all trees are evergreen and whole-tree leaf shedding, when they occur, are followed by rapid leaf flush. On the other hand, flowering after drought in these forests would also promote seedling survival because a wet period is likely to follow a drought, even in less seasonal climates such as in South-East Asia (Sakai, 2002). Although there is much debate about the environmental prediction hypothesis, it has not yet been tested for the South-East Asian region.
Here, we tested the environmental prediction hypothesis by leveraging a methodology of causal inference. If environmental prediction plays an important role for general flowering, proximate cues triggering flowering in the species should be associated with future environments suitable for seedling establishment (Figure 1). To unravel this association, a nonlinear state-space method of causal inference, called convergent cross-mapping (CCM) (Chang et al., 2017; Sugihara et al., 2012), is ideal because it allows the inclusion of any possible nonlinear influence of flowering cues on future environmental conditions that could enhance offspring survival. We used this approach to disentangle the unintuitive relationship between biotic and abiotic factors in aseasonal tropical rain forests.

 ) and daily mean temperatures over ni days. A drought unit (DU) equaled the difference between a threshold level of precipitation (
 ) and the cumulative sum of precipitation over ni days. Future water availability is calculated as the cumulative sum of rainfall over n4 days after n3 days for seed development
2 METHODS
2.1 Study species and flowering phenology
We used flowering data from five Shorea species (Dipterocarpaceae) in the 50-ha forest dynamics plot at the center of the Pasoh Forest Reserve in Negeri Sembilan, Malaysia (2° 58′ 47′′ N, 102° 18′ 29′′ E) between 2002 and 2014 (Chen et al., 2018). S. macroptera, S. parvifolia, S. acuminata, and S. leprosula are in section Mutica, and the final species, S. maxwelliana, is in section Shorea. We calculated flowering intensity as the proportion of adult trees flowering each week. Sample sizes were 10, 10, 13, 35, and 23 individuals for S. macroptera, S. parvifolia, S. acuminata, S. leprosula, and S. maxwelliana, respectively. Data collection methods are as per Chen et al. (2018).
2.2 Meteorological measurements
We used the same weather data as in Chen et al. (2018). Daily mean air temperature and daily rainfall data were collected from a weather station fixed to the top of a 52 m observation tower extending above the local forest canopy, 2 km from the 50-ha plot, from September 2001 to October 2014 (Chen et al., 2018; Kosugi et al., 2012). As diel temperature profiles at different vertical levels (1, 5, 10, 20, 30, 40, 45, and 53 m) were similar (Ohkubo et al., 2008), data at the height of 52 m were used as representative values.
2.3 Environmental triggers for flowering
 (1)
(1) and x(t) are the threshold temperature and temperature at time t, respectively. max(x1, x2) is a function that returns a larger value for the two arguments. Drought unit at time t, DU(t), is defined as the difference between the mean daily accumulation of rainfall over ni days and a threshold level of rainfall (
 ). This drought unit is given as:
 (2)
(2)where  and y(t) are the threshold level of rainfall and rainfall at time t, respectively. max(x1, x2) is defined similarly as in Equation (1). We generated time series for CU(t), DU(t) and a synergistic trigger of cool and drought unit (CU(t)×DU(t)) using estimated parameter values for nd, ni,
  and
and  for each of the five Shorea species in a previous study (Chen et al., 2018).
2.4 Causality test using Empirical Dynamic Modeling (EDM)
We tested the environmental prediction hypothesis by two steps. Step 1: we first examined a causality from each environmental trigger of flowering (CU(t), DU(t) and CU(t)×DU(t)) to flowering. Step 2: for each environmental trigger that is estimated to be a causal factor of flowering, we examined whether there is a causal relationship from the environmental trigger of flowering to future rainfall. Future rainfall was defined as the cumulative sum of rainfall over n4 days calculated from n3 days after all census dates (Figure 1). n3 and n4 represent periods for seed development and rainfall accumulation during the time of seed germination and early seedling establishment, respectively. To test the environmental prediction hypothesis, we examined all combinations of n3 and n4 within the range of 1–150 and 1–50 by integers, respectively.
For causal inference, we used the framework of EDM. EDM is based on the theories of state-space reconstruction (SSR) (Deyle & Sugihara, 2011; Sauer et al., 1991; Takens, 1981). A multivariate dynamical system forms an attractor (i.e., a set of states and their trajectories) in a multidimensional state space where each coordinate corresponds to each system variable. The SSR theories prove that the original attractor can be reconstructed with time-delayed coordinates of an observed time series even without information of all system states (Deyle & Sugihara, 2011; Sauer et al., 1991; Takens, 1981). The EDM framework builds on the SSR theories and enables us to identify the causal relationship between different variables and measure the effect sizes of detected causality from an observed time series.
To infer causal relationships between variables, Convergent Cross Mapping (CCM), one of the EDM methods, is adopted. CCM has been used for causality testing by leveraging a dynamical property so that the univariate embedding of an affected variable contains information of the affecting variable (Sugihara et al., 2012). Specifically, a causality test is performed by checking the predictive skill (also called cross-mapping skill), which is measured by Pearson's correlation coefficient ρ between observed values of a tentative causal variable and its predicted (cross-mapped) values (Sugihara et al., 2012; Figure 2). The predicted values are calculated using the information of the nearest neighbors on the SSR attractor of the affected variable with an optimal time-delayed dimension (Sugihara et al., 2012; Figure 2). This method has been increasingly used in ecological studies (Kawatsu & Kishi, 2018; Sugihara et al., 2012; Ushio et al., 2018) as well as earth system sciences (Runge et al., 2019) and brain sciences (Hirata et al., 2016) to dissect complex interaction networks among variables. Using this approach, we assumed no specific functional relationship between flowering cues and flowering phenomenon. This allows the inclusion of any possible nonlinear influence of flowering cues on water availability during seedling establishment. For Step 1, the affected variable is flowering phenology of each Shorea species and the affecting variable is each environmental trigger of flowering. For Step 2, the affected variable is future rainfall and the affecting variable is each environmental trigger that causes flowering (Table S1).
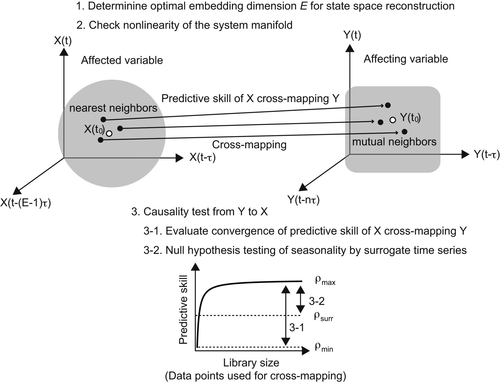
 and mutual neighbors (solid dots) of its counterpart (
 ) is defined as cross map from X to Y. The causality significance was evaluated using two criteria. The first is whether the predictive skills converge with an increase of library size (3–1). The second is null hypothesis testing by using surrogate time series generated from the hypothesis that seasonality affecting both X and Y generates high false predictive skill (3–2). ρmax and ρmin indicate predictive skills with maximum and minimum library size. ρsurr represents predictive skill from surrogate time series
Our CCM analysis took three steps in accordance with the standard protocol of EDM (Chang et al., 2017; Figure 2): (a) We determined the optimal embedding dimension E for the state space reconstruction using simplex projection (Sugihara & May, 1990; Sugihara et al., 2012) of affected variable, (b) we tested the nonlinearity of the SSR attractor constructed from time series data of affected variable, and (c) we performed causality tests by calculating the predictive skill of affected variable cross-mapping affecting variable. To cover biological processes of flowering initiation and to avoid overestimation of the analysis, we set time lag τ as 1 week and searched for the embedding dimension up to 30 weeks. To evaluate convergence of predictive skill, we calculated the predictive skill with the maximum library length (462 weeks both for flowering data and environmental trigger) and those with the minimum library length (=E + 1) using 1,000 bootstrap samples (ρmax and ρmin, respectively). Convergence is based on the fact that the longer the time series length, the smaller the distance between the trajectories on the manifold. When Y causally influences X, it leads to an increase of predictive skill with increasing time series length, converging to a plateau (Figure 2). Additionally, to check the false high predictive skill owing to seasonality for Step 1, we generated 1,000 twin surrogate data that preserve the nonlinearity and seasonality of the original affected time series but lose the causal relationship with the affecting variable (Thiel et al., 2006; Ushio et al., 2018). The predictive skill of the library variable cross-mapping surrogate (ρsurr) was then calculated. We evaluated the causality significance using two criteria (Figure 2): (a) The 95% lower confidence limit of the difference between ρmax and ρmin (ρmax–ρmin) is greater than zero, and (b) mean of ρmax is larger than the 95% upper confidence limit of ρsurr. Optimal embedding dimension and nonlinearity parameters for Step 1 and Step 2 are listed in Tables S2 and S3, respectively.
2.5 Measuring interaction strength from affecting to affected variables
To evaluate the interaction strength from the affecting to affected variables, we measured the strength and sign of effect from each affecting variable to affected variable listed in Table S1 using the S-map (sequential locally weighted global linear map) method (Chang et al., 2017; Sugihara, 1994). In the S-map method, partial derivatives of affected variable X by affecting (causal) variable Y (i.e., Jacobian ∂X/∂Y (Deyle et al., 2016)) are calculated in a multivariate state space at each time point, yielding coefficients that are a good approximation of the interaction strength from Y to X.
To calculate partial derivatives of affected variable by affecting variable, we created a multivariate SSR attractor as follows. First, we reconstructed a univariate attractor with dimension E with a time series of affected variable. Then, the last coordinate of the univariate embedding was replaced by an affected variable. Based on the multivariate attractor, the strength and sign of effect from affecting to affected variables were calculated using the S-map.
R version 3.5.1 (R Core Team 2018) was used for all EDM analyses with the EDM package (rEDM version 0.7.3) for R. We normalized each time series to have mean = 0 and sd = 1 so that Euclidian distance in the multivariate embedding is scale-free.
3 RESULTS
3.1 Causality from potential proximate cues of flowering to actual flowering
The causality of cool unit (CU) on flowering was not detected in all four species in section Mutica (Table S4). In S. maxwelliana, the only species in section Shorea, flowering was causally influenced by CU (Table S4). On the contrary, we found significant causality of drought unit (DU) and the combination of cool and drought units (CU × DU) on flowering in all five species (Table S4). The predictive skills of flowering phenology cross-mapping for CU × DU were highest among all environmental signals for all Shorea species (Table S4).
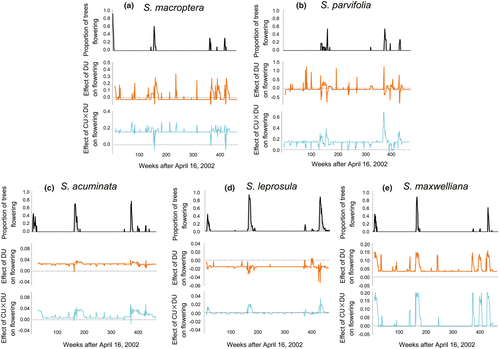
We next examined the effect of causal proximate cues (DU and CU × DU) on flowering by multivariate S-map analyses. In two species (S. acuminata and S. maxwelliana), the effect of DU on flowering was positive over almost all monitoring periods (Figure 3c,e). In the other three species, the effect of DU on flowering was a mix of positive or negative even during flowering (Figure 3a,b,d). Conversely, a positive effect from CU × DU on flowering was detected in all species, especially during flowering events (Figure 3). The effect of CU × DU on flowering was elevated when flowering happened in most of species, except for S. macroptera (Figure 3a). This result suggests that CU × DU is a more stable causal cue of flowering than the sole use of DU.
3.2 Predicting future rainfall with proximate cues
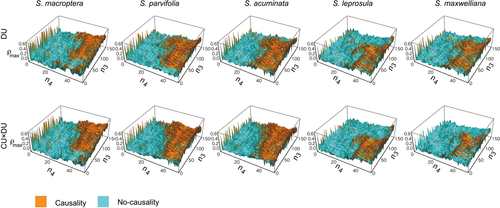
Both DU and CU × DU causally influenced future rainfall for diverse parameter values for seed development period (n3) in all species when the accumulation period of rainfall (n4) is greater than 30 days (Figure 4). The parameter ranges where causality was detected were similar between DU and CU × DU, but varied slightly among species. In the three early flowering species in section Mutica, the means of the fruit development period with causality were relatively long (93, 77, and 67 days for S. macroptera, S. parvifolia, and S. acuminata, respectively), while it was shortest in S. leprosula which has the latest flowering of all species studied (64 days; Figure S1a). The differences in values of n3 reflect the order of sequential flowering among these species (Chan & Appanah, 1980; Chen et al., 2018). The means of the accumulation period of rainfall (n4) with causality were not different between species (Figure S1b).
The effect of causal cues of flowering (DU and CU × DU) on the availability of rainfall during seedling established was estimated by S-map analyses. We set the fruit development period (n3) as the observed peak of fruiting for each species (22, 18, 17, 16, and 15 weeks after the time of flower peak for S. macroptera, S. parvifolia, S. acuminata, S. leprosula, and S. maxwelliana, respectively; Hosaka et al., 2017). The accumulation period of rainfall (n4) was set as 45–50 days for all species because strong causality from the environmental cue to future rainfall was detected (Figure 4). The effect of DU on rainfall availability at the peak of fruiting was significantly positive for most of accumulation periods of rainfall in all species (Figure 5a–e). Similarly, all species showed the significantly positive effect from CU × DU to rainfall availability at the peak of fruiting (Figure 5f–j), except for the accumulation period of 50 days in S. maxweliana (Figure 5j).
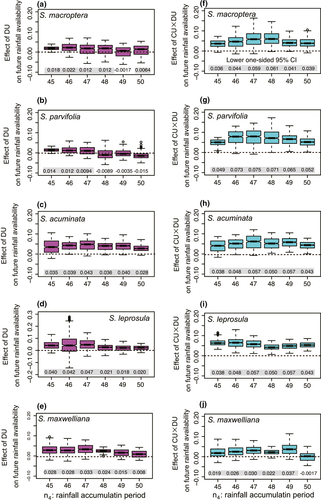
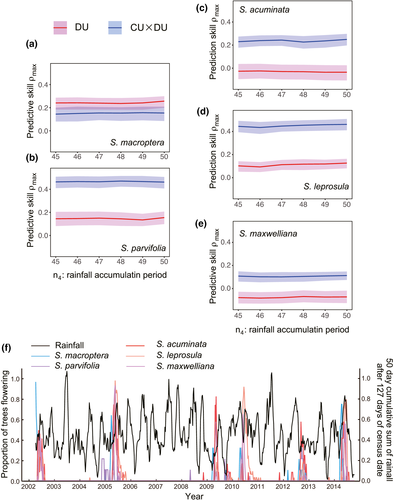
Lastly, we compared the predictive skill of future rainfall by DU and CU × DU. Although the predictive skill was not significantly different between DU and CU × DU in S. macroptera (Figure 6a), for the rest of four species, predictive skill was significantly higher in CU × DU than in DU (Figure 6b–e). The predictive skill of future rainfall by CU × DU varied among species, revealing relatively high predictive skill in S. parvifolia and S. leprosula (mean of ρmax > 0.4), while it was low in S. maxwelliana (mean of ρmax < 0.2). These results suggest that the combination of chilling and drought is a more effective signal for environmental prediction than drought alone, and species-specific flowering cues would result in differential skills to predict favorable environment conditions during seedling establishment. The mean of seed fall peak was 127 days after flowering. The cumulative sum of 50-day rainfall after 127 days from flowering revealed highly variable profiles with distinct peaks and valleys (Figure 6f). Projection of observed general flowering events on the plot showed that general flowering always coincided with an increasing phase of rainfall (Figure 6f). This consistency would be the result of optimizing flowering time in response to environmental signals that associate with rainfall during seed fall, namely the combination of cool temperature and drought.
4 DISCUSSION
Our study is the first to demonstrate that the timing of mass flowering in South-East Asia is coordinated with favorable wet conditions when germinated seedlings establish themselves. Empirical and theoretical tests on the environmental prediction hypothesis are scarce (but see Koenig et al., 2010) because it is difficult to disentangle complex developmental processes for reproduction and establish a link between proximate and ultimate factors of flowering and fruiting. However, the causal inference adopted in our study is simple enough to test the hypothesis. Because flowering time is an environmentally responsive trait that has critical impacts on plant fitness, plants should have evolved a mechanism to induce flowering in response to environmental cues with which offspring survival is maximized. Here, we showed that simultaneous cooling and drought is the best proximal cue of flowering because it is a good indication of favorable wet conditions for seedling establishment.
A previous study that adopted a linear model demonstrated that the synergistic signal of cooling and drought best explains the flowering phenology of Shorea species at the Pasoh Forest Reserve (Chen et al., 2018). We concluded the same, even when we used nonlinear time series analyses. In addition to demonstration of correlations between flowering cues and flowering, this new approach allows a cross-check of the direction of influence, namely causality. An increased level of the synergistic signal of cooling and drought enhances flowering in most of species (Figure 3), which is consistent with the recent finding that the positive effect of drought and low temperature on flowering at the community level monitored at the Lambir Hills National Park in Malaysia (Ushio et al., 2019). Only in S. macroptera, the effect of CU × DU on flowering sometimes dropped below zero after the onset of flowering event (Figure 3a). This negative effect from CU × DU on flowering in the earliest flowering species might be effective to suppress further floral initiation after anthesis to avoid a prolonged investment of resources for flowering.
The cool temperatures and droughts that synergistically initiate flowering are most likely to occur in the driest months of January and February at Pasoh, followed by flowering in April through June (Chen et al., 2018). Fruit development over the next few months results in synchronous seed fall in August to September (Hosaka et al., 2017), when rainfall starts increasing. Synchronized seeding and its timing are crucial for these species to achieve seed predator satiation as well as to meet the favorable wet conditions for seedling establishment.
It is known that many plants time their reproduction according to environmental factors, such as rainfall for desert plants (Juhren & Went, 1956), which exhibit astonishing synchrony. An important feature of the synchronized flowering and fruiting phenology in South-East Asian tropical ecosystems, different from that of desert plants, is that tropical trees respond to the environmental signals (cool temperature and drought, in this case) that occur prior to flowering and are causal to rainfall around the time of seed germination. Desert annuals use the rain itself as a trigger for seed germination, and after a short period of flowering and fruiting, offspring enter dormancy and await the next suitable condition for regeneration (Freas & Kemp, 1983; Gutterman & Gozlan, 1998). On the other hand, fruit development in dipterocarps and many species in the South-East Asian region takes at least two months and their seeds germinate under a different environmental condition from that of floral initiation. Moreover, an investigation of the soil seed bank at the Pasoh Forest Reserve found no germination of Shorea species (Putz & Appanah, 1987), which suggests that these seeds do not enter dormancy. The use of a proximal cue that is different from but causal to favorable environmental factors for offspring survival may evolve in organisms with long life cycle and no seed dormancy.
Timing of flowering is an evolutionary consequence via natural selection, especially by the strong filtering in the early life stages of seeds and seedlings. With a decade of monitoring, our results support the environmental prediction hypothesis by the indication of wet condition that causally links to the rare cool-dry flowering trigger. The next question is: how much moisture is needed for seedling establishment of dipterocarps? The answer lies in desiccation experiments. A common garden experiment reported that seedlings from aseasonal forests exhibit lower desiccation tolerance than seedlings of the same species from seasonal forests (Baltzer et al., 2008). Rigorous desiccation experiments on seedlings of diverse species could provide additional evidence to define the moisture threshold for early seedling establishment. This could facilitate further discussion on the environmental prediction hypothesis. Another question of interest is whether differential seed maturation periods (n3; Figure 1) result from fruit sizes. Combining our results and fruit size data (Numata et al., 1999) of the five species studied here, we found a positive correlation (Pearson's correlation coefficient = 0.82) between fruit size and seed maturation period. This suggests that an increase in seed maturation period resulted in increased fruit size. However, our study covers only five species and the small sample size precludes reliable statistical tests. Further studies involving more species are needed to confirm the pattern observed here.
Kurten et al. (2018) argued that the intermittent reproductive synchrony of dipterocarp species in ever-wet forests is a legacy of seasonal forests. A further step is to apply the analysis on diverse plant species in sites of different climate and flowering patterns. It may also be of interest to apply the same approach to test whether the prediction of future light conditions, another important environmental condition for seed development (Wright & van Schaik, 1994) and seedling establishment (Williamson & Ickes, 2002), could be a determinant for flowering time.
Dipterocarps and many other species that join general flowering are facing dramatic environmental changes. It is an urgent task to develop a reliable forecasting system to predict the timing of mass fruiting. To facilitate the forecasting system and to serve as validation, it is important to continue long-term monitoring on climate and flower/seed fall patterns in the region. Combining with improvements of technology on regional and local climate monitoring and advances of modeling, new ecological models could facilitate our understanding of the relationship between plant response and the upcoming challenges, and to help tropical forest restoration in the face of climate change (Kettle, 2010). For effective conservation and restoration planning, it is time to integrate climate and phenology models based on genetically informed mechanisms (Satake et al., 2013) and gain real-time perspective of phenological events in South-East Asia.
ACKNOWLEDGMENTS
The authors would like to thank K. Kawatsu and M. Seki for their valuable comments on data analyses.
DISCLOSURE STATEMENTS
The corresponding author confirms on behalf of all authors that there have been no involvements that might raise the question of bias in the work reported or in the conclusions, implications, or opinions stated.
AUTHORS CONTRIBUTION
A.S., T.L.Y., and Y.-Y.C. designed the research; Y.K. provided meteorological data; A.S. analyzed data; A.S. and Y.-Y.C. wrote the paper with inputs from all authors.
Open Research
DATA AVAILABILITY STATEMENT
The flowering phenology data that support the findings of this study are openly available from the Dryad Digital Repository: https://doi.org/10.5061/dryad.r667q (Satake et al., 2020). Meteorological data used in the study is accessible in AsiaFlux (http://www.asiaflux.net/).


