Utility of fibrinogen in the coagulation screen
In our Trust, a Clauss assay of fibrinogen concentration is routinely included in each coagulation screen, together with the prothrombin time (PT) and activated partial thromboplastin time (APTT). In contrast, many Trusts only perform a fibrinogen assay on samples with PT or APTT abnormalities. We therefore investigated the utility of including the fibrinogen assay in the routine coagulation screen for the detection of coagulopathy.
To assess this, 4000 consecutive coagulation screens requested in our Trust over a period of 1 week were analysed. Assays were performed using a Sysmex CS-2100i analyser (Sysmex Europe GmbH, Norderstedt, Germany), employing Innovin for the PT, Actin FS for the APTT and thrombin for the fibrinogen concentration (all from Dade-Behring, Siemens Healthcare Diagnostics, Erlangen, Germany) following the manufacturers’ recommended protocols. Reference ranges were 9–12 s for the PT, 23–31 s for the APTT and 1·8–4·0 g/l for fibrinogen.
One hundred and sixty-three samples (4·1%) were identified with a low (<1·8 g/l) fibrinogen concentration (range 0·29–1·79 g/l). Comparison with the PT and APTT results revealed that 30 of these samples (19·7%) had a normal PT/APTT, suggesting that the inclusion of the fibrinogen assay identifies a subgroup of patients who are potentially coagulopathic.
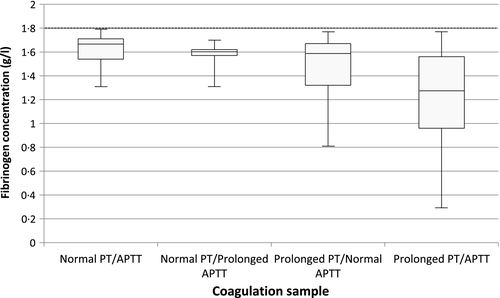
The range of fibrinogen concentrations associated with normal clotting times was 1·31–11·48 g/l. The PT was demonstrated to be more sensitive than the APTT at detecting low fibrinogen levels: 75·8% of the samples with low fibrinogen had a prolonged PT whereas only 50·3% had a prolonged APTT. Similarly, 29·6% of the samples with low fibrinogen had an isolated prolonged PT whereas only 3·3% had an isolated prolonged APTT. All fibrinogen levels below 0·8 g/l were associated with prolongation of either or both PT and APTT (Fig 1).

We plotted low fibrinogen concentrations against both PT and APTT (Fig 2) and found Pearson correlation coefficients (r) values of −0·452 (P < 0·0001) for the PT and −0·448 (P < 0·0001) for the APTT, which were not significantly different (P = 0·1).

Nine of the patients whose samples showed low fibrinogen levels received fibrinogen replacement in the form of cryoprecipitate. The mean fibrinogen concentration in these patients was 1·11 g/l. The indications for replacement were as follows: surgery (n = 2), liver disease (n = 3), disseminated intravascular coagulation (n = 1) and cardiac arrest (n = 1). Details were not available for the remaining two cases. The cost of each fibrinogen assay is approximately £1·50, suggesting that for every £667 spent, a case requiring fibrinogen replacement is identified.
Of the 31 samples with normal PT and APTT, the range of fibrinogen was 1·31–1·79 g/l and median 1·67 g/l. One case involved active bleeding (acute subdural haematoma) and none received cryoprecipitate. The mean fibrinogen concentration in those not receiving cryoprecipitate was 1·54 g/l, significantly different from those receiving replacement (P = 0·0015; 95% confidence interval 0·186–0·683 g/l). The median fibrinogen levels in those who received cryoprecipitate compared to those who did not were 1·07 and 1·59 g/l; these were statistically significant when compared using the non-parametric Mann–Whitney U test (U = 22·5, P < 0·05, two-tailed).
Figure 1 illustrates the range of fibrinogen stratified by PT and APTT (normal or prolonged). Of particular interest are samples with normal PT/APTT, as abnormal coagulation status may have been missed if fibrinogen analysis had not been undertaken. No patients in this subgroup received fibrinogen replacement therapy, which is unsurprising given the relatively high range of low fibrinogens (1·31–1·79 g/l) and lack of acute bleeding in these cases, consistent with current management guidelines (Hunt et al, 2015). Despite this, fibrinogen testing may have impacted on clinical decision-making in ways not specified in medical records and is therefore difficult to objectively quantify.
In clinical practice, fibrinogen replacement is considered at levels below 1–1·5 g/l (Levy & Goodnough, 2015). This threshold differs in bleeding and non-bleeding patients. The British Society for Haematology (BSH) guidelines (Hunt et al, 2015) suggest replacement with two pools of cryoprecipitate in major haemorrhage at fibrinogen levels <1·5 g/l (in the UK, fibrinogen concentrate is not licensed for use in acquired bleeding disorders). Consistent with this, our data above also suggest that this threshold of 1·5 g/l is followed in routine practice.
In non-bleeding patients undergoing procedures with a high bleeding risk, a threshold of 1 g/l is often used, but there is little evidence to support this (Hunt et al, 2015). Thus, there are multiple circumstances when a fibrinogen level between 1 and 1·5 g/l may prompt clinical intervention, and some of these patients will have normal PT and APTT.
In our study, 2 of the patients receiving cryoprecipitate did not meet BSH criteria (fibrinogen < 1·5 g/l and bleeding), probably due to the emergency nature of these cases (laparotomy and bleeding in chronic liver disease). BSH guidelines (Hunt et al, 2015) were appropriately followed in those with low fibrinogen who did not receive cryoprecipitate.
It has been suggested that low fibrinogen concentration itself can cause prolongation of PT and APTT when it falls below 1 g/l (Dempfle et al, 2008). In our study, many patients with low fibrinogen but prolonged PT or APTT had fibrinogen levels that were higher than 1 g/l, suggesting that there was a more general coagulopathy present, reflected in the low fibrinogen but not detected by the PT or APTT. We note that there was no visible change in the relationship between fibrinogen and PT/APTT (Fig 2).
Overall, we conclude that the measurement of fibrinogen concentration is clinically valuable and can indicate the presence of coagulopathy in a small number of cases when PT and APTT are normal but whose fibrinogen is low enough to warrant replacement therapy in particular circumstances.
Funding
None.
Conflict of interest
None.
Contributions
C. Tham and M. Laffan: analysed and interpreted data, wrote the manuscript. K. Lee: Collected and analysed data.


