Evaluation of the thermal property of bovine intramuscular adipose tissue using differential scanning calorimetry
Abstract
The thermal property of bovine intramuscular adipose tissue (IAT) was evaluated using differential scanning calorimetry (DSC) and compared with the melting point temperature (MP) of the fat extract of IAT, which was measured using the slip point method. The beef samples were classified according to the beef marbling score (BMS). Beef with a high BMS contained less protein than that with middle or low BMS. Beef with a high BMS contained significantly more fat than that with a low BMS (P < 0.05). The endothermic point temperature (EP) of IAT, measured by DSC, was significantly higher than the MP of IAT fat (P < 0.05). The EP showed no significant difference among the three marbling grade groups. Although the MP was correlated with the monounsaturated fatty acids (MUFA) content of IAT (R2 = 0.505), there was no correlation between the EP and the MUFA (R2 = 0.040). However, the EP of IAT treated with collagenase was relatively highly correlated with the MP (R2 = 0.655). Thus, these results suggested that DSC analysis would give us the practical thermal information regarding the melt-in the-mouth of beef such as the gelatinization of collagen, along with the melting of fat in IAT.
Introduction
Beef qualities such as tenderness, juiciness and flavor intensity have been shown to be affected by the chemical properties and amount of fat in beef (Dryden & Marchello 1970; Harrison et al. 1978; Melton et al. 1982; May et al. 1993). Favorable beef fat is located in the perimysium which bundles groups of muscle fibers as intramuscular adipose tissues (IAT). The IAT has many adipocytes that contain fat particles. The Japanese wagyu beef breed is characterized as having a greater IAT than subcutaneous adipose tissue (Xie et al. 1996). The positive relationship between IAT and palatability, such as tenderness and juiciness, is well-established (Thompson 2004; O'Quinn et al. 2012; Emerson et al. 2013; Hunt et al. 2014; Corbin et al. 2015). The meat quality standard devised by the Japan Meat Grading Association serves as the nationwide unified transaction standard for Japanese beef. Briefly, in Japan, the quality grade is categorized from one to five (high values indicate higher quality) according to marbling, meat color and brightness, meat firmness and texture, and fat color, luster and quality. The marbling grade is evaluated according to a Beef Marbling Standard, that ranges from one to 12 (higher values indicate more abundant marbling) (Japan Meat Grading Association 2014). As described above, the qualities of beef IAT are evaluated by visual inspection first of all. Beef palatability is frequently affected by chemical composition of beef.
In particular, the fatty acid (FA) composition of IAT is important for meat palatability (Joo et al. 2013). It has been reported that the concentration of oleic acid (C18:1) is positively correlated with overall beef palatability (Westerling & Hedrick 1979), which may be related to fat softness. Therefore, a high concentration of oleic acid is also associated with a low melting point of fat, and may be related to the overall palatability of the meat (Smith et al. 2006). A low melting allows the fat to melt at mouth temperature.
There are several fat melting point temperature (MP) measurement methods, the most common of which is the slip point or open capillary method (AOCS 1998). However, the slip point method requires many analytical steps, such as fat extraction, capillary preparation and determination.
As described above, IAT comprises of fat and other constituents such as water and connective tissues, which are composed of extracellular matrices (ECMs) (Bailey & Light 1989). Both marbling adipocytes and connective tissue composed of collagens are located in the ECM and brought together with muscle fibers (Dahimi et al. 2014). The collagen in the ECM is gelatinized by thermal denaturation. From this, it is assumed that ECM would have some influence on thermal property of beef IAT after cooking. Therefore, we should consider the feel of IAT in the mouth totally, as the structure of ECM would be changed by the thermal denaturation of collagen according to the melting of fat.
It is known that there are several kinds of conventional thermal analysis technologies, such as differential thermal analysis (DTA), dynamic mechanical analysis (DMA) and dielectric analysis (DEA) that can measure a material's performance directly at varying temperatures (Mengqiu & Xin 2015). Among them, differential scanning calorimetry (DSC) was developed and generally applied for determination of the phase transition of food fat (Keller et al. 1996; Loisel et al. 1998). DSC has some advantages over other thermal property evaluation methods: it is rapid and does not require excess sample preparation or the use of solvents (Dahimi et al. 2014).
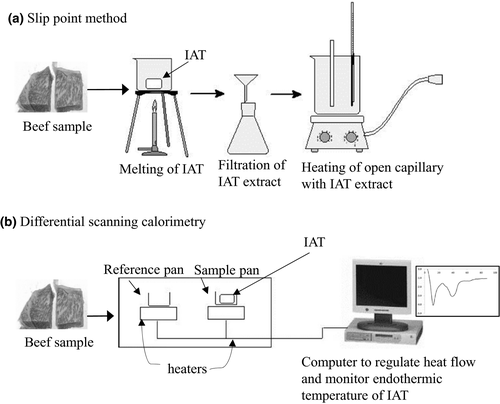
In the present study, we attempted the direct application of DSC to bovine IAT for the simple and rapid evaluation of the thermal properties of beef marbling. Measurement of the IAT endothermic peak temperature (EP) would detect the phase transition of the fat and collagen in IAT using DSC. Further, EP was compared with the MP of IAT fat using the slip point method (Fig. 1).
To avoid any extreme differences in meat quality, the wagyu beef used in this assessment was of consistent quality grade (A3–A5) and all came from the same cattle farming district in Japan. The beef samples were divided into three groups depending on the marbling grade and were subjected to a proximate composition analysis and MP and EP measurements using the slip point and DSC methods, respectively. Further, IAT treated with collagenase was subjected to a DSC analysis to clarify the effect of the ECM on the thermal property of IAT in contrast to the MP of IAT fat.
Materials and Methods
Collection of beef samples
Wagyu strip loins with a meat quality grade of A3–A5, which were produced in three particular farms in northern Ibaraki prefecture, were purchased from the Ibaraki Chuo Meat Center (Ibaraki, Japan). After the beef samples were aged at 4°C for 10 days, they were vacuum-packed and stored at −30°C until use. The beef samples were divided into three marbling grade groups of high BMS (No. 7 and No. 8), middle BMS (No. 6), and low BMS (No. 4 and No. 5), which are listed in Table 1.
| Beef grading score | |||
|---|---|---|---|
| High (n = 6) | Middle (n = 14) | Low (n = 9) | |
| Beef marbling score (BMS) | 7 and 8 (7.3 ± 0.2) | 6 (6.0 ± 0.0) | 4 and 5 (4.8 ± 0.2) |
| Beef color number | 3.8 ± 0.2 | 4.1 ± 0.1 | 3.7 ± 0.3 |
| Luster/color | 4.3 ± 0.2 | 4.1 ± 0.1 | 3.7 ± 0.3 |
| Firmness | 4.5 ± 0.2 | 4.0 ± 0.0 | 3.4 ± 0.2 |
| Texture | 4.5 ± 0.2 | 4.0 ± 0.0 | 3.6 ± 0.2 |
| Beef fat color | 3.0 ± 0.0 | 3.1 ± 0.1 | 2.8 ± 0.2 |
| Beef quality grade | A4 or A5 | A4 | A3 and A4 |
- Beef samples were categorized by three marbling grade groups: high BMS (No. 7 and No. 8), middle BMS (No 6) and low BMS (No. 4 and No.5). Results of the beef grading scores of the meat evaluation based on the meat quality standard devised by the Japan Meat Grading Association, are expressed as mean ± SE.
Proximate analysis
The proximate composition of beef samples, including the proportion of moisture, crude protein (CP) and crude fat, was determined (AOAC 2012). Briefly, the moisture content of the samples was measured by using the oven-drying method where minced meat is heated at 105°C for 12 h. The CP content was measured using the Kjeldahl method of nitrogen analysis and CP was calculated by multiplying nitrogen by 6.25. The crude fat content was determined by measuring of ethyl ether extract using the Soxhlet extraction method. The values shown here were all converted to grams per 100 g of raw meat.
FA analysis
The fat extraction from IAT was carried out following the method of Folch et al. (1957). Briefly, 1 g of IAT was weighed in a 20 mL test tube, where the fats were extracted using 2:1 (v/v) chloroform and methanol organic solvent mixture containing 0.05% 2,6-di-butyl-4-methylphenol. The mixture was then homogenized at 11 000 rpm for 60 s. The supernatant was recovered after the homogenate was centrifuged at 1600 × g at 4°C for 5 min. The previous organic solvent was added to rinse the remaining precipitate and the test tube. The rinsing solvent was centrifuged at 1600 × g at 4°C for 5 min, and the obtained supernatant was combined with the previous supernatant. An additional 4 mL of 0.5% sodium chloride was subsequently added to the whole extracted solution to enhance the separation of the lower organic layer containing fats from the aqueous layer. The organic solvents were completely dried under a nitrogen gas stream at 40°C after removal of the aqueous portion by pipette aspiration. The test tube containing the fat residue was flushed with nitrogen gas, securely capped, and stored at −80°C for a subsequent FA analysis.
Then FA methyl esters (FAME) were then prepared. The dried residue was dissolved in 1.0 mL toluene. Transesterification of FA was catalyzed by a 0.5 N methanolic base (Sigma-Aldrich, St. Louis, MO, USA) at 80°C for 20 min. After the reaction, the FAME mixture was extracted using hexane, 1.0 mL of which was transferred to a 2 mL vial for a gas chromatographic analysis.
A gas chromatographic system (GC-4000FID1; GL Science, Tokyo, Japan) equipped with a DB-23 (60 m × 0.250 mm × 0.15 μm) capillary column (Agilent Technologies, Palo Alto, CA, USA) was used for the FA composition analysis. A 1 μL sample of the FAME mixture was injected into the gas chromatographic system with a split-splitless injector and flame-ionization detector. The inlet temperature was 250°C and the split ratio was 50:1. The carrier gas was helium with a constant flow of 30 mL/min. The oven temperature was programmed at an initial temperature of 50°C and held for 1 min, followed by an increase of 25°C/min up to 175°C, 4°C/min up to 260 min, and held for 4 min. The detector was kept at 280°C, with an airflow of 450 mL/min and hydrogen flow of 40 mL/min. The Supelco 37 Component FAME Mix (Sigma-Aldrich, St Louis, MO, USA) was used as an external standard for the identification of FAME. The relative FA composition was calculated as the area ratios of the peaks and compared with the external standard.
MP measurement
The total IAT fat was prepared by heating of the IAT samples in an oven at 105°C for 4 h. The MP of IAT fat was determined using the slip point method (AOAC 1975). In essence, eight capillary tubes were collected for each adipose sample, and the IAT fat was originally drawn 10 mm into the capillary tubes while still warm on a hot stirrer. The capillary tubes were subsequently stored overnight at −30°C, and then placed vertically in a 500 mL chilled beaker. The temperature was gradually increased in the beaker at the rate of 1.0°C/min, and the temperature at which the IAT fat began to go up the capillary tube was recorded. Within sample variation was less than ± 1°C, and the results were written as the mean ± standard error (SE) of six samples, except for two extreme values.
Thermal analysis by DSC
Samples were obtained from the surface about 5 mm deep in the IAT. A Rigaku 8240 DSC system (Rigaku, Tokyo, Japan) was used for analyzing the EP temperatures of the IAT samples. IAT samples (50 mg) were weighed and placed in aluminum pans, covered and fixed on the sampled platform. The baseline was obtained with an empty hermetically sealed aluminum pan. Samples were subjected to the following temperature programs: cooled at 4°C, held for 30 min and heated from 4°C to 70°C at a rate of 2°C /min. The phase transition, including the endothermic peak for each sample, was obtained using the Rigaku ThermoPlus 2 software (Rigaku).
Collagenase-treated IAT was subjected to a DSC analysis. Briefly, 40 mg IAT was suspended into 40 μL of collagenase (EC 3.4.24.3, Clostridium histolyticum origin; Serva, Heidelberg, Germany) solution (2 mg collagenase/0.5 mmol/L CaCl2 containing 50 mmol/L imidazole buffer, pH 7.4). Pronase (EC 3.4.24.4, Streptomyces griseus origin; Sigma-Aldrich) solution (2 mg pronase/ 50 mmol/L imidazole buffer, pH 7.0) was used as control. Each suspension was put into the aluminum pan and hermetically sealed with an aluminum cap. Then the mixture of IAT and protease mixture was then stored at 4°C for 2 h for a proteolytic reaction before EP measurement. After the reaction, the samples were subjected to a DSC analysis, as previously described. In the case of protease-treated IAT, the baseline was obtained with each protease solution.
Statistical analysis
Statistical analyses were performed using Microsoft EXCEL 2010. A one-way analysis of variance (anova) with a 5% (P < 0.05) level of significance was used to analyze the effect of the marbling grade on the proximate composition, FA composition, MP and EP of IAT. Multiple correlation coefficients among MP, EP and monounsaturated fatty acids (MUFA) were also calculated.
Results and Discussion
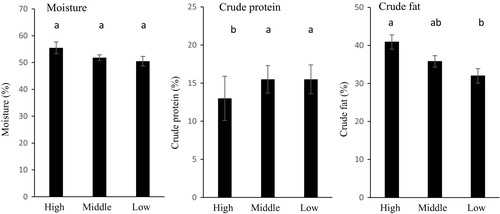
The effect of the marbling grade on the moisture, CP and crude fat of wagyu beef is shown in Figure 2. There was no significant difference in the moisture content among the three groups. However, the CP content in the high BMS group was significantly lower than those in the middle and low BMS groups. On the other hand, the crude fat content in the high BMS group was higher than that in the low BMS group. It was previously reported that protein content tended to decrease with an increased beef marbling grade (Hunt et al. 2014; Acheson et al. 2015; Jung et al. 2016). Our results are in good agreement with these reports.
The effect of the marbling grade on the FA composition of IAT is shown in Table 2. Two saturated FAs, C14:0 and C16:0 in the low BMS group were lower than those in the middle and high BMS groups. On the other hand, polyunsaturated FA (PUFA), C18:2 in the low BMS group was higher than those in the other groups. However, there was no significant difference in the MUFA among the three groups.
| Proportion of the total fatty acids (%) | |||
|---|---|---|---|
| High BMS | Middle BMS | Low BMS | |
| C14:0 | 2.77a | 2.88b | 2.38c |
| C14:1 | 1.11 | 1.04 | 0.89 |
| C16:0 | 27.45a | 26.79a | 25.56b |
| C16:1 | 3.91 | 3.88 | 3.69 |
| C18:0 | 10.37 | 11.15 | 11.25 |
| C18:1 | 51.89 | 51.55 | 53.15 |
| C18:2 | 2.50b | 2.71b | 3.07a |
| ΣSFA | 40.59 | 40.82 | 39.2 |
| ΣMUFA | 56.91 | 56.47 | 57.73 |
| ΣPUFA | 2.50b | 2.71b | 3.07a |
- The fatty acid composition of beef samples was expressed as the proportion of each fatty acid to the total fatty acids. BMS, beef marbling score; ΣSFA, total saturated fatty acids; ΣMUFA, total monounsaturated fatty acids; ΣPUFA total polyunsaturated fatty acids. High, Middle and Low are referred to in Table 1. Mean values with different letters are significantly different (P < 0.05).
It was reported that marbling characteristics were dependent on FA composition (Wood et al. 2003; Scollan et al. 2006). Different MPs of FAs can cause a variation in the firmness or appearance of IAT, and therefore in the marbling score (Wood et al. 2003; Tume 2004). The major saturated FAs were palmitic (C16:0) and stearic (C18:0) acids, in agreement with the report of Daley et al. (2010). Oleic acid was the most abundant FA within the IAT, consistent with previous studies (Tume 2004; Lopez-Huertas 2010). However, in this study we could not show that the degree of MUFA content was consistent with the beef marbling grade.
The effect of the marbling grade on the MP and EP is shown in Figure 3. There was no significant difference in the MP among the three groups. Moreover, the same tendency was shown in EP. However, it is clear from Figure 4 that the MP was significantly lower than the EP (P < 0.05). Intracellular adipose tissue dominates in white adipose tissue (Taga et al. 2011), which has adipocytes containing triglycerides and a collagenous background (Rezaee & Dashty 2013). These reports suggested that the difference between MP and EP would be due to the effect of the non-fatty constituent of IAT in this study.
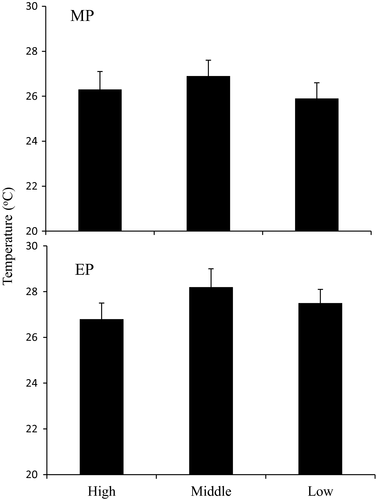
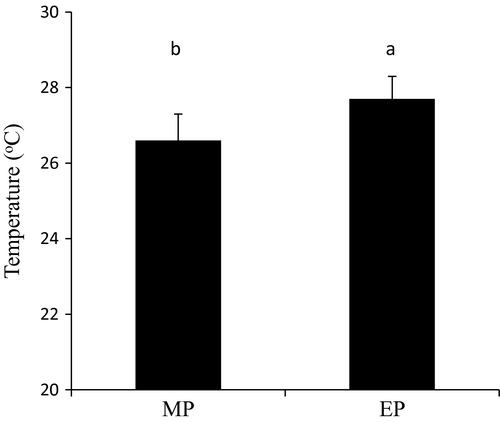
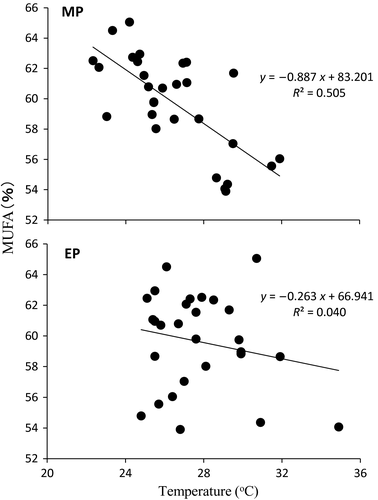
Figure 5 shows that the relationship between the MUFA content and the MP or EP. The MP has a relatively high correlation with the MUFA content in IAT (R2 = 0.505). On the other hand, there was no correlation between the MUFA content and the EP (R2 = 0.040). A high MUFA concentration and lower MP in adipose tissue contributes to a desirable beef flavor (Yang et al. 1999; Lee et al. 2011), while a higher PUFA and MUFA in adipose tissue contribute to a lower fat MP (Smith et al. 1998; Pitchford et al. 2002; De Smet et al. 2004; Daley et al. 2010; Uemoto et al. 2010). These reports strongly support the MP measured using the slip point method that would be reflected in the MUFA content in IAT. Further, there was no correlation between the EP measured by the DSC method and the MUFA content in IAT. It was reported that DSC could observe the presence of buffalo body fat in cow and buffalo ghee (Lambelet & Ganguli 1983). When a heated IAT was used in the DSC analysis, the area of the EP was lower compared with that of intact IAT (data were not shown). These finding also show that the thermal property of IAT using DSC would be affected by the effect of other IAT constituents, except the fat.
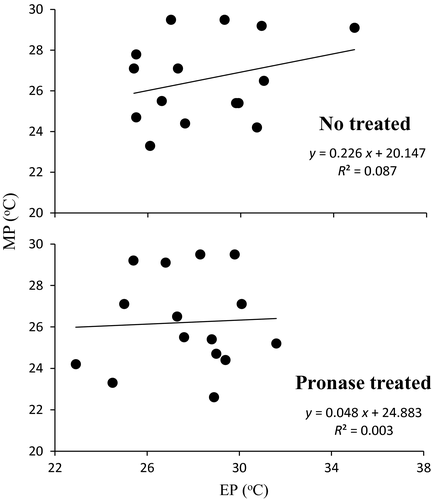
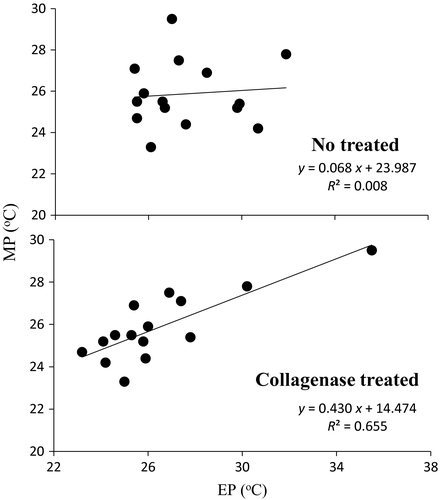
Thus, pronase-treated IAT was subjected to a DSC analysis and comparisons between the EP and the MP were investigated. As shown in Figure 6, there was no relationship between the MP and EP with or without a pronase treatment. Figure 7 shows the comparison between the MP and the EP of collagenase-treated IAT. A collagenase treatment increased the multiple correlation coefficient between the EP and MP (R2 = 0.655). It is generally known that denaturation temperature of collagen is about 62°C (Hellauer & Winkler 1975). On the other hand, it is reported that melting transition parameters of intact collagen significantly decrease by collagenase treatment as shown by gelatinization of collagenase treatment at 25°C (Bernal & Stanley 1986). In this study, there is a high correlation between the MP and the EP of collagenase-treated IAT, suggesting that the hydrolyzed collagen would have a lower thermal transition temperature than fat in IAT.
Our study showed a possibility that the DSC analysis could be used as a new method for assessment of thermal transition of the whole IAT consisting of fat, cytoplasm, ECM and so on.
Sasaki et al. (2006) indicated that the differences in the DSC curve between tissue-level and extracted fat from pork may be caused by a component other than the fat-soluble fraction in adipose tissues, such as water, ECM molecules, and other water-soluble substances. Nishimura (2010) pointed out that the development of adipose tissues in marbled meat would disrupt the structure of the IAT and remodel the ECM. Judging from this idea, it is supposed that the thermal properties of IAT would be altered by collagenase treatment. This report supports the hypothesis that DSC could be a new method to evaluate the thermal properties of IAT practically rather than the slip point method.
The presence of connective tissue, primarily in the form of collagen fibrils and the degree of intermolecular cross-linking, contributes to the background toughness of meat (Duarte et al. 2011). Beef palatability is known to be influenced by collagen and the amount of connective tissue (Purslow 2014). We demonstrated that DSC was a curious analytical technique to evaluate the thermal properties of marbled beef with the objective of the actual texture of beef based on the combination of fats and other constituents in IAT. In this study, it was suggested that DSC analysis would give us actual thermal information regarding the melt-in the-mouth nature of beef, such as the gelatinization of collagen, along with the melting of fat in IAT. We should further study the thermal properties of IAT using DSC by increasing the number of beef samples.
Acknowledgments
We express our deep gratitude to Mr. Masayuki Yokota, department chief at Ibaraki Chuo Meat Center Co. Ltd., for supplying the beef samples we requested.


