Changes in estrogen receptor expression in the chick thymus during late embryonic development
Abstract
In chickens, although estrogen receptors (ER) are reported to be associated with the immunological processes, detailed information about the differences in ER expression in the tissues related to the development of lymphocytes is not fully known, especially during the developmental stage. To learn more about this immunological relationship, we used semi-quantitative polymerase chain reaction method to detect the ER expression levels in the thymus tissues of chicks during the developmental stage. Furthermore, ER-expressing cells were detected by immunohistochemistry. The results of this study show that the expression level of ER increased on embryonic day 16 and decreased on day 20. Furthermore, ER expression was significantly higher in male than in female chickens at day 16. The increased expression on day 16 and decreased level on day 20 were also reproduced in the incidence of immunoreactive cells, although there was a 1-day delay in the elevated incidence of the cells. This study revealed the changes in ER expression and the incidence of ER-positive cells in the thymus of chickens during the developmental stage.
Introduction
Estrogen is known to have central effects on various immune functions. It has been reported to be associated with the humoral and cellular immune responses (Grossma 1985; Ahmed & Talal 1990; Olsen & Kovacs 1996) and is involved in the regulation of natural killer cell activity, T-cell development, and thymic atrophy (Dougherty 1952; Luster et al. 1984; Screpanti et al. 1989). Two kinds of estrogen receptors (ERα and ERβ) have been reported (Mosselman et al. 1996; Kuiper et al. 1997). An important finding to indicate the significance of ERs in the immune system is that the thymus is unable to fully develop in ER knockout mice (Staples et al. 1999). ER knockout mice showed a reduction in the thymic medullary area and a lower incidence of CD4+ and CD4+ CD8+ T-cells. These data indicate that ERs are functional in the postnatal stage of development, but their significance during the embryonic stage is unclear. Owing to its quite limited tissue volume in the embryo, the functional analysis of the thymus is not easy, especially in mice.
To overcome this issue, chicks are frequently used to study the function of the thymus during the embryonic stage. The size of the immunological organs in chicks is large enough to carry out functional analyses. The ER has been reported to be expressed in various types of organs in chicks, including the thymus (Shin et al. 2005; Yonezawa et al. 2008); ERα expression was detected, whereas ERβ expression was found to be negative. Furthermore, the relationships between ER and immunological properties have been studied in chicks. In brief, estrogen treatment on the fourth day of embryogenesis affected the thymic weight, the CD4+ T-cell ratio in the thymus, and antibody production post-hatching (Kondo et al. 2004). As a consistent result to support the effect of estrogen on the chick immune function, estrogen treatment on the third day of embryogenesis impaired antibody formation post-hatching (Verheul et al. 1986). In the chick embryo, expression of the ER was detected in various organs (Shin et al. 2005). In the chick thymus, the expression of ERα was detected, but there was no expression in the case of ERβ (Yonezawa et al. 2008). Furthermore, the detailed distribution of ER in the chick thymus has already been reported (Katayama et al. 2012). We hypothesized that in the embryonic stage of the chick, there is a possibility that the expression level of ERα messenger RNA (mRNA) might change dramatically in the thymus tissue. As supportive evidence of this notion, the ER-positive cell number was largely affected by the developmental stages in the bursa of Fabricius (BF), which is a B-lymphocyte development organ (Shin et al. 2008).
The purpose of this study was to detect changes in the expression of ER in chick embryos at a late stage of embryogenesis (from the 14th to the 21st days of the embryonic stage) and 1 week and 2 weeks post-hatching, by analyzing the ERα mRNA expression by RT-PCR and ER-positive cell numbers by immunohistochemical staining.
Materials and Methods
Animals
Fertilized White Leghorn Shaver eggs were purchased from a local chicken farm (Akebono Farm, Fukuyama, Japan). A summary of the sampling schedule is shown in Figure 1A. The fertilized eggs were incubated at 38°C, under humidified conditions. The liver tissue was collected on the 14th to 21st days of the embryonic stage and at 1 week and 2 weeks post-hatching for the PCR diagnosis of the gender (Fig. 1B). Similarly, the thymus was collected from the 14th to 21st embryonic days and at 1 week and 2 weeks post-hatching for RT-PCR and immunohistochemistry (n = 4). Owing to their limited amount, the thymus was extracted at the embryonic age of 14 and 15 days for the RT-PCR analysis. Animal care and experimental conduct were carried out in accordance with the guidelines for animal experiments of Okayama University Advanced Science Research Center, Okayama, Japan.
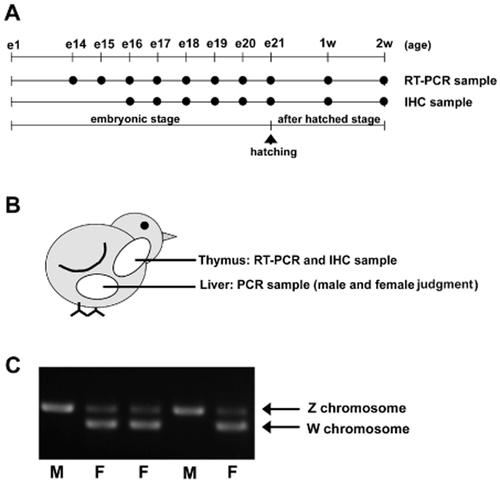
Summary of the experimental design. (A) Summary of the time frame for the tissue sampling. e1 to e21 indicate the first to 21st days of the embryonic stage of the chick. 1w and 2w indicate 1 week and 2 weeks post-hatching. IHC: immunohistochemistry stain. (B) Summary of the sampling method. The thymus tissue was divided into two pieces and used for RNA extraction for RT-PCR and IHC staining. The liver sample was used for genomic DNA extraction, which was used for analysis of the gender. (C) Results of the gender analysis. M: male; F: female. The position of the PCR products from the Z and W chromosomes are indicated by the arrows.
Diagnosis of gender
For diagnosis of gender, a sex-chromosome-specific PCR was used. The PCR was performed in a 20-μL reaction volume containing 1.0 ng of complementary DNA (cDNA), 1 × Taq buffer, 0.125 mmol/L deoxynucleotide triphosphate (dNTP), 1.0 μL of each primer, and 0.25 U of Taq DNA polymerase (TaKaRa Bio, Otsu, Shiga, Japan). Each primer (forward: 5′-GTTACTGATTCGTCTACGAGA-3′ and reverse: 5′-ATTGAAATGATCCAGTGCTTG-3′) was designed based on the sequence of the chicken ZW chromosome cDNA (Fridolfsson & Ellegren 1999). The cycling reaction was carried out as follows: 30 s of denaturation at 95°C, 30 s of annealing at 50°C, and 30 s of extension at 72°C, for 40 cycles. The PCR products were separated by 1.2% agarose gel electrophoresis (Cambrex Bio Science Rockland, Rockland, ME, USA) and visualized by staining with ethidium bromide. Chromosomes hemizygous for ZW were diagnosed as female, and those homozygous for ZZ were diagnosed as male (Fig. 1C).
Total RNA extraction, deoxyribonuclease (DNase) treatment and reverse-transcription cDNA synthesis
One hundred milligrams of the thymus were treated with 1 mL of Trizol (Invitrogen, Carlsbad, CA, USA). To eliminate the DNA contamination in the extracted total RNA, the samples were treated with 1 × DNase buffer and 10 U of DNase I (TaKaRa, Osaka, Japan) for 30 min at 38°C.
One microgram of total RNAs was reverse-transcribed into cDNA in the presence of 25 ng/μL of oligo(dT)12–18 (Invitrogen), 1 × RT buffer (20 mmol/L Tris-HCl, pH 8.4, 50 mmol KCl), 1.25 mmol/L MgCl2, 0.5 mmol/L DTT, 0.5 mmol/L of each dNTP (Invitrogen), 40 U of RNase inhibitor (RNase OUT; Invitrogen), and 50 U of SuperScript II RNase (ribonuclease) H Reverse Transcriptase (Invitrogen), in a 20-μL reaction volume. cDNAs were synthesized at 42°C for 50 min with SuperScript II.
Semi-quantitative PCR analysis for ER gene expression
PCR was carried out in a 20-μL reaction volume containing 1.0 ng of cDNA, 1 × PCR buffer, 0.125 mmol/L dNTPs, 1.0 μmol/L each primer, and 0.25 U of Taq DNA polymerase (TaKaRa). The forward primer 5′-CGTGGAAAGCAACAAGACA-3′ and the reverse primer 5′-AAGCCTCCCCGTTCCTGG-3′ were used for amplification of the ERα cDNA with the cycling conditions of 30 s of denaturation at 94°C, 30 s of annealing at 62°C, and 60 s of extension at 72°C, for 33 cycles (Mendze et al. 1999). For the amplification of the β-actin fragment, a forward primer (5′-GATATGGAGAAGATCTGGCACC-3′) and a reverse primer (5′-TGAAGGTCTCAAACATGATCTG-3′) were used with the cycling conditions of 30 s of denaturation at 94°C, 30 s of annealing at 60°C, and 60 s of extension at 72°C, for 20 cycles (Brenard et al. 1999). All PCR amplifications were carried out using a PCR cycler (Icycler; Bio-Rad, Hercules, CA, USA). The PCR products were separated on a 1.2% agarose gel (Cambrex Bio Science Rockland, Rockland, ME, USA) and detected by ethidium bromide staining. The band intensity of the β-actin gene was used as a control to measure the amount of mRNA in the amplification samples. The band intensity after the PCR amplification was measured from the gel photograph, using the Image J software (National Institutes of Health, Bethesda, MD, USA). Based on the intensity of the β-actin band, the relative expression level of ERα was determined.
Determination of exponential amplification phase in semi-quantitative PCR
For the quantitation of gene expression, we need to detect the gene expression under the exponential amplification phase of PCR reaction. To address the number of cycles under the exponential phase, the amount of ERα amplification product was detected at 30, 33, and 35 PCR cycles. We confirmed that ERα PCR product showed the exponential amplification from 30 to 35 cycles, and the product did not reach a plateau (Fig. 2A). Therefore, we concluded that detection at 33 cycles is the best condition for a semi-quantitative PCR cycle of ERα. We also detected the amplification of β-actin. As the results show in Figure 2B, we detected that the PCR product of β-actin shows exponential amplification from 15 to 25 cycles, and the β-actin PCR product does not reach to the plateau. Based on this evidence, we concluded that 20 cycles is the best point for the semi-quantitative PCR of β-actin. In this study, we used ERα and β-actin primers, which are synthesized by Sigma-geosys (Sigma geosys, St. Louis, MO, USA). Calculated melting temperature ™ values are 62.52 (ERα – Forward), 68.62 (ERα – Reverse), 63.56 (β-actin – Forward), 61.66 (β-actin – Reverse) (http://www.sigma-genosys.com/calc/DNACalc.asp). The Tm value was provided from the manufacturer with the Nearest Neighbor method. Furthermore, we previously reported the semi-quantitation of ERα and β-actin in our previous study (Shin et al. 2008). From the Tm value and previous experimental conditions, we carried out the experiments with annealing temperatures of 62°C (ERα) and 60°C (β-actin).
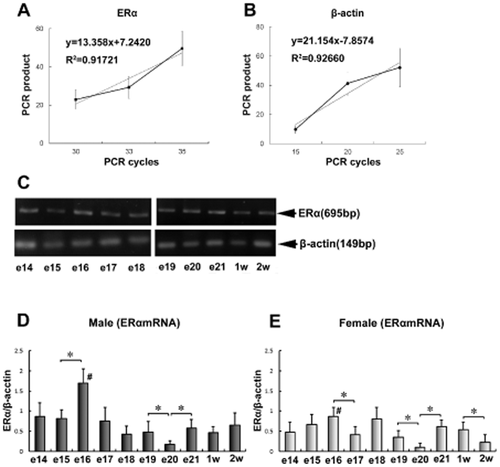
Quantitative detection of ERα messenger RNA (mRNA) in the chick thymus. (A) The amplification of ERα PCR product from 30 to 35 cycles. (B) The amplification of β-actin PCR product from 15 to 25 cycles. (C) The results of RT-PCR of ERα and β-actin in the chick embryonic thymus (14th to 21st embryonic days) and 1 week and 2 weeks post-hatching. ERα is 695 bp and β-actin is 149 bp. (D) Quantification of ERα expression in the embryonic thymus of male chicks. (E) Quantification of ERα expression in the embryonic thymus of female chicks. *Significant differences among the developmental ages (P < 0.05). #Significant difference between male and female chicks (P < 0.05). e14 to e21: 14th to 21st days of embryogenesis; 1w and 2w: 1 week and 2 weeks post-hatching. (n = 4).
Immunohistochemistry
The thymus were embedded in Optimal Cutting Temperature compound (Sakura Finetek Japan, Tokyo, Japan), and the embedded tissues were frozen in liquid nitrogen and stored at −80°C until use. Five-micrometer cryosections prepared using a cryostat were air dried for 1 h at room temperature and fixed with acetone for 15 min at 4°C. The sections were treated with the anti-human ER mouse monoclonal antibody (ER Ab-10; Thermo Fisher Scientific, Waltham, MA, USA), which is reported to show cross-reactivity with the chicken ER (Abbondanza et al. 1993). The antibody-treated sections were visualized with 3,3-diaminobenzidine tetrahydrochloride solution (Sigma Chemical, St. Louis, MO, USA) for 10 min at room temperature. Then, the sections were lightly counterstained with methyl green. The number of positively stained cells per square-millimeter of cortex lymphocyte, cortical non-lymphoid cell, medullary lymphocyte, medullary non-lymphoid cell and Hassall's corpuscle, were counted based on the difference in stainability among these cells (Katayama et al. 2012). ER-positive cells were counted using the ImageJ software after capture with a digital camera.
Statistical analysis
The statistical differences during the embryonic stage were analyzed with one-way analysis of variance. Statistical differences between male and female birds were analyzed with the Student's t-test. Differences were considered to be significant at the 5% level.
Results
ERα mRNA expression levels in the thymus
Figure 2C shows the electrophoretic patterns of the RT-PCR-amplified β-actin and ERα cDNA fragments derived from the chick embryonic thymus on the 14th to 21st embryonic days and at 1 week and 2 weeks post-hatching. Based on the semi-quantitative amplification, the expression level of ERα was determined in male (Fig. 2D) and female chicks (Fig. 2E) from the 14th embryonic day to 2 weeks post-hatching.
In male chicks, ERα expression at the 16th embryonic day was significantly higher than that at the 15th day; the expression level at the 20th embryonic day was significantly lower than that at days 19 and 21 (Fig. 2D). In female chicks, ERα expression at the 16th embryonic day was significantly higher than that at the 17th day; the expression level at the 20th day was significantly lower than that at days 19 and 20, and the expression level at the second week post-hatching was significantly lower than that at the first week post-hatching (Fig. 2E).
The increase in ERα mRNA expression observed in male chicks at the 16th day of embryogenesis was higher than that in female chicks (Fig. 2D,E). From these results, we concluded that the expression level of ERα in the thymus changes dramatically in the late developmental stage of the chick embryo and that there is a significant difference in the ERα expression level between male and female chicks at a specific stage of embryo development.
Histological detection of ER-expressing cells in the thymus
To confirm the dynamic change of the ERα expression during chick thymus development, we observed the ERα-expressing cells by immunohistochemistry. The results of the histological detection are shown in Figure 3. Figure 3A and B show the low-magnification images, and Figure 3C and D are the high-magnification images of the cortex and medulla, respectively. We could not detect any gender- or age-related differences from all the microscopy results. In the thymic cortex, ER staining was observed in two types of cells: lymphocyte and large cells of unspecified cells (non-lymphoid cells) (Fig. 3C). In the medulla, three types of ER-stained cells were observed: lymphocytes, large cells (non-lymphoid cells), and Hassall's corpuscles, which are constituted by reticular epithelial cells (Fig. 3D). The unspecified cell (non-lymphoid cell) was detected both in the cortex and medulla of the thymus. This unspecified cell showed a diffuse pattern of ER staining and intense ER staining on the cell membrane, while spot-like staining patterns were observed in the lymphocytes. These results of staining, including intra-cellar localization, are consistent with that of our previous report (Katayama et al. 2012). Our previous report showed that unspecified (non-lymphoid) cells in the cortex and medulla were negative for keratin antibody, indicating that unspecified (non-lymphoid) cells are of non-epithelial cell origin. For a detailed evaluation of the histological examination, the number of positively stained cells per square-centimeter in the thymus of male and female chicks were determined (Figs 4, 5).
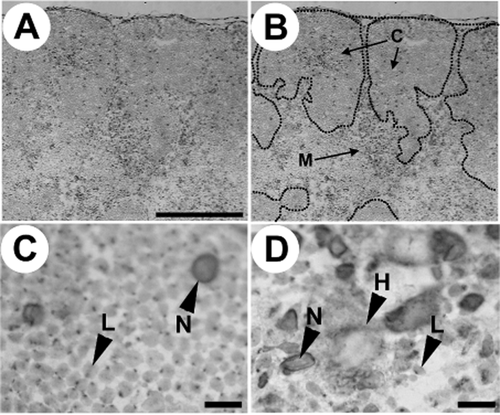
Immunohistochemical staining of estrogen receptors (ER) in the thymus during the developmental stage of the chick. (A) Low magnification of ER-positive cells in the chick embryonic thymus. The bar represents 250 μm. (B) Low magnification of ER-positive cells in the chick embryonic thymus (borderline of intrathymic area shown by dotted line). C: cortex; M: medulla. (C) High magnification of ER-positive cells in the chick thymus. The bar represents 10 μm. L: ER-positive lymphocyte; N: ER-positive non-lymphoid cell. (D) High magnification of ER-positive cells in the chick medulla. The bar represents 10 μm. L: ER-positive lymphocyte; N: ER-positive non-lymphoid cell; H: ER-positive Hassall's corpuscle. Counterstaining was carried out with methyl green.
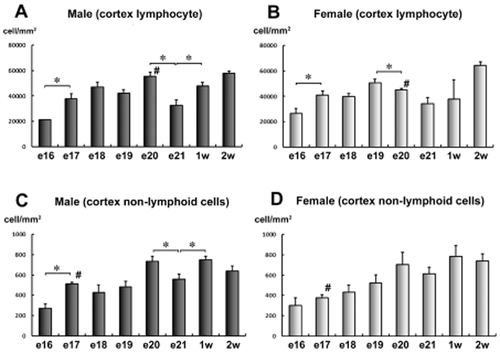
Incidence of positively stained cells for the estrogen receptors (ER) in the chick thymic cortex. (A) Incidence of positively stained cells in the thymic cortex (lymphocyte) of male chicks. (B) Incidence of positively stained cells in the thymic cortex (lymphocyte) of female chicks. (C) Incidence of positively stained cells in the thymic cortex (non-lymphoid cell) of male chicks. (D) Incidence of positively stained cells in the thymic cortex (non-lymphoid cell) of female chicks. *Significant difference among continuous ages (P < 0.05). #Significant difference between male and female chicks (P < 0.05). The diagnosis of the lymphocyte or non-lymphoid cell was determined from its morphology. (n = 4).
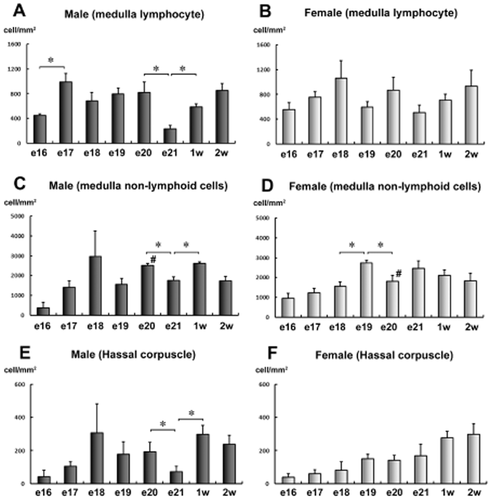
Incidence of positively stained cells for the estrogen receptors (ER) in the chick thymic medulla. (A) Incidence of positively stained cells in the thymic medulla (lymphocyte) of male chicks. (B) Incidence of positively stained cells in the thymic medulla (lymphocyte) of female chicks. (C) Incidence of positively stained cells in the thymic medulla (non-lymphoid cell) of male chicks. (D) Incidence of positively stained cells in the thymic medulla (non-lymphoid cell) of female chicks. (E) Incidence of positively stained cells in the thymic medulla (Hassall's corpuscle) of male chicks. (F) Incidence of positively stained cells in the thymic medulla (Hassall's corpuscle) of female chicks. *Significant difference among continuous ages (P < 0.05). #: Significant difference between male and female chicks (P < 0.05). The diagnosis of the lymphocyte or non-lymphoid cell was determined from its morphology. (n = 4).
The number of positively stained cells in the cortex of the thymus changes during chick development
In male chicks, the number of ER-positive lymphocytes in the cortex (per mm2) was significantly higher at the 17th embryonic day than that at the 16th day (Fig. 4A). Furthermore, the number of positively stained cells at embryonic day 21 showed significantly lower levels than those observed at embryonic day 20 and 1 week post-hatching (Fig. 4A). In female chicks, the number of positively stained lymphocytes in the cortex at the 17th day of embryogenesis was significantly higher than that at day 16. The level at day 20 was significantly lower than that at day 19 (Fig. 4B). The number of positive lymphocytes in male chicks was significantly higher than that in female chicks at day 20. There were no significant gender-related differences observed at days 16 and 17 (Fig. 4A,B).
In male chicks, the number of positive non-lymphoid cells in the cortex at day 17 was significantly higher than that at day 16. Furthermore, the positive cell number at day 21 significantly reduced compared with that at embryonic day 20 and 1 week post-hatching, which was completely consistent with the results from the cortex lymphocytes (Fig. 4A). In female chicks, no significant change in the number of positively stained non-lymphoid cells of the cortex was observed during the developmental stage (Fig. 4D). The number of positive non-lymphoid cells in the cortex of male chicks was significantly higher than that in the female chicks at day 17 (Fig. 4C,D).
The number of positively stained cells in the medulla of the thymus changes during development
The results of the ERα-positive cells in the medulla are summarized in Figure 5. In the medulla of male chicks, the number of ER-positive lymphocytes at day 17 was significantly higher than that at day 16; whereas at day 21, the number of cells was significantly lower than that at embryonic day 20 and 1 week post-hatching (Fig. 5A). The same developmental changes were observed in the medullary non-lymphoid cells (Fig. 5C) and Hassall's corpuscle of the male chicks (Fig. 5E).
In female chicks, no significant differences were observed in the number of positively stained medullary lymphocytes (Fig. 5B). The number of positively stained medullary non-lymphoid cells was significantly higher at day 19 than that at days 18 and 20. However, this difference was not observed in the Hassall's corpuscle of the female chicks (Fig. 5F).
Discussion
In this study, we detected the changes in ER expression in the male and female thymus during the late developmental stage of chick embryos and in the early post-hatching stage. In chick embryos, the thymic primordial appears at the fourth day of embryogenesis and starts to develop from the fifth day onward. Subsequently, the entry of the pre-T-lymphocyte into the thymus, which is one of the hematopoietic pluripotent cells, occurs at two points in the developmental stage, namely, day 6.5 and day 12 of embryogenesis (Eerola et al. 1987). Based on this previous observation, intensive T-cell differentiation is on-going in the thymus tissue from the 14th embryonic day. It is an interesting postulation that changes in the expression of ER in the thymus at the late stage of embryogenesis are related to the development of the thymus tissue and, consequentially, T-cell differentiation.
The concentration of estrogen in the embryonic tissue is largely influenced by the estrogen level in the maternal tissue in mammals. However, the development of the avian embryo progresses within the egg shell, which is completely independent from the maternal tissue. Therefore, the concentration of embryonic estrogen is determined by the endocrine secretion from the embryo itself. In the chick embryo, estradiol is secreted from the testis and ovary (Woods & Erton 1978). The plasma estrogen concentration in the female chick embryo is relatively higher than that in the male chick embryo, and its plasma level increases in the late embryonic stage (Woods & Brazzill 1981). In this study, we observed that the expression of ER in the thymus in female chick embryos was not relatively higher than that in male chick embryos. Our results indicate that the ER expression level in the thymus is independently controlled from the plasma level of estrogen. Steroid hormone synthesis may be occurring in the BF during the late stage of embryogenesis, because mRNA expressions of steroidogenic enzymes have been demonstrated during this stage (Shin et al. 2012). Estrogen synthesis may occur in the thymus of chick embryos.
The results of this study showed that the ERα expression level in the male thymus increases at day 16 and decreases at day 20 of the embryonic stage (Fig. 2D). Interestingly, in male chicks, the incidence of the positively stained cortex lymphocytes (Fig. 4A) or non-lymphoid cells (Fig. 4C) and medullary lymphocytes (Fig. 5A,C) in the thymus was significantly high at day 17 and low at day 21. The increased incidence of the positively stained cells occurred with an approximately 1-day delay after the change of the ER expression level. In a previous report, there was also a 1-day delay in the incidence of ER positively stained cells compared with the ERα mRNA level in the BF, which also has an important role in avian immunological function as well as the thymus (Shin et al. 2008). Protein translation of the ER might require one additional day after the increased level of ER in these immunological tissues of the chick.
The mRNA level of the chick thymus was relatively high at day 16 of embryogenesis (Fig. 2D,E). In the embryonic thymus, T-cell receptor (TcR)αβ-positive T cells appear at day 14 and start entry into the medulla of the thymus at day 17 of development (Bucy et al. 1990). Therefore, the 16th day of the embryonic stage can be classified as being the active stage of T-cell differentiation. The high expression level of ER at the 16th day of the developmental stage detected in this study suggests the association of ER expression with T-cell differentiation. A previous study reported that ERα mRNA in the BF reached the highest level at the 15th day of the embryonic stage, which is a specific stage after entry of lymphocytes into the BF (Shin et al. 2008). There might be common underlying mechanisms in the high expression of ER in the BF and thymus during the developmental process of the lymphocytes.
Interestingly, the ER expression level at day 20 of the developmental stage was relatively lower than the observed level at the other days. The 20th day of the embryonic stage is fairly close to the hatching stage. It is unclear why the ER expression level decreased at the 20th day of development of the chick. However, previous studies have reported that the expression of the ER is largely influenced by various types of stress, including metabolic and oxidative stresses (Barbati et al. 2012; Muehlfelder et al. 2012; Wang et al. 2013). Further detailed study about hatching and ER expression would clarify the significance of our results. In this study, we observed positive staining of ER in the cortex lymphocyte, cortex non-lymphocyte cell, medullary lymphocyte, medullary non-lymphoid cell and Hassall's corpuscle. These results are consistent with our previous publication, indicating the high expression of ER in thymus tissue (Katayama et al. 2012). In brief, our previous publication reported on the detailed distribution of ER in the chick at 2 days post-hatching. The results of that study revealed that the distribution of ER is consistent from the late embryonic stage to the early egg of the chick post-hatching.
The previous study reported that administration of 17β-estradiol to the chick embryo affects the immunological function of the adult chick, based on the exposure memory during the developmental stage (Kondo et al. 2004). The elucidation of more details about the relationships among the ER, estradiol and immunological phenotype might allow us to control the immunological performance of the chick in the future, which would have a large impact on infection resistance.
Acknowledgment
We would like to thank the Laboratory of Applied Cell Biology (Department of Bioscience and Biotechnology, Okayama University, Japan) for help with the frozen tissue sections.


