Autophagy-related gene regulation in liver and muscle of rainbow trout (Oncorhynchus mykiss) upon exposure to chloroquine, deoxynivalenol and nutrient restriction
Jaramar Balmori-Cedeno, Phuc H. Pham and Liu Juan-Ting joint first authors.
Funding information
Nowlan, Ryerse and Balmori-Cedeno received Ontario Veterinary College Graduate Scholarships. Liu and Misk were supported by the Taiwanese and Egyptian governments, respectively. The research was funded by a Natural Sciences and Engineering Research Council of Canada (NSERC) Discovery Grant (Lumsden) and the Ontario Ministry of Agriculture, Food and Rural Affairs.
Abstract
Autophagy is important for maintaining homeostasis, nutrient availability and muscle mass in fish. The effect of chloroquine (CQ) and deoxynivalenol (DON) on autophagy-related gene (Atg) regulation was examined in rainbow trout fed with either CQ or DON and compared with pair-fed (nutrient restriction [NR]) and optimally-fed group. Rainbow trout were divided into four groups and, respectively, fed optimal diet (control), diet-containing CQ (6 mg/g), diet-containing DON (0.005 mg/g) or pair-fed the control diet. On days 0, 1, 3, 7, 14 and 21, liver and muscle were sampled to evaluate the expression of atg4, atg5, atg7, atg12, atg13, atg16, bec-1, gabarap and lc3. In both liver and muscle, CQ induced the highest number of Atgs, with eight in liver and seven in muscle; DON-induced six Atgs in liver and three in muscle; and pair-fed induced three Atgs in liver and two in muscle. In vitro, the effect of NR and CQ on Atg was examined in the RTL-W1 cell line. NR induced all Atg in RTL-W1, with the exception of bec-1. Furthermore, NR combined with CQ enhanced Atg expression greater than NR alone. Overall, CQ and DON can modulate Atg in rainbow trout, which can influence physiology and growth in aquaculture.
1 INTRODUCTION
The regulation of autophagy in fish tissues and cells is important for maintaining nutrient availability during prolonged periods of nutrient deficiency in fish that endure starvation, such as salmonids, in their natural lifecycle (migration and spawning) or in aquaculture (handling and transportation) (Miller et al., 2009). Autophagy (macroautophagy) degrades bulk intracellular constituents within autolysosomes to maintain homeostasis (Seino et al., 2013; Antonucci et al., 2015), regulate muscle mass and participate in immune response (Masiero et al., 2009; Kuballa et al., 2012; Lilienbaum, 2013). It can be upregulated by toxic chemicals (Pesonen and Vähäkangas, 2019), nutrient deprivation (Lee et al., 2014; Singh & Cuervo, 2011), muscle fibre hyperplasia (Tang and Rando, 2014) and in rainbow trout, dietary protein to lipid ratio (Overturf et al., 2016). The core mechanism of autophagy (autophagosome initiation and formation) is well characterized in yeast and other organisms, as a collection of 33 autophagy-related genes (Atgs) and proteins (Klionsky et al., 2003). In rainbow trout (Oncorhynchus mykiss), to date, the sequences of only 10 Atgs were identified (Balmori-Cedeño et al., 2019); these are primarily involved in autophagy initiation, the establishment of pre-autophagosomal structure, and extension and closure of autophagosome isolation membrane (Mizushima et al., 2011; Balmori-Cedeño et al., 2019).
During starvation, salmonids preferentially degrade protein, rather than carbohydrates and utilize amino acids as substrates for glucose production (Walton and Cowey, 1982). Protein degradation is accomplished by the ubiquitin-proteasome, calpain and autophagic-lysosome systems (Nemova et al., 2016); all of which function in salmonids (Cassidy et al., 2018). In muscle, nutrient deficiency leads to upregulation of Atgs (Seiliez et al., 2010), and autophagy is responsible for up to 50% of total protein degradation (Seiliez et al., 2014). In liver, during starvation, hepatic protein synthesis and total protein are greatly reduced, and protein degradation increases (Mommsen et al., 1980; Peragón et al., 1999), releasing amino acid precursors for gluconeogenesis in salmonids (Seiliez et al., 2016).
Chloroquine suppresses autophagosome-lysosome fusion by entering the acidic vesicle, becoming protonated and entrapped, thereby raising vesicular pH (Wibo and Poole, 1974; Steinman et al., 1983) and preventing the degradation and recycling of autophagosomal contents. In fish, CQ has been studied as a potential suppressor of parasites (Ichthyobodo necator and Gyrodactylus sp.) (Tojo and Santamarina 1998a, b) and viruses [viral haemorrhagic septicaemia virus (VHSV) and infectious salmon anaemia virus (ISAV)] (Dannevig et al., 1995; Eliassen et al., 2000; Liu, Pham, et al., 2020; Liu and Lumsden, 2021). CQ was also used as an autophagy suppressor to study metabolism in Nile tilapia (Oreochromis niloticus) (Han et al., 2019) and fasting-induced cold resistance in zebrafish (Danio rerio) (Lu et al., 2019). Paradoxically, although an autophagy inhibitor, CQ can upregulate many Atg transcripts in rainbow trout cells in vitro (Liu, Balmori-Cedeno, et al., 2020).
Deoxynivalenol (DON) is a trichothecene mycotoxin synthesized by Fusarium sp. with known toxicity in mammals (Sobrova et al., 2010). Fish are exposed via feeding on wheat and corn contaminated with DON, which persists after feed processing (Pietsch et al., 2013; Nácher-Mestre et al., 2015; Greco et al., 2015; Pietsch, 2020). DON toxicity has been demonstrated in many fish species (Matejova et al., 2014; Moldal et al., 2018; Bernhoft et al., 2018; Khezri et al., 2018; Huang et al., 2020), and among them, rainbow trout are extremely sensitive (Hooft et al., 2019). Despite its toxicity, DON ingestion appears to provide some protection to fish against infection by Flavobacterium psychrophilum (Ryerse et al., 2015, 2016). DON-induced reduction in feeding, and consequent upregulation of autophagy in fish, is a potential mechanism for defence against bacterial diseases (MacPhee et al., 1995; Damsgård et al., 2004; Wise et al., 2008; Gomes and Dikic, 2014). Little is known about the effect of DON on autophagy regulation in fish, and to date, only one in vitro study using the rainbow trout cell line, RTgill-W1, has shown downregulation of Atg transcripts by DON (Liu, Balmori-Cedeno, et al., 2020). More research is needed to determine whether a similar effect is observed in vivo in rainbow trout.
The purpose of the present study was therefore to examine the expression of a suite of Atgs in vivo in rainbow trout liver and muscle undergoing feed restriction and exposure to DON and CQ. Additionally, autophagy regulation was examined in the rainbow trout liver cell line, RTL-W1, undergoing nutrient restriction and exposure to CQ. This study demonstrates the concordance of upregulation of many Atgs belonging to the same functional pathway and provides evidence for autophagy modulation by DON and CQ in vivo, with additional evidence for CQ activity in vitro.
2 MATERIALS AND METHODS
2.1 Fish trials
Rainbow trout fingerlings from Lyndon Fish Hatcheries were housed at the University of Guelph Hagen Aqualab in flow-through well water at 12°C. Fish had an initial average weight of 7.5 g and were treated with 1:10,000 v/v buffered formaldehyde for 1 h upon arrival. Fish (480 in total) were haphazardly assigned to twelve 125 L tanks, with 40 fish per tank. Trout were fed with commercial trout feed (Profishent, Martin Mills Inc, Elmira, Ontario, Canada) at 2% of biomass once per day for a one-week period of acclimation (control diet: protein 42%, fat 12%, fibre 2%, calcium 0.9%, phosphorus 0.9%). Once fish were screened (bacteriological and histological studies) and deemed healthy, triplicate tanks were haphazardly assigned one of four treatment groups: 1) control diet, 2) diet-containing CQ (6 mg/g), 3) diet-containing DON (0.005 mg/g) and 4) pair-fed diet. Feeds were prepared by mixing thoroughly with ultrapure water or water-containing CQ and DON sprayed over the feed slowly, dried and stored at -20°C until use. The groups were fed twice daily at 09:00 and 17:00 h during weekdays and once on weekends for 21 days. Feed intake and trout behaviour were recorded daily. During feeding periods, the control, CQ and DON groups were fed slowly by hand until satiation, and the lowest amount of feed consumed was determined and that amount was used to feed the pair-fed group. Therefore, this group was fed an amount equal to the least consumed by any group of fish on a given day. On days 0, 1, 3, 7, 14 and 21, six fish per treatment were removed for collection of tissue samples. Fish were euthanized with an overdose of benzocaine (Sigma-Aldrich Inc), and muscle and liver samples were collected and stored in RNAlater (40 ml 0.5 M EDTA, 25 ml 1 M sodium citrate, 700 g ammonium sulfate and 935 ml ultrapure water at 5.2 pH) at −80°C.
2.2 Cell culture
The rainbow trout liver cell line (RTL-W1) (Lee et al., 1993) was grown in L-15 medium (Hyclone, ThermoFisher) supplemented with 10% fetal bovine serum (FBS; Hyclone, ThermoFisher) and 1% penicillin–streptomycin (PS; Hyclone, ThermoFisher) (10% FBS/L-15). Cells were grown in T75 cm2 tissue culture treated flasks (Biolite, ThermoFisher) at 15°C. Subcultivation was done at a ratio of 1:2 or 1:3 every 2 weeks to 1 month.
2.3 Treatment of RTL-W1 with different nutritional levels and with chloroquine
For experiments evaluating only nutrient restriction, the two nutrient conditions used were L-15/ex and 10% FBS/L-15. L-15/ex medium is a nutrient-restricted modification of L-15 medium and contains only the salts, galactose and pyruvate of L-15 medium (Schirmer et al., 1997). Confluent RTL-W1 monolayers in 6-well plates were washed twice with DPBS, followed by the addition of 2 ml of either L-15/ex or 10% FBS/L-15. On days 1, 3 and 6, cells were collected for RNA extraction followed by RT-qPCR. Triplicate biological replicate wells were used per nutrient condition for each experiment and two independent experiments were performed.
For experiments evaluating the potential cytotoxic effects of CQ (chloroquine diphosphate, Sigma-Aldrich) in vitro, confluent RTL-W1 in 48-well plates was treated with the following conditions: 1) 10% FBS/L-15, 2) 10% FBS/L-15 with either 50 μM or 100 μM CQ, 3) L-15/ex or 4) L-15/ex with 50 μM or 100 μM CQ. Each well contained a total volume of 500 μl of each nutrient treatment. On days 0, 1 and 3, cell viability and metabolic activity were measured using the alamarBlue assay. Briefly, cells were washed then 500 μl of alamarBlue (5% diluted in L-15/ex) (Invitrogen, ThermoFisher) was added to each well. The plates were incubated at room temperature in the dark for 1 h. After 1 h, relative fluorescent units (RFU) were measured using the EnSpire Multimode Plate Reader (PerkinElmer) at the excitation wavelength of 530 nm and emission wavelength of 590 nm. The background RFU of the 5% alamarBlue solution was subtracted from the RFU of experimental wells. To calculate the percent metabolic activity, the RFU of days 1 and 3 were divided by the RFU of day 0 pre-treated cells. Three independent experiments were performed, and each experiment contained 10 biological replicate wells for each condition.
For experiments evaluating the combined effect of nutrient restriction and CQ on autophagy gene expression, confluent RTL-W1 monolayers in 6-well plates were exposed to one of four treatments: 1) complete medium (10% FBS/L-15), 2) complete medium with 50 μM CQ, 3) nutrient-restricted medium (L-15/ex) and 4) nutrient-restricted medium with 50 μM CQ. At 1- and 3-day post-treatment (dpt), cells were collected for RNA extraction followed by RT-qPCR. Triplicate biological replicate wells were used per nutrient condition for each experiment and two independent experiments were performed.
2.4 RNA extraction and RT-qPCR
RNA was extracted from samples using the RNeasy Mini Kit (Qiagen) according to the manufacturer's protocol. RNA concentration was assessed using the Nanodrop Onec Spectrophotometer (ThermoFisher) and quality and purity were assessed by absorbance measurements of the 260/280 and 260/230 ratios. For fish tissue samples, 3.3 μg of extracted RNA was reverse transcribed to cDNA using the High-Capacity cDNA Reverse Transcription Kit (Applied Biosystems, ThermoFisher), and for cell line samples, 2 μg of extracted RNA was converted to cDNA. Reverse transcription was performed in a Techne thermal cycler (Cole-Parmer) with the following temperature conditions: 25°C for 10 min, 37°C for 120 min, 85°C for 5 min and final hold at 4°C. After reverse transcription, cDNA was diluted in water to 16.5 ng/μl (fish tissue samples) or 10 ng/μl (cell line samples) for qPCR.
2.5 Statistical analysis
For the fish trial, two-way analysis of variance (ANOVA) was used to evaluate the relative fold change expression differences of each gene between the four treatments, followed by Dunnett's multiple comparison tests. For the in vitro nutrient restriction experiment, a one-way analysis of variance (ANOVA) was used to evaluate relative fold change expression difference of each gene over time, followed by Dunnett's multiple comparison tests. For the in vitro nutrient restriction experiment with CQ, two-way analysis of variance (ANOVA) was used to evaluate relative fold change expression differences of each gene between the four treatments, followed by Dunnett's multiple comparison tests. All statistical analyses were performed in GraphPad Prism version 9.1, and a p-value of 0.05 or lower was considered significant.
3 RESULTS
3.1 CQ and DON altered autophagy gene expression in liver and muscle more than nutrient restriction alone
The expression of nine autophagy genes in rainbow trout liver and muscle was examined in fish fed with feed to satiation (control), fed with feed-containing CQ, fed with feed-containing DON and pair-fed. The genes were atg4, atg5, atg7, atg12, atg13, atg16, bec-1, gabarap and lc3 and gene expression is expressed below as fold change.
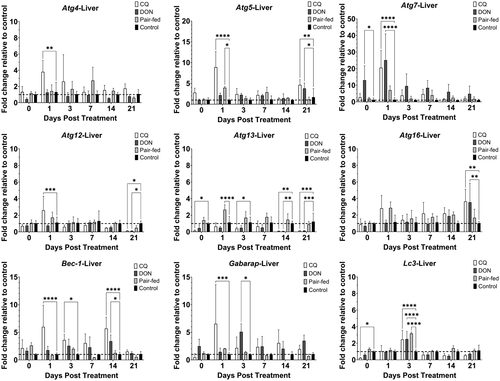
Treatment of rainbow trout with CQ resulted in modulation of Atgs in the liver over 21 dpt (Figure 1). The Atg that was upregulated at only one time point was atg4 (Day 1; 3.8-fold), atg7 (Day 1; 20.6), atg16 (Day 21; 3.7) and gabarap (Day 1; 6.5). Both Atg5 and bec-1 were upregulated at multiple time points: atg5 (Day 1; 8.9 and Day 21; 4.7) and bec-1 (Day 1; 6.0, Day 3; 3.6 and Day 14; 5.7). Atg12 and lc3 experienced both up- and downregulation; Atg12 expression was increased at 1 dpt (2.6) but decreased at 21 dpt (0.1), while lc3 was downregulated at 0 dpt (0.2) but upregulated at 3 dpt (2.5). Atg13, unlike the other Atgs, was not upregulated at any time point but was instead downregulated at multiple time points: 0 (0.1); 3 (0.4); 14 (0.1); and 21 (0.1) dpt. Overall, for the liver, there was significant upregulation of eight out of nine Atgs (atg4, atg5, atg7, atg12 atg16, bec-1, gabarap and lc3) for at least one time point over 21 dpt.
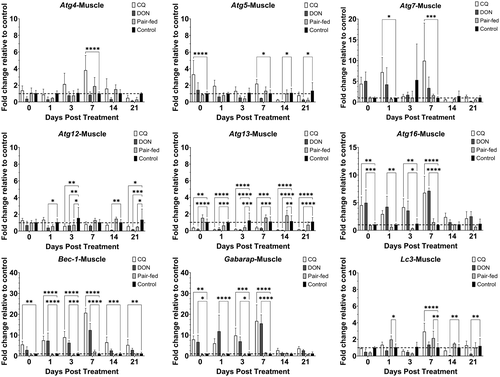
Treatment of rainbow trout with CQ resulted in modulation of Atgs in the muscle over 21 dpt (Figure 2). Atgs that were only upregulated at one time point were atg4 at 7 dpt (3.8) and lc3 at 7 dpt (2.9). Atg5, atg7, atg16, bec-1 and gabarap were upregulated at multiple time points. Atg5 was upregulated at 0 (3.3) and 7 dpt (2.2). Atg7 was upregulated at 1 (7.2) and 7 dpt (9.9). Atg16 was upregulated at 0 (4.5), 3 (4.2) and 7 dpt (6.8). Bec-1 was upregulated at all time points: 0 (5.5); 1 (7.5); 3 (9.0); 7 (20.7); 14 (6.5); and 21 dpt (5.3). Gabarap was upregulated at 0 (7.9), 3 (9.8) and 7 dpt (16.8). Atg12 and atg13 were not upregulated at any time point but were downregulated at multiple time points. Atg12 was downregulated at 3 (0.6) and 21 dpt (0.6). Atg13 was downregulated at all time points: 0 (0.4); 1 (0.1); 3 (0.2); 7 (0.4); 14 (0.1); and 21 dpt (0.1). Overall, for the muscle, there was significant upregulation of seven out of nine Atgs (atg4, atg5, atg7, atg16, bec-1, gabarap and lc3) for at least one time point over 21 dpt.
Treatment of rainbow trout with DON resulted in modulation of Atgs in the liver over 21 dpt (Figure 1). Atgs that were only upregulated at one time point were atg5 at 21 dpt (3.8), atg16 at 21 dpt (3.6), bec-1 at 14 dpt (3.4), gabarap at 3 dpt (5.1) and lc3 at 3 dpt (2.5). Atg7 was the only gene upregulated at multiple time points, at 0 (13.0) and 1 dpt (25.1). Both atg12 and atg13 were downregulated by DON, with atg12 downregulated at 21 dpt (0.1) and atg13 downregulated at 14 (0.1) and 21 dpt (0.1). Overall, for the liver, there was statistically significant upregulation of six out of nine Atgs (atg5, atg7, atg16, bec-1, gabarap and lc3) for at least one time point over 21 dpt.
Treatment of rainbow trout with DON resulted in modulation of Atgs in the muscle over 21 dpt (Figure 2). Only three out of nine Atgs (atg16, bec-1 and gabarap) were upregulated by DON in the muscle, but the expression of all three genes was upregulated at multiple time points. Atg16 was upregulated at 0 (5.0), 1 (4.2), 3 (3.6) and 7 dpt (7.1). Bec-1 was upregulated at 1 (7.3), 3 (6.3) and 7 (12.4). Gabarap was upregulated at 0 (6.7), 1 (11.8), 3 (7.0) and 7 dpt (15.6). Atg5, atg12, atg13 and lc3 were downregulated by DON. Atg5 was downregulated at 14 (0.1) and 21 dpt (0.3). Atg12 was downregulated at 1 (0.4), 3 (0.7), 14 (0.1) and 21 dpt (0.2). Atg13 downregulated at all time points: 0 (0.2), 1 (0.2), 3 (0.1), 7 (0.3), 14 (0.1) and 21 dpt (0.1). Lc3 was downregulated at 14 (0.1) and 21 dpt (0.2).
In the pair-fed group, the expression of most Atgs did not differ from the control group in both liver and muscle. In liver, only atg5, atg13 and lc3 were significantly upregulated and only at one time point (Figure 1). Atg5, atg13 and lc3 were upregulated at 1 (4.0), 1 (2.7) and 3 dpt (3.2), respectively. In muscle, lc3 was significantly upregulated at 1 (2.0) and 7 dpt (2.2). Atg12 was downregulated at 3 (0.7) and 21 dpt (0.5). Atg13 was both up- and downregulated; upregulated at 14 dpt (1.9) and downregulated at 3 dpt (0.4).
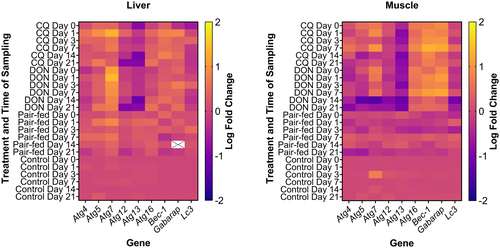
An overview of Atg expression in liver and muscle in response to the different treatments is presented as a heatmap (Figure 3). In summary, CQ and DON modulated a higher number of Atgs, and with greater magnitude in either up or down directions, in both liver and muscle than the pair-fed group. Atg13 was more often downregulated by CQ and DON in both liver and muscle than any other Atg.
3.2 Nutrient restriction-induced autophagy gene expression in RTL-W1
Prior to examining Atgs expression, the viability of RTL-W1 under starvation condition (L-15/ex) was examined to ensure modulation of Atgs is not caused by cell death. RTL-W1 exposed to L-15/ex remained viable over 6 days, as demonstrated by continued attachment to the culture vessel (Figure S1a), as occurred with complete medium (Figure S1b) and retention of 90% to 94% metabolic activity relative to pre-treated cells (Figure S1c).
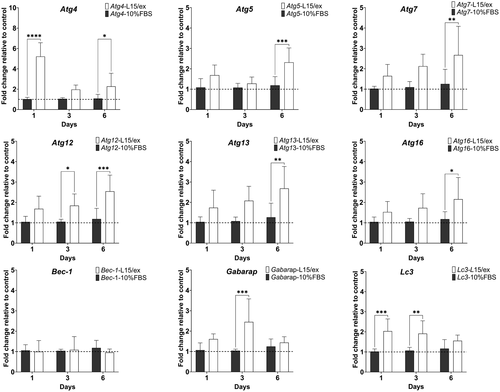
Starvation of RTL-W1 led to upregulation of eight out of nine Atgs for at least one time point (Figure 4). Atg4 was upregulated at 1 (5.2) and 6 dpt (2.3) (Figure 4). Atg5, atg7, atg13 and atg16 expressions were upregulated at 6 dpt by (2.3), (2.7), (2.7) and (2.2), respectively (Figure 4). Atg12 was upregulated at 3 (1.9) and 6 dpt (2.5). Gabarap was upregulated at 3 dpt (2.5), while lc3 was upregulated at 1 (2.0) and 3 dpt (1.9). Bec-1 was the only gene that was not upregulated at any of the time points examined. RTL-W1 undergoing starvation led to the greatest number of upregulated Atg at 6 dpt (Figure 4).
3.3 CQ reduced tolerance of RTL-W1 to nutrient restriction but enhanced autophagy gene expression in RTL-W1
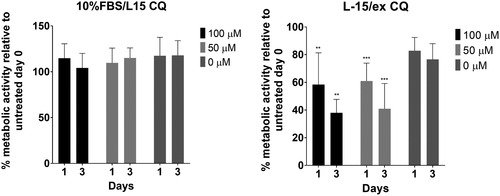
Prior to examining Atg expression, the potential cytotoxic effect of CQ on RTL-W1 was evaluated. RTL-W1 exposed to CQ at either 50 or 100 μM, while in complete medium (10%FBS/L-15), did not result in cytotoxicity up to at least 3 days post-treatment, as demonstrated by greater than 100% metabolic activity relative to pre-treated cells (Figure 5). However, the combination of 50 μM CQ and low nutrient (L-15/ex) reduced metabolic activity to approximately 61% by 1 dpt and 41% by 3 dpt (Figure 5). In L-15/ex with 100 μM CQ, RTL-W1 metabolic activity was reduced to approximately 58% by 1 dpt and 38% by 3 dpt (Figure 5).
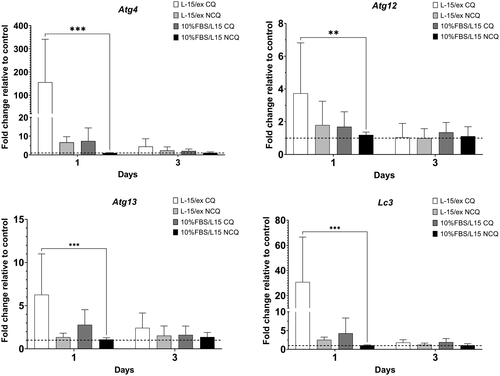
The potential effect of CQ on Atg modulation was evaluated by examining four Atgs (atg4, atg12, atg13 and lc3). L-15/ex with 50 μM CQ upregulated the expression of all four genes at 1 dpt (Figure 6): Atg4 expression was upregulated 155.7-fold; atg12 expression was upregulated 3.7-fold; atg13 expression was upregulated by 6.3-fold; and lc3 expression was upregulated 30.8-fold. However, the induction of these four Atgs by CQ disappeared by 3 dpt. The other three treatment conditions did not modulate the expression of these four Atgs (Figure 6).
4 DISCUSSION
The transcriptional upregulation of Atgs can be used to dissect the autophagy process at different steps in the pathway (Zhang et al., 2013). This work examined the transcription modulation of gene markers of autophagy in rainbow trout liver and muscle upon CQ and DON ingestion, using a panel of nine Atgs, and comparing with pair-fed group and optimally-fed control group. Measuring the transcription modulation of several autophagy stage markers provides a concordance of evidence demonstrating upregulation of autophagy transcripts in rainbow trout liver and muscle after CQ and DON ingestion. In the in vivo trial, CQ ingestion upregulated the most Atgs, followed by DON ingestion and then feed restriction. Further evidence for upregulation of autophagy transcripts by CQ was demonstrated in the rainbow trout liver cell line, RTL-W1. The effect of CQ and DON ingestion and nutrient restriction on autophagy gene regulation in rainbow trout is discussed below.
While the inhibitory effects of CQ on late-stage autophagy (autophagosome-lysosome fusion) are well documented, the stimulation of Atg transcripts by CQ has only been scarcely reported (Kimura et al., 2007; Klionsky et al., 2021). In this study, CQ upregulated most of the nine Atgs in both the liver and muscle of rainbow trout in vivo. However, two genes (atg12 and atg13) were primarily downregulated in vivo, particularly late in the treatment period at either 14 or 21 dpt. Previous studies in other fish species reported mainly downregulation of Atgs. In tilapia, atg12, lc3a and lc3b were downregulated in liver and lc3a and lc3b downregulated in muscle after 8 weeks (Han et al., 2019). In zebrafish, atg12 and bec-1 were downregulated in liver after 3 weeks of feed-containing CQ (Lu et al., 2019). In this study, both lc3 and bec-1 transcripts were upregulated in both liver and muscle by 1-week post-treatment, but the degree of upregulation fluctuated between different time points. Therefore, frequency and time of sampling could explain differences in observations between experiments. In the case of tilapia and zebrafish, sampling at earlier time points might have shown upregulation of lc3 and bec-1 transcripts. In vitro, CQ upregulated atg4, atg12, atg13 and lc3 in the rainbow trout liver cell line, RTL-W1, which correlates with previous observations in the rainbow trout gill cell line, RTgill-W1 (Liu, Balmori-Cedeno, et al., 2020).
The mechanism of Atgs induction by CQ could be explained by endoplasmic reticulum (ER) stress (Lee et al., 2015). CQ was previously shown to induce ER stress in a mammalian cell line (Jia et al., 2018), and presumably, the same can occur in fish cells. ER stress has been previously correlated with Atgs upregulation in rainbow trout in experiments with colchicine, an autophagosome-lysosome fusion inhibitor (Seiliez et al., 2016). Colchicine treatment of rainbow trout upregulated the expression of ER stress-induced genes (Ddit3 and Asns) alongside autophagy-related transcripts (Sqstm1 and Atg4b) in the liver (Seiliez et al., 2016). Consequently, the upregulation of Atgs by CQ and other pharmacological inhibitors requires further investigation, particularly when they are intended to be used as autophagy inhibitors.
Feeding rainbow trout with feed-containing DON resulted in both upregulation and downregulation of Atgs in liver and muscle for at least one time point throughout the experiment. To our knowledge, this is the first study to demonstrate the regulation of Atgs by DON in vivo in fish. Previous observations in a rainbow trout cell line (RTgill-W1) exposed to DON also showed mixed regulation of Atgs by DON. On day 1 post-treatment, atg4, atg9 and atg16 were upregulated, but atg5, atg7 and atg12 were downregulated. On day 3 post-treatment, atg9, atg13 and atg16 were upregulated, while atg4, atg12, gabarap and lc3 were downregulated (Liu, Balmori-Cedeno, et al., 2020). While there are some similar genes upregulated and downregulated, overall, there were few correlations between the regulation of Atgs in rainbow trout liver and muscle in vivo vs RTgill-W1 in vitro by DON. This could be due to the differences in the tissue of origin and duration of treatment (only 3 days for RTgill-W1). Interestingly, atg12 is the one exception, which appears to be more frequently downregulated in response to stress, for example, by DON and CQ in multiple previously mentioned studies with various models and by virus infection of fish and fish cells (Chu et al., 2019; Li et al., 2019). Other than fish, the effect of DON on the regulation of autophagy has been mostly studied in porcine to date. DON was observed in vitro to upregulate Atgs in porcine lymphocytes (lc3 and p62) (Ren et al., 2020), pheochromocytoma (PC12) cells (lc3 and bec-1) (Wang, Jiang, et al., 2020) and oocytes (lc3) (Han et al., 2016) and upregulate LC3 proteins in porcine hippocampal nerve cells (PHNCs) (Wang, Chu, et al., 2020) and intestinal columnar epithelial cells (IPEC-J2) cells (Gu et al., 2019). There is some evidence that autophagy can protect porcine cells from DON toxicity, which is a potential explanation for why Atgs were upregulated by cells in response to DON exposure (Tang et al., 2015; Wang, Jiang, et al., 2020). Whether autophagy protects fish cells from DON toxicity is currently unknown and represents an avenue for future research.
Dynamic and concerted modulation of Atgs are two common outcomes of nutrient starvation in fish and mammalian models. In this study, dynamic regulation of Atgs was demonstrated by fluctuations of Atgs transcripts at different time points in both the liver and muscle of rainbow trout. In starved zebrafish, LC3B-II proteins in hepatopancreas were detectable within 36 h of starvation but disappeared by the 48 h time point (Yabu et al., 2012). In starved mice, LC3 proteins were upregulated in the liver and muscle at 24 h post-starving but decreased by 48 h of starvation (Mizushima et al., 2004). Starvation often leads to upregulation of multiple Atgs in concert or concordance with each other, allowing for measurement of several autophagy stages markers at the transcript level. For example, rainbow trout fasted for 14 days led to upregulation of lc3b, gabarapl1, atg12-like and atg4b in the skeletal muscle (Seiliez et al., 2010). Chinese perch (Siniperca chuatsi) fasted for 5 days showed upregulation of lc3a, lc3b, becn-1, gabarapl1, atg4b, atg4c and atg4d, which correlated with increased autophagosomes and LC3 protein levels (Wu et al., 2020). These trends were also demonstrated in vitro in this study with liver cells (RTL-W1) and in previous studies with rainbow trout muscle and gill cells where multiple Atgs were upregulated at 1 and 3 dpt, respectively (Seiliez et al., 2010; Balmori-Cedeño et al., 2019; Liu, Balmori-Cedeno, et al., 2020).
CQ was demonstrated to impair the capacity of RTL-W1 to endure starvation, even as early as 1 and 3 dpt. Without CQ, RTL-W1 can survive nutrient starvation in L-15/ex medium for at least 6 days. Additionally, a previous study showed RTL-W1 survival in a serum-free culture medium for up to 20 days (Malhão et al., 2013). This suggests that autophagy may be an important mechanism for RTL-W1 survival during nutrient starvation, as had been previously observed in mammalian cells. CQ combined with serum starvation reduced survival of wild-type mouse mammary gland cell line (4 T1), mouse embryonic fibroblasts (MEF) and human disc nucleus pulposus (NP) cell, whereas serum starvation alone did not (Gallagher et al., 2017; Ito et al., 2021). The reduced cell viability was suspected to be caused by CQ inhibiting autophagy and causing toxicity by other unknown mechanisms. For example, autophagy knockdown and knockout in 4 T1 and MEF cells, respectively, did not reduce their sensitivity to CQ, which suggests an additional autophagy-independent mechanism for CQ toxicity (Gallagher et al., 2017).
In conclusion, the regulation of Atg expression by CQ, DON and nutrient restriction was demonstrated in rainbow trout liver and muscle, and by CQ and nutrient restriction in RTL-W1 cell line. In fish, CQ mainly upregulated Atg expression while DON had a mixed effect, both upregulating and downregulating. Of the three treatments, nutrient restriction (pair-fed) resulted in the least number of modulated genes. The combination of reduced feeding and exposure to CQ or DON likely led to a stronger effect on autophagy than nutrient restriction alone. This parallels the results observed in RTL-W1 where CQ combined with nutrient restriction resulted in enhanced Atg expression and reduced starvation tolerance. The positive upregulation of Atgs by CQ suggests caution when evaluating autophagy at the transcript level in experiments using CQ or other inhibitors with a similar mechanism. For DON, this is the first demonstration of its capacity to modulate Atgs in fish, which has implications for fish health in aquaculture due to the use of potentially DON-contaminated feed. Future studies need to examine the effect of DON on other systems linked to autophagy, such as growth and pathogen resistance.
ACKNOWLEDGEMENTS
Thanks to the Hagen Aqualab staff for infrastructure support.
CONFLICT OF INTEREST
The authors declare that they have no conflict of interest.
ETHICAL APPROVAL
The authors confirm that the ethical policies of the journal, as noted on the journal's author guidelines page, have been adhered to and the appropriate ethical review committee approval has been received. The research was performed with the approval of the University of Guelph Animal Care Committee.
Open Research
DATA AVAILABILITY STATEMENT
Datasets used for analysis during the study are available from the corresponding author upon request.


