Routing of Kv7.1 to endoplasmic reticulum plasma membrane junctions
Clara Serrano-Novillo, Irene Estadella, and María Navarro-Pérez contributed equally to this work.
Abstract
Aim
The voltage-gated Kv7.1 channel, in association with the regulatory subunit KCNE1, contributes to the IKs current in the heart. However, both proteins travel to the plasma membrane using different routes. While KCNE1 follows a classical Golgi-mediated anterograde pathway, Kv7.1 is located in endoplasmic reticulum-plasma membrane junctions (ER-PMjs), where it associates with KCNE1 before being delivered to the plasma membrane.
Methods
To characterize the channel routing to these spots we used a wide repertoire of methodologies, such as protein expression analysis (i.e. protein association and biotin labeling), confocal (i.e. immunocytochemistry, FRET, and FRAP), and dSTORM microscopy, transmission electron microscopy, proteomics, and electrophysiology.
Results
We demonstrated that Kv7.1 targeted ER-PMjs regardless of the origin or architecture of these structures. Kv2.1, a neuronal channel that also contributes to a cardiac action potential, and JPHs, involved in cardiac dyads, increased the number of ER-PMjs in nonexcitable cells, driving and increasing the level of Kv7.1 at the cell surface. Both ER-PMj inducers influenced channel function and dynamics, suggesting that different protein structures are formed. Although exhibiting no physical interaction, Kv7.1 resided in more condensed clusters (ring-shaped) with Kv2.1 than with JPH4. Moreover, we found that VAMPs and AMIGO, which are Kv2.1 ancillary proteins also associated with Kv7.1. Specially, VAP B, showed higher interaction with the channel when ER-PMjs were stimulated by Kv2.1.
Conclusion
Our results indicated that Kv7.1 may bind to different structures of ER-PMjs that are induced by different mechanisms. This variable architecture can differentially affect the fate of cardiac Kv7.1 channels.
1 INTRODUCTION
Voltage-dependent potassium channels play a role in cardiac action potentials. The Kv7.1 channel coassembles with the KCNE1 β regulatory subunit to mediate the slow delayed rectifier potassium current (IKs) in the human ventricle.1, 2 The IKs channel is a major repolarization current in the heart, and mutations in either Kv7.1 or KCNE1 can lead to long QT syndrome.3 The following are two major topics surrounding the nature of the Kv7.1-KCNE1 association that are subject to intense debate: (i) the stoichiometry of α and β subunits within the complex4-6 and (ii) the cellular compartment where the association takes place.7-10 For the first issue, sound evidence indicates that Kv7.1, as a member of the Kv superfamily, forms tetrameric channels that interact with one to four KCNE1 units, resulting in complexes with distinct kinetic properties and different architectures.4 However, the latter topic still generates intense debate. Accumulating evidence claims that channel proteins associate either at the endoplasmic reticulum or at the plasma membrane. However, recent studies suggest that Kv7.1 and KCNE1 route separately to the cell surface and then interact in endoplasmic reticulum-plasma membrane junctions (ER-PMjs). Advanced technologies demonstrate that while KCNE1 travels to these locations by a canonical anterograde route via the Golgi apparatus, Kv7.1 uses a noncanonical path to reach the plasma membrane.7, 8 Therefore, these ER-PMjs, which are plasma membrane to endoplasmic reticulum contact sites, are hot spots for investigating the IKs complex interactions.
Cardiac T-tubules are specialized ER-PMjs. In these tubules, the surrounding sarcolemma contacts the sarcoplasmic reticulum (SR) to form characteristic transverse structures that house the ion channel machinery for excitation-contraction (E-C) coupling. T-tubules host ryanodine receptors (RyR) and L-type Ca2+ channels (LTCCs) but also K+ channels that contribute to the termination of cardiac action potentials.11 Among these ion channel proteins, Kv7.1 and KCNE1 have been located in these structures.7, 12-14
In addition to cardiac T-tubules, different types of ER-PMjs exist in different tissues, which involve different scaffold proteins that shape their molecular architecture. Thus, while junctophilins (JPHs) are essential actors in the stabilization and formation of cardiac T-tubules, the voltage-dependent Kv2.1 channel, together with adaptor proteins such as vesicle-associated membrane proteins (VAMPs: VAP A and VAP B) and AMIGO 1, are crucial for proper ER-PMj functioning in neurons.11, 15 Moreover, during the immune system response, the interaction between ORAI channels located in the ER and STIM in the PM promotes the formation of ER-PMjs, which are crucial for the Ca2+ signaling cascade during the immune response.16, 17 Therefore, sound studies indicate that in this context, several ER-PMj structures may be generated, which could influence the final fate and function of ion channels. Considering that Kv7.1 routes to ER-PMjs by an unconventional mechanism7, 8 and that Kv2.1, which is important in neurons,11, 15 also contributes to an action potential in the heart,18 we investigated the molecular mechanisms that define Kv7.1 targeting to these specialized locations. We found that in a series of immortalized cell lines, such as AC16 cardiomyocytes, HEK 293, and COS-7 cells, not only JPHs but also Kv2.1 promote the formation of ER-PMjs. The generation of these structures augmented the migration and localization of Kv7.1 toward these locations. As a result, Kv currents increased. Differential ER-PMj origins altered channel function and dynamics. Without any physical interaction with JPH or Kv2.1, this variation was influenced by the different associations between the channel and scaffold proteins. The Kv7.1 interactome highlighted a number of proteins involved in the lipid raft architecture, which is a hallmark of ER-PMj membranes. Finally, we observed, for the first time, that Kv7.1 associates with VAMPs and AMIGO, which are Kv2.1 partners, and a differential interaction could influence the final fate of the channel reaching these PM to ER contact sites. Our data are of physiological relevance because they shed light on the mechanism that drives the unconventional migration of Kv7.1 to the PM and ER-PMjs, where it associates with KCNE1 to generate the crucial IKs current in the heart.
2 RESULTS
2.1 Kv7.1 localizes to the plasma membrane and cardiac T-tubules
To characterize the routing mechanism of Kv7.1, we first analyzed the localization of the channel. Kv7.1 was localized in the plasma membrane in HEK 293 cells transfected with Kv7.1-CFP. However, the channel, being an integral plasma membrane protein, exhibited rather limited cell surface colocalization (Figure 1Aa–c). As a result, we speculated that classical cell culture reflected nonnative conditions. Since cardiomyocytes and neurons are polarized cells, we cultured Kv7.1-expressing HEK 293 cells in Transwell permeable supports (TW), allowing cells to have full surface access to the culture medium (Figure 1Ad–f). Under such conditions, Kv7.1 was efficiently distributed throughout the plasma membrane (Figure 1Ag), which was further supported by 3D projections (Figure 1Ba–f) and biotinylation studies (Figure 1Ca,b). These data demonstrated that limited surface staining, usually a characteristic of this channel, is a technical limitation of 2D plastic culture conditions. Our results showed a channel localization of ER-PMjs in HEK 293 cells (Figure 1D) and in cardiac T-tubules stained by RyR, which are specialized sarcolemma-sarcoplasmic reticulum ER-PMjs in cardiomyocytes (Figure 1E).
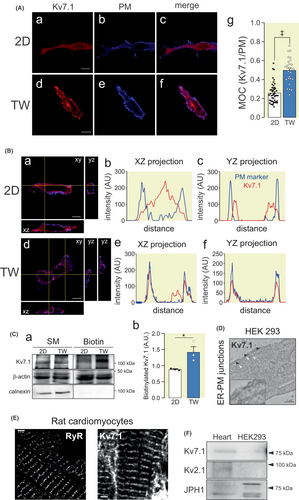
Several proteins promote the formation and localization of ER-PMjs.11 While JPHs participate in skeletal and cardiac muscles, the voltage-dependent Kv2.1 channel associates with these ER-PM contact sites in neurons.11, 19 While both proteins were present in the heart, only JPHs (i.e., JPH1) were endogenously expressed in HEK 293 cells (Figure 1F). Therefore, to analyze the effect and mechanism of Kv7.1 binding to ER-PMjs, we engineered human AC16 cardiomiocytes and HEK 293 cells by incorporating either Kv2.1 or JPH4.
2.2 Kv2.1 and JPH4 promote ER-PMj formation and upregulate plasma membrane Kv7.1 expression
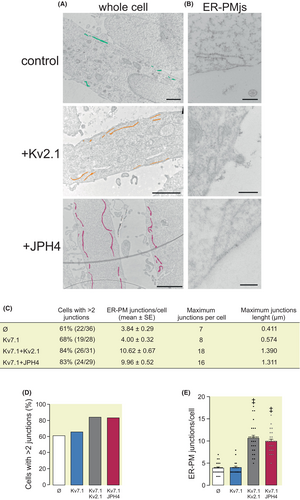
The presence of ER-PMjs in HEK 293 cells was analyzed by transmission electron microscopy (Figure 2). Nontransfected HEK 293 cells contained a limited number of ER-PMjs (Figure 2A,B). The expression of Kv2.1 and JPH4 notably augmented the number and length of these structures (Figure 2C–E). This is a consequence of the specific expression of Kv2.1 and JPH4 because the transfection of Kv7.1 itself did not increase the number of ER-PMjs. JPHs and Kv2.1 facilitate ER-PMj formation in muscles and nerves, and our results demonstrated that this role is further extended to other cell types.
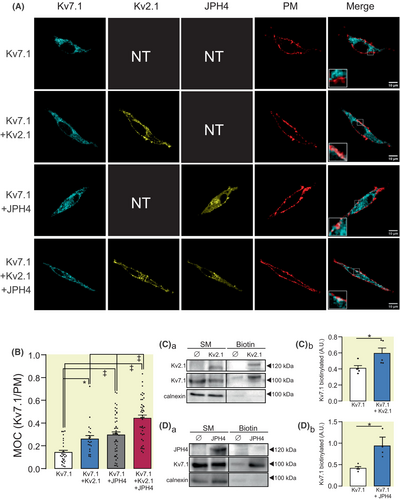
We next evaluated whether an increase in the number of ER-PMjs also upregulated the expression of Kv7.1 at the cell surface (Figure 3). HEK 293 cells were transfected with Kv7.1 in the absence or presence of Kv2.1, JPH4, or both. Indeed, not only Kv2.1 but also JPH4 augmented Kv7.1 targeting to the cell surface (Figure 3A,B). In addition, the presence of both Kv2.1 and JPH4 was somehow additive (Figure 3B). Biotinylation experiments further confirmed that Kv7.1 expression was upregulated at the plasma membrane in the presence of Kv2.1 and JPH4 (Figure 3C,D).
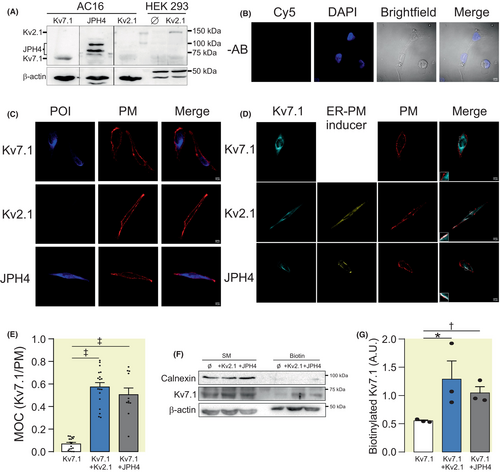
Similar results were obtained by using human AC16 cardiomyocites (Figure 4). AC16 cells expressed endogenous Kv7.1 and JPH4, but not Kv2.1 (Figure 4A,C). In this context, we transfected Kv2.1 and JPH4 and, similar to HEK 293 cells, both inducers increased endogenous Kv7.1 plasma membrane targeting (Figure 4D,E). In addition, Kv7.1 biotinylation studies further supported that both inducers elevated the targeting of Kv7.1 to the plasma membrane (Figure 4F,G). Immunohistochemistry studies in atrial human samples also support the colocalization of Kv7.1 and JPH4, but not Kv2.1 expression (Figure S1).
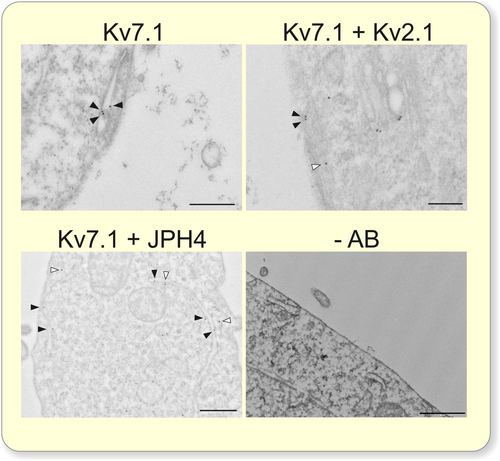
The Kv7.1 channel routes to the cell surface by an unconventional mechanism – bypassing the Golgi apparatus – which drives the channel via ER-PMjs to the cell membrane.7, 8 Thus, Brefeldin, which suppresses the canonical Golgi-dependent anterograde route, did not alter Kv7.1 ER localization (Figure S2A,B). This finding is specific to the Kv7.1 channel alone since its β-regulatory subunit KCNE1 follows the classical anterograde route via the Golgi, as demonstrated by incubation with Brefeldin (Figure S2C,D). Furthermore, Kv2.1 did not alter the expression of KCNE1 when expressed alone (Figure S2E,F). In this scenario, the transmission electron microscopy results confirmed that Kv7.1 was already present in these structures (Figure 5). Donut-like shapes, representing ER-PMjs, have been visualized when the ER contacts the PM.19 Our dSTORM images showed that these annular structures always contained Kv7.1. Most structures contained Kv7.1 alone or associated with KCNE1 but never KCNE1 alone, which reinforces that ER-PMjs are hubs for the Kv7.1-KCNE1 association caused by the differential trafficking mechanism of those proteins (Figure S3).
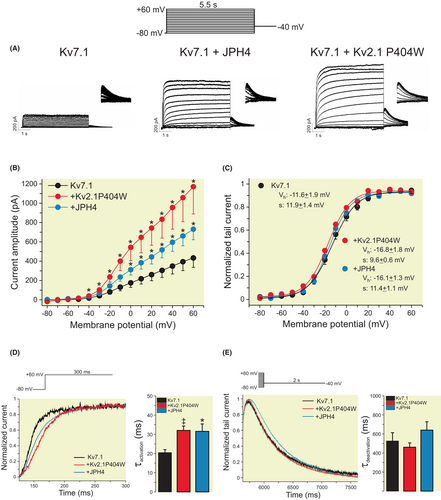
To determine whether Kv2.1- or JPH4-dependent ER-PMjs modulated the activity of Kv7.1, we performed patch-clamp studies (Figure 6). Voltage-dependent K+ currents elicited in COS-7 cells transfected with Kv7.1 increased in the presence of these two proteins. Similar to HEK 293 cells, Kv2.1 and Kv7.1 increased the expression of Kv7.1 in the cell surface of COS-7 cells (Figure S4). Neuronal Kv2.1 participates in the formation of ER-PMjs, independent of ion channel function. Therefore, we used a nonconducting Kv2.1 mutant (Kv2.1 P404W) to avoid current interference.20 Although current-less, the capacity of Kv2.1 P404W to increase the number of ER-PMjs was not altered (Figure S5). The presence of ER-PMj inducers (Kv2.1 and JPH4) increased Kv7.1 currents 2- to 3-fold with no changes in steady-state activation (Figure 6A–C). However, the presence of either protein slowed the activation of the channel (Figure 6D), with no changes in deactivation (Figure 6E). Our results indicated that the de novo formation of ER-PMjs upregulated Kv7.1 cell surface expression, which exhibited subtle changes in channel kinetics, suggesting different ER-PMj structures.
2.3 The nature of Kv7.1-containing ER-PMjs generated by Kv2.1 and JPH4 is different
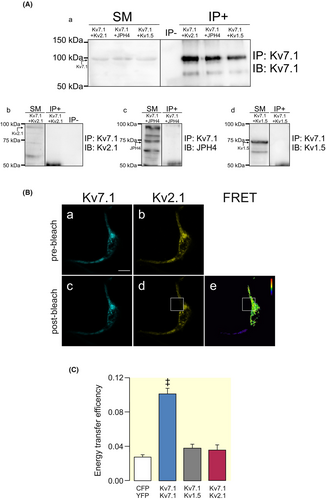
Next, we wanted to study mechanisms involved in the binding of Kv7.1 to ER-PMjs. Coimmunoprecipitation experiments and FRET analysis demonstrated that although Kv2.1 and JPH4 promoted the formation of ER-PMjs, concentrating Kv7.1 in these spots, we could not detect any physical association between the channel and ER-PMj inducers (Figure 7). Thus, Kv7.1 did not coimmunoprecipitate with either Kv2.1 or JPH4 (Figure 7A). Moreover, FRET efficiency between Kv7.1 and Kv2.1 was low and similar to that under negative conditions (Figure 7B,C). This result suggests that the formation of ER-PMjs is independent of Kv7.1 arrival. Therefore, once these structures are formed, the channel uses these hubs to route toward the plasma membrane. In fact, unlike Kv7.1, Kv2.1 uses the canonical anterograde route to reach the plasma membrane (Figure S6), which could impede their interaction.
Electrophysiology data (Figure 6B) and Kv7.1 surface expression (Figure 3) suggested some differences between Kv2.1- and JPH4-dependent ER-PMjs. In this context, dSTORM was used to analyze the structure and distance between Kv7.1 and ER-PMj inducers in Kv7.1-containing clusters (Figure 8). We expressed Kv7.1 in the presence of KCNE1 (IKs subunit) and Kv2.1 or JPH4 (ER-PMj inducers). As expected, the colocalization of Kv7.1 with KCNE1 was high, with a close distance between these two proteins (Figure 8B,C). However, colocalization of Kv7.1 with either Kv2.1 or JPH4 was low with larger distances between proteins, which further supported the FRET data. Surprisingly, and in combination with the electrophysiological data, clear differences between Kv2.1- and JPH4-dependent ER-PMjs emerged. Thus, Kv7.1-Kv2.1-containing clusters were more tightly packed than those containing Kv7.1 and JPH4 (Figure 8B,C).

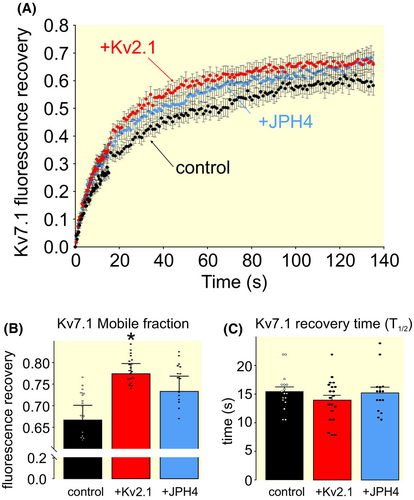
These differences, observed in the electrophysiology and dSTORM studies, were further supported by FRAP analyses. The dynamics of Kv7.1 were different in the presence of Kv2.1. Thus, the mobile fraction of Kv7.1 was higher in the presence of Kv2.1 than when the channel was alone (control) or upon ER-PMjs generated by JPH4 (Figure 9).
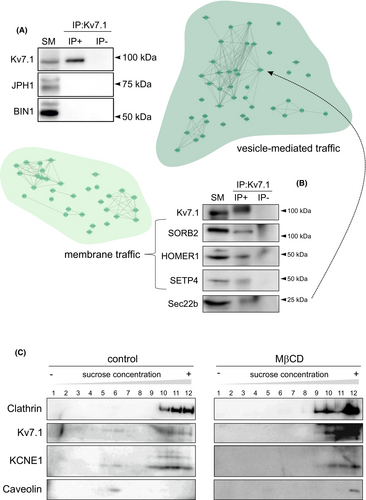
To decipher what differences, which differentially alter Kv7.1 function and dynamics, were present in ER-PMjs promoted by Kv2.1 and JPH4, we performed Kv7.1 interactome analysis in HEK 293 cells (Table S1). We refined the data by using the pathway enrichment of Cytoscape software and Reactome databases and the information available in the UniProtKB/Swiss-Prot database. Thus, two subgroups of proteins (vesicle-mediated traffic and membrane traffic) were further identified (Figure 10, Figures S7 and S8). In agreement with the data in Figure 7, Kv7.1 did not associate with JPH1 (JPH isoform in HEK 293 cells) or, surprisingly, with BIN1 (bridging integrator 1 protein involved in ER-PMjs in skeletal and cardiac muscle11) (Figure 10A). However, several proteins from vesicle traffic (Sec22b) and membrane traffic (SORB2, HOMER1, SETP4) coimmunoprecipitated with Kv7.1 (Figure 10B). Since many of these proteins are related to lipid rafts, the presence of Kv7.1 and KCNE1 in these membrane domains was confirmed and subsequently impaired by methyl-β-cyclodextrin (MβCD), a lipid raft disruptor (Figure 10C).
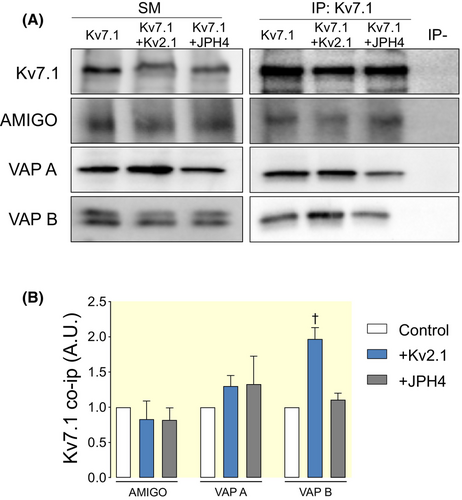
Our data indicated that distinct ER-PMj inducers, such as Kv2.1 and JPHs, influence Kv7.1 function and dynamics. Kv2.1, which also contributes to cardiac currents, and JPHs are essential components of ER-PMjs in striated muscle. Although the contribution of Kv2.1 in generating ER-PMjs in neurons has been addressed,11, 19 its role in muscle has not been elucidated. Kv2.1 participates in neuronal ER-PMjs by interacting with factors such as VAMPs (VAP A and VAP B) and its regulatory subunit AMIGO.11, 15, 19 Therefore, we wanted to analyze whether these proteins were differentially involved in Kv7.1-containing ER-PMjs. We expressed Kv7.1 in HEK 293 cells and analyzed the interaction with endogenous VAP A, VAP B, and AMIGO in the presence of either Kv2.1 or JPH4 (Figure 11). Interestingly, Kv7.1 was associated with VAP A, VAP B, and AMIGO (Figure 11A). These associations were not a consequence of Kv7.1 overexpression, according to the negative co-IP results with other related proteins provided in Figures 7 and 10A. Thus, to our knowledge, these data showed for the first time that VAMPs and AMIGO, binding partners of Kv2.1, interacted with Kv7.1, suggesting similar spatial localization by both channels. In addition, co-IP experiments showed that VAP B was more abundant in Kv7.1 co-IPs in the presence of Kv2.1. These data suggest that a differential ER-PMj protein composition and interaction fine-tune the function and dynamics of the cardiac Kv7.1 channel.
3 DISCUSSION
The voltage-dependent K+ channel Kv7.1 associates with the KCNE1 β-regulatory subunit to generate the cardiac IKs current.1, 2 This K+ current is crucial for the termination of cardiac action potentials. The association takes place in ER-PMjs before translocation to the plasma membrane.7, 8 Thus, the IKs channel, expressed in the sarcolemma as well as its contact sites with the SR, is located in the characteristic T-tubule structures, which house the ion channel machinery for excitation-contraction (E-C) coupling. T-tubules have many RyR and LTCCs, which contribute to the regulation of cellular calcium.11 A major issue surrounding the Kv7.1-KCNE1 associate includes the anterograde route of Kv7.1-KCNE1 to the plasma membrane as well as the cellular compartment where association takes place. Two major lines of evidence have been reported: (i) the association takes place early in the ER, and (ii) the interaction dynamically occurs at the plasma membrane.7-10 Recent findings indicate that Kv7.1 and KCNE1 travel to the cell membrane using different routes, thereby associating late in the biogenesis of ER-PMjs before delivery to the cell surface.7 Indeed, this claim would merge both hypotheses and support the localization of the complex at the cardiac sarcolemma and T-tubules as widely described.
Unlike KCNE1, Kv7.1 is unconventionally transported to the plasma membrane via ER-PMjs.7, 8 Therefore, we investigated the route and Kv7-1-related inducers of ER-PMjs, which govern the expression of the channel at the cell surface. Our work describes that Kv2.1, a neuronal K+ channel that also contributes to cardiac action potentials, and JPHs, facilitates the formation of ER-PMjs and upregulate the expression and function of Kv7.1 at the HEK 293 cell membrane and AC16 human cardiomyocytes. The legitimacy of HEK 293 cells for these studies – probably due to their neuronal fetal kidney origin21– has been soundly validated by the recapitulation of conformational coupling of Cav1.1 and RyR1 in HEK 293 cells transiently transfected with RyR1, Cav1.1, STAC3, Cavβ1a, and JPH2.22
Our data showed that Kv2.1, which is implicated in neuronal ER-PMjs, is effective in localizing Kv7.1 in these structures. Although migrating by different mechanisms to the plasma membrane, both channels contribute to cardiac action potentials. Therefore, their commonalities, not only in activity but also in spatial location, deserve attention. In fact, we found that VAMPs, such as VAP A and VAP B, and AMIGO, a Kv2.1 interacting protein, were associated with Kv7.1. These results situate these adaptors, which are important players that facilitate ER-PMjs, as major scaffolds in Kv7.1 localization in ER-PMjs.
Nonconducting neuronal Kv2.1 channels form clusters – corrals – that act as traffic hubs for other proteins to reach these specific membrane domains.23 To date, Kv2.1 has not been linked to the formation of ER-PMjs in the heart. Our data suggested that Kv2.1, in addition to its function as an ion channel, has a potential role in cardiac architecture. Moreover, JPHs are crucial for the generation of dyads in cardiomyocytes, neuronal signaling, and activation of T cells.11, 24 While JPH1-2 are cardiac isoforms, JPH3-4 are expressed in the brain. Normally, JPH1-2 requires the presence of other proteins to generate these ER-PMjs (e.g., JPH2 and Cav1.2), whereas JPH4, the isoform studied in this work, generates contacts between the ER and the PM by itself.11
Despite the origin, the ER-PMj membrane morphology was similar in all conditions. In many of the experiments, the extension of the ER was close to the PM until reaching distances inferior to 20 nm. JPH4 and Kv2.1 formed thin dense hooks that perpendicularly attached the ER to the PM and shaped Kv7.1 annular formations, previously described as donut-like structures.19 These structures match precisely with the morphology generated by JPH4 and other proteins, such as the STIM-ORAI complex, RyR, or synaptogamines.22, 25, 26 In fact, dynamic ring-shaped ER-PM contact sites change the morphology of the junctions in response to reticular calcium movements.27 For example, the STIM1 puncta signal reshapes into annular structures when extended synaptogamines (E-syt) relocate to the central area of these microdomains. Interestingly, E-syt1 alone induces these ring-shaped contacts; in contrast, STIM1 by itself can only generate the classical ER-PMjs clusters.28 Moreover, distances between the ER and the PM were different depending on the protein involved. This finding suggests that different proteins generate different types of ER-PMjs, morphologically and functionally, as both promote different calcium responses. Our results showed that Kv7.1 was also found in the ring-shaped ER-PMjs, assembling with KCNE1 to generate the IKs complexes.
In this context, synaptogamines, suspected to be involved in the formation of these structures, were not detected in the Kv7.1 interactome in HEK 293 cells. Therefore, other proteins might be involved in the reshaping of these contact sites, facilitating the formation of annular structures. Moreover, with no interaction, Kv7.1 and Kv2.1 are closer than Kv7.1 and JPH4. This finding suggests that some components of Kv2.1-related ER-PMjs are more tightly associated with Kv7.1 than those present in JPH4-related ER-PMjs. Our studies indicated that Kv7.1 and Kv2.1 share, at least, interactions with VAPMs and AMIGO. Both scaffolding groups of proteins are Kv2.1 partners that contribute to ER-PMj formation.15 In fact, from our data, VAP B is more abundant in Kv2.1-related ER-PMjs than in those containing JPH4.
In addition, we examined other Kv7.1 interactors participating in the localization of Kv7.1 ER-PMjs in HEK 293 cells. Neither JPH1, which is the isoform expressed in HEK 293 cells, nor BIN1 (amphiphysin II/bridging integrator 1 protein), which contributes to the trafficking of Cav1.2 to the dyads in cardiomyocytes,11 interacted with Kv7.1. While few COPII-related proteins were found (Sec22b), many proteins of the COPI coatomer were detected (COPa, COPb, COPd, COPe, or ARF4), suggesting that while little Kv7.1 escapes the ER, there is consistent control machinery ensuring that the channel is returned to the ER, avoiding the Golgi.29 Furthermore, few proteins related to intra-Golgi transport, such as ADP-ribosylation factor-like protein 1 (ARL1) or the vesicular-fusion protein NSF and trans-Golgi network vesicle budding (clathrin light chain A [CLTA] and ARF1), which are related to clathrin-mediated transport or endocytosis mechanisms independent of Golgi exit, were found in the Kv7.1 interactome. In addition, we found several lipid raft-related proteins supporting the raft-enriched ER-PMj localization of Kv7.1 as well as the role of ER-PMjs in lipid transportation.30
Kv2.1 and JPH4 affected the number and length of the complex, but Kv7.1 generated no effects on ER-PMj morphology. Therefore, unlike Kv2.1 and JHP4, the channel traveled to already formed hubs. Data also supported that Kv7.1, with no interaction with Kv2.1 or JPH4, uses three types of ER-PM junctions: (i) “native” or endogenous, (ii) those generated by Kv2.1 and (iii) those promoted by JPH4. In fact, colocalization analysis of Kv2.1 with post-ER subcellular compartments indicated that this channel, similar to KCNE1 and unlike Kv7.1, followed the classical secretory pathway. These results suggested that ER-PMj inducers do not need ER-PMjs as a traffic mechanism to reach the membrane. Kv2.1 appears to facilitate the formation of junctions once it reaches the membrane. Once there, these clusters hub other proteins, such as Kv7.1, to access the cell surface. In addition, the architecture of ER-PMjs varies because the distances between Kv7.1 and Kv2.1 or JPH4 and the membrane dynamics of Kv7.1 are different.
From our data, we conclude that the relationship between Kv2.1 and JPH4 with Kv7.1 is not the same. JPH4 generates contacts between the ER and the PM for Kv7.1, which is used as a mechanism for reaching the membrane. Once there, the channel diffuses along the membrane and the junctions and, thus, interacts with junctophilin. Kv2.1, instead, could not only generate the contacts used for trafficking but also trap Kv7.1 channels, share binding partners, and alter channel dynamics. The relationship between Kv7.1 and Kv2.1 encompasses more than just migration. Kv2.1 and JPHs are also both involved in the formation of dyadic structures. JPHs attach the ER to the phospholipids of the PM to stably anchor both membranes. Due to alpha helix domains located in the medial domain of the molecule, JPHs are elastic and regulate the dyad/ER-PM junction distance. Direct association with calcium channels from the PM and the SR has been described, in addition to their anchoring function. Moreover, these associations stabilize and modify the gating and current properties of both LTCC channels and RyR.11
To what extent the protein composition and architecture may affect Kv7.1 function, thereby shaping cardiac action potentials, is intriguing. However, our data indicate that, at least, the current density and channel dynamics are affected. In fact, studies in other excitable cells have exposed similarities but also important cell type–specific differences in the structure and function of ER-PMjs that surely remodel the fate of the ion channels.
4 MATERIALS AND METHODS
4.1 Plasmids, mutagenesis, and transient transfection
The genetic materials were sourced from various institutions and individuals. T. Jentsch (Leibniz-Institut für Molekulare Pharmakologie and Max-Delbrück-Centrum für Molekulare Medizin, Germany) provided the hKv7.1 complementary DNA (cDNA) in a pTLN vector. S. de la Luna (Centro de Regulación Genómica, Spain) contributed the hKCNE1 cDNA in a pHA vector. M. Tamkun (Colorado State University, USA) supplied YFP-rKv2.1HA and JPH4-GFP. To confocal microscopy and molecular biology studies, cDNAs of Kv7.1, KCNE1, Kv2.1, JPH4, and Kv1.5 were incorporated into pECFP-N1, pEYFP-N1, and pEYFP-C1 vectors (Clontech). Modification of the Kv2.1 channel was executed through mutagenesis to obtain a nonfunctional channel (Kv2.1 P404 W) utilizing the QuikChange multisite-directed mutagenesis kit (Agilent Technologies). All constructed materials were verified through sequencing. In addition, the PDsRed-tagged pleckstrin homology (PH) domain of Akt (Akt-PH-pDsRed), used as a membrane marker, was generously provided by F. Viana (Universidad Miguel Hernández, Spain) while the ER marker (pDsRed-ER), pECFP-N1, and pEYFP-N1 were acquired from Clontech.
4.2 Cell culture
Human AC16 cardiomyocytes, HEK 293, and COS-7 cells were cultured in Dulbecco's modified Eagle's medium supplemented with 10% (v/v) fetal bovine serum (FBS) and penicillin/streptomycin (100 U/mL). The culture media for AC16 cells was tailored, comprising 12.5% (v/v) FBS, 2 mM L-Glutamine, and penicillin/streptomycin (100 U/mL). Experimental setups involving molecular biology were conducted with cells seeded in 100-mm culture dishes. For confocal microscopy, cells were seeded onto poly-d-lysine–coated coverslips. Transient transfection protocols utilized Lipotransfectine (AttendBio Research) once cells achieved approximately 80% confluence. Certain experiments involved BFA (Sigma–Aldrich) at a concentration of 5 μg/mL for 4 h to ensure the complete turnover of Kv7.1 and Kv7.1-KCNE1 complexes. In some experiments, cells were cultured for 20 min with 10 mM methyl-β-cyclodextrin (MβCD) prior to protein extraction.
In transwell permeable support experiments, HEK 293 cells were cultured in permeable polyethylene terephthalate (PET) supports with a 0.4 μm pore (Transwells®, Costar). To avoid osmotic interference, the medium was always changed in the following order: empty basolateral chamber, empty apical chamber, fill the apical chamber, fill the basolateral chamber. Cell culture and transfection protocols were then applied following the same procedures as previously explained. For immunocytochemistry, the microporous membrane was cut using a scalpel. This membrane was mounted on a slide, with the cells facing up, and then covered with a coverslip. Special attention was given to not compress the cells to maintain their volume and cell morphology.
4.3 Cell unroofing preparations (CUPs) and immunocytochemistry
CUPs, identified as membrane sheets, were acquired by subjecting cells to osmotic shock.7 HEK 293 cells were seeded on poly-d-lysine–treated glass coverslips. Forty-eight hours after transfection, the cells were cooled on ice for 5 min and washed twice in phosphate-buffered saline (PBS). Subsequently, a 5-min incubation in KHMgE buffer [70 mM KCl, 30 mM HEPES, 5 mM MgCl2, and 3 mM EGTA (pH 7.5)] was conducted, followed by a threefold dilution and gentle washing with undiluted KHMgE to induce hypotonic shock. The lysed cells were then eliminated from the coverslips through pipetting. After two additional washes with KHMgE buffer, only the basal membrane sheets remained affixed. For the mCUPs, we employed an adapted method employing a more delicate burst in PBS for 10 min at room temperature (RT) before mounting them using a homemade Mowiol mounting medium.7
To identify the cis-Golgi network (GM130), trans-Golgi network (TGN46), and early endosomes (EEA1), we employed immunocytochemistry techniques. Initially, after cell fixation, permeabilization was achieved by treating the cells with 0.1% Triton X-100 for 20 min. Subsequently, a blocking step was carried out for 1 h using a solution comprising 10% goat serum, 5% nonfat powdered milk, and 0.05% Triton X-100. Following this, the cells were subjected to overnight incubation at 4°C with specific primary antibodies: mouse anti-GM130 (1:1000; BD Transduction Laboratories), rabbit anti-TGN46 2F11 (1:100; BioNova Científica), and mouse anti-EEA1 (1:500; BD Transduction Laboratories) dissolved in 10% goat serum and 0.05% Triton X-100. Subsequent to primary antibody incubation, the cells were treated with either goat anti-rabbit or anti-mouse Cy5-conjugated secondary antibodies for 2 h at RT. Finally, the specimens were mounted using a homemade Mowiol mounting medium for further analysis.
To label the plasma membrane of AC16 cardiomyocytes, a staining of Wheat Germ Agglutinin (WGA) conjugated with Alexa Fluor 555 (Fisher Scientific) was performed. Live cells were incubated on ice for 5 min, followed by three quick washes with cold PBS. Next, cardiomyocytes were stained with a dilution of WGA-Alexa Fluor 555 (1:1500) in DMEM supplemented with 30 mM HEPES for 5 min at 4°C. Cells were washed twice, fixed with paraformaldehyde 4% for 10 min, and mounted as explained before.
4.4 Immunohistochemistry on human cardiac samples
Auricle specimens from patients were fixed in 4% paraformaldehyde, cryoprotected in 30% sucrose in PBS, embedding in optimal cutting temperature (OCT), and -frozen in liquid nitrogen and stored at −80°C OCT. Samples were sectioned at 5 μm thickness in a cryostat (Leica). The study complies with the Declaration of Helsinki and was approved by the Ethics Committee of the University Hospital Puerta de Hierro–Majadahonda, Madrid, Spain. Written informed consent was obtained from all participants before being included in the study.
The sections were washed with PBS, treated with NH4Cl 50 mM for 10 min and Zyblack quenching for 5 min (ZytoVision). After permeabilization with 0.2% Triton X-100, samples were blocked with 5% BSA (Bovine Serum Albumin) for 30 min and incubated with rabbit anti-JPH4 (1:100; Alomone) overnight at 4°C. The next day samples were washed with PBS and incubated with a goat anti-rabbit secondary antibody (1:500) conjugated to ALEXA 488 (Invitrogen) for 45 min at RT. For a second immunodetection, the samples were blocked again with 5% BSA and incubated with mouse anti-Kv7.1 (1:400, Neuromab) at 4°C overnight, then washed with PBS and incubated with anti-mouse secondary antibody (1:500) conjugated to ALEXA 546 (Invitrogen) for 45 min at RT. The nuclei were stained with TO-PRO 3 (1/500; Invitrogen) for 30 min. Finally, the sections were mounted with 50% glycerol in PBS. Negative controls were made without primary antibodies.
Images were collected with a TCS SP5 confocal microscope (Leica) using a 63× HCX PL APO (1.4 numerical aperture) oil-immersion objective. The three channels were sequentially acquired avoiding cross-talk. The following excitation and emission parameters used were (488 nm, 500–540 nm) for the JPH4 signal (546 nm, and 557–572 nm) for Kv7.1 and (633 nm, 645–750 nm) for TO-PRO 3. The gains were adjusted for each channel avoiding saturation in pixel intensity. Z-stacks were obtained from confocal sections at 1 μm intervals. Laser intensity and detector sensitivity settings remained constant for all image acquisitions for experimental replicas. Image processing was performed with the ASF Leica software.
4.5 Confocal microscopy, Föster resonance energy transfer (FRET), and fluorescence recovery after photobleaching (FRAP)
The examination was conducted using a Leica SP2 laser scanning confocal spectral microscope (Leica Microsystems GmbH) that featured distinct lasers: an argon multiline laser (458, 488, and 514 nm), a diode-pumped solid-state laser (561 nm), and a helium-neon laser (633 nm). Image acquisition for various fluorophores utilized specific laser lines: YFP fluorophore images were captured employing the 514-nm laser, CFP with the 458-nm line, DsRed using the 561-nm line, and Cy5 utilizing the 633-nm line. To accommodate these wavelengths, double dichroic (458/514) and triple dichroic (488/561/633) filters were appropriately employed. Image capture was conducted at a resolution of 1024 × 1024 pixels, employing a 63/1.32 oil immersion objective lens. Scanning incorporated a pinhole aperture set at 1 Airy unit with zoom 4, in adherence to the Nyquist theorem for optimal lateral optical resolution. The scanning process was sequential for observing each fluorescent protein. Post-acquisition, colocalization analysis was performed using Manders' overlap coefficient (MOC), which is derived from a global analysis of pixel intensity distributions. The coefficient ranges between 0 (indicating no colocalization) to 1 (representing 100% colocalization) for overlapping images. This analysis was facilitated using JACoP (Just Another Colocalization Plugin; https://imagej.nih.gov/ij/plugins/track/jacop.html).
FRET was quantified employing the acceptor photobleaching configuration. The region of interest (ROI) underwent three scans using the 514-nm line of an argon laser at full 100% power intensity. Both before and after YFP photobleaching, images of CFP and YFP were captured, all sampled at 512 × 512 pixels with a 12-bit resolution. To compute the FRET efficiency, the formula (FCFPafter–FCFPbefore)/FCFPafter was utilized, where FCFPafter and FCFPbefore represent the fluorescence levels of the cells post- and pre-bleaching, respectively. The loss of fluorescence as a result of the scans was corrected by measuring the CFP intensity in the unbleached cell region. Analysis was performed using ImageJ 1.53 t.
For FRAP experiments, cells were transfected with Kv7.1-CFP alone or with Kv2.1-HA-YFP or JPH4-GFP in Mattek high glass bottom 35 mm dishes (Mattek). Images were acquired 48 h after transfection with an inverted Zeiss LSM880 laser scanning confocal microscope. Briefly, CFP was bleached for 128 ms with a 458 nm line Ar laser at maximum power, and fluorescence was monitored before and after bleaching with a 63/1.4 Plan Apo PH NA Gly immersion objective at zoom 2 acquired every 0.388 s for 1 min and then every 1 s; this method was controlled by Zen Black 2.3 SP1 FP3 software. In pre and post bleaching acquisition, excitation was performed with the 458 nm Ar laser line at 2% and emission was collected from 465 to 515 nm.
4.6 Superresolution imaging and sample preparation
Animal procedures received approval from both the Ethics Committee of the University of Barcelona and the Animal Ethics Approval Committee of the University of Exeter in compliance with the EEC directive (86/609/EEC). Ventricles from rats were meticulously dissected and promptly frozen in OCT (Tissue-Tek). Cryostat sections measuring 10 μM in thickness were sliced using a Leica CM3050 cryostat and delicately positioned onto pre-cleaned coverslips coated with 0.1% poly-l-lysine (Sigma). Subsequently, these sections underwent blocking using an Image-iT FX signal enhancer (Thermo Fisher Scientific) for 1 h at RT. Primary antibodies targeting Kv7.1 (Santa Cruz Biotechnology) and RyR2 (Thermo Scientific) were applied overnight at 4°C. Following this, the samples were subjected to a 2 h incubation at RT with secondary antibodies conjugated to Alexa Fluor 647 or Alexa Fluor 700 (Thermo Fisher Scientific). Similarly, the preparation of samples for superresolution imaging on autologous systems was performed. HEK 293-transfected cells were prepared 48 h after transfection using the same labeling protocol. The mCUP protocol was carried out in cultured transfected HEK 293 cells residing in 100-mm dishes before labeling. Imaging procedures took place in a switching buffer consisting of 90% glycerol and 100 mM 2-mercaptoethylamine in PBS. To capture dSTORM images, a modified Ti Eclipse inverted fluorescence microscope (Nikon, Japan) was utilized. Subsequent to image acquisition, custom-written PYthon Microscopy Environment software (available at https://bitbucket.org/david_baddeley/python-microscopy) was employed for image processing, event localization, and grayscale rendering. Colocalization analysis was performed as previously described.31 Briefly, binary masks of positively-labeled regions were calculated by thresholding images of proteins A and B so that the masked area contained 80% of the total labeling intensity. Binary masks were used for analysis as described previously.31 This analysis generates histograms of the percentage of protein A labeling as a function of the distance to the edge of the nearest region of protein B labeling.
4.7 Protein extraction, coimmunoprecipitation, biotinylation, lipid raft isolation, and Western blotting
Hearts, freshly obtained from wild-type male Wistar rats, were digested with collagenase and homogenized until cell dissociation. Homogenates were centrifuged for 1 min at 1000 × g. Lysis buffer (150 mM NaCl, 50 mM Tris, 1 mM EDTA, 1 mM EGTA, 1 mM MgCl2, and 1% Triton X-100 (pH 7.2)) was added and incubated for 20 min at 4°C until complete disaggregation. Next, samples were centrifuged at 12 000 × g for 10 min at 4°C. The supernatants were kept as protein extracts and prepared for Western blot analysis.
HEK 293, COS-7, and AC16 cells were washed twice with cold PBS and scraped with 0.5 mL of protein lysis buffer (150 mM NaCl, 50 mM Tris–HCl, 1 mM EDTA, 1% Triton X-100, pH 7.5) supplemented with protease inhibitors (1 μg/mL aprotinin, 2 μM leupeptin, 1 μM pepstatin, 1 mM PMSF). Lysates were homogenized by incubating the samples in an orbital shaker at 4°C for 10 min and further centrifuged at 15 000 × g for 15 min. Supernatants were collected, and pellets containing cell debris and nonlysed cells were discarded. The protein concentration was analyzed using the Bradford protein assay.
Low-density, Triton-insoluble complexes (lipid rafts) were isolated as previously described.32 Briefly, after three washes in phosphate-buffered saline (PBS), cells were homogenized in 1 mL of 1% Triton X-100 MBS (150 mM NaCl, 25 mM 2-morpholinoethanesulfonic acid 1-hydrate, pH 6.5), supplemented with 1 mg/mL aprotinin, 1 mg/mL leupeptin, 1 mg/mL pepstatin, and 1 mM phenylmethylsulfonyl fluoride to inhibit proteases, and centrifuged at 3000 × g for 5 min at 4°C. Sucrose in MBS was added to a final concentration of 40%. A 5%–30% linear sucrose gradient was layered on top and further centrifuged (39 000 rpm – 190 000 × g) for 20–22 h at 4°C in a Beckman SW41Ti swinging rotor. Gradient fractions (1 mL) were collected from the top and analyzed by Western blotting.
Coimmunoprecipitation experiments were conducted using transfected HEK 293 cells 48 h post-transfection. The procedure commenced with cell washing, twice with ice-cold PBS, followed by cell lysis in a solution comprising 1% Triton X-100, 10% glycerol, 5 mM HEPES (pH 7.2), and 150 mM NaCl. To isolate total protein samples, this lysate was supplemented with aprotinin (1 μg/mL), leupeptin (1 μg/mL), pepstatin (1 g/mL), and 1 mM phenylmethylsulfonyl fluoride as protease inhibitors. The resulting homogenates underwent centrifugation at 15 000 × g for 15 min, and the total protein concentration in each supernatant was determined using a Bio-Rad Protein Assay (Bio-Rad). Protein A–Sepharose beads (GE Healthcare) were incubated with an anti-Kv7.1 antibody (Alomone) for 1 h at RT. Once the bead-antibody complexes were established, they were covalently bound using dimethyl pimelimidate (DMP) (Pierce) by incubating with 20 mM DMP for 30 min at RT. Subsequently, the cross-linking reaction was terminated by the addition of 0.2 M glycine (pH 2.5). The cell lysates underwent a pre-clearing step with protein A–Sepharose beads for 1 h at 4°C with gentle mixing. Following this, equal amounts of protein samples (1–2 mg of protein) were subjected to overnight incubation with the bead-antibody complexes at 4°C. After five washes, the proteins bound to the antibody-bead complexes were eluted using 100 μL of 0.2 M glycine (pH 2.5).
Cell surface protein biotinylation was conducted utilizing the Pierce Cell Surface Protein Isolation Kit (Pierce). Initially, cells were subjected to incubation with EZ-Link Sulfo-NHS-SS-Biotin (sulfosuccinimidyl-2-[biotinamido]ethyl-1,3-dithiopropionate) for 30 min. Subsequently, the surplus-free reagent was neutralized following the manufacturer's instructions. The lysates, prepared according to the aforementioned process, underwent overnight incubation at 4°C within NeutrAvidin Agarose columns. Post-incubation, three washes were executed, and the biotinylated surface proteins were eluted using dithiothreitol SDS–polyacrylamide gel electrophoresis (SDS–PAGE) sample buffer.
To prepare for Western blotting, protein samples were readied in 1× Laemmli SDS loading buffer, followed by a 10 min incubation at 65°C. Subsequently, these samples were subjected to resolution through 8 to 10% SDS–PAGE. The separated proteins were then transferred onto Immobilon-P PVDF membranes (Millipore), which were pre-blocked using 5% nonfat powdered milk in PBS containing 0.05% Tween-20 before initiating the immunodetection process. The membranes were immunoblotted with antibodies against Kv7.1 (1:500, Alomone), KCNE1 (1:500, Alomone), Kv2.1, (1:500, Alomone), JPH1 (1:5000, Abcam), GFP (1:500; Roche), β-actin (1:50000, Sigma), Na+/K+ ATPase (Developmental Studies Hybridoma Bank, The University of Iowa), Calnexin (1:500, BD Transduction), Caveolin (1:250, Sigma), Clathrin heavy chain (1:1000, BD Transduction), BIN1 (1:2000, Abcam), SORB2 (1:250, Sigma), HOMER1 (1:500, Sigma), SEPT4 (1:250, Sigma), Sec22b (1:500, Sigma), AMIGO (1:100, NeuroMab), VAP A (1:250, R&D systems), and VAP B (1:1000, R&D systems). After washing, the blots were incubated with horseradish peroxidase (HRP)–conjugated goat anti-rabbit or anti-mouse secondary antibodies (Bio-Rad) and developed using the Immobilon Ultra Plus Western HRP Substrate (Merck Millipore).
4.8 Transmission electron microscopy
HEK 293 cells underwent transfection with Kv7.1-pCDNA3.1, either with or without Kv2.1-YFP or JPH4-GFP, and were then cultured for 48 h. Following this, fixation was carried out at RT using paraformaldehyde (PFA) and glutaraldehyde. Protein labeling involved the use of polyclonal anti-Kv7.1 (1:500; Alomone) and monoclonal anti-GFP mouse antibodies (1:50; Roche) targeting Kv2.1-YFP and JPH4-GFP, respectively. To tag Kv7.1-pCDNA3.1 and Kv2.1-YFP or JPH4-GFP, goat anti-rabbit and goat anti-mouse secondary antibodies conjugated to 12-nm and 18-nm gold particles were employed. The fixation process comprised a 1 h treatment with 4% PFA and 0.1% glutaraldehyde in 0.1 M PBS, followed by an additional 30 min in 2% PFA. The subsequent steps involved high-pressure freezing cryofixation using liquid N2, cryosubstitution, Lowicryl resin embedding, block polymerization, and ultrathin sectioning at a 60-nm thickness. These procedures were performed in collaboration with the Unitat de Criomicroscòpia Electrònica (CCiT, Universitat de Barcelona). The mounted samples on Formvar-coated grids underwent incubation with 2% uranyl acetate for 15 min and were subsequently immunogold-labeled as previously described. The observations and analysis of the samples were conducted using a Tecnai Spirit 120 kV microscope.
ER-PMjs were first reported in muscle cells.33 Based on TEM studies, ER-PMjs are characterized as ER regions lying along the PM. In general, the distance between the ER and the PM at ER-PMjs is within 10 to 30 nm. Most times, the ER and the PM align in parallel with a length of about 100–400 nm in many cell types.34
4.9 Proteomic studies
Coimmunoprecipitation experiments were performed with Dynabeads-Protein A® (Life Technologies). Briefly, 2 mg of protein lysate was added to 500 μL of lysis buffer supplemented with protease inhibitors. Samples were incubated for 2 h at RT or overnight at 4°C with Dynabeads® cross-linked to 7.5 mg of anti-GFP antibody (GeneScript). For antibody cross-linking, BS3 reagent (Thermo Fisher Scientific) was used following the manufacturer's instructions. Immunoprecipitates were washed three times and eluted with the elution buffer provided by the manufacturer. A total of 124 immunoprecipitations were independently performed and stored at −20°C. Elutions were concentrated together by methanol/chloroform precipitation, and the protein pellet was used for HPLC–MS analysis.
The sample was digested with trypsin following standard protocols.35 Briefly, the sample was reduced with 0.5 mM TCEP (Tris [2-carboxyethyl] phosphine)/50 mM Tris pH 7.4 for 30 min at 37°C and alkylated for 30 min with IAA (iodoacetamide) in the dark. Then, digestion was performed with trypsin (0.1 μg/μL) in 25 mM Tris (pH 7.4), 0.1% SDS at 37°C overnight. The digestion was stopped by adding formic acid. Peptides were extracted with 100% acetonitrile (ACN) and completely evaporated. Samples were reconstituted in 9 μL of 3% ACN and 1% formic acid aqueous solution for MS analysis. Liquid chromatography was performed using a nano-HPLC Eksigent system. HPLC separation was performed with a gradient from 3% to 35% ACN in 0.1% formic acid for 120 min. Peptides were analyzed with a Velos LCQ-Orbitrap mass spectrometer (Thermo Fisher Scientific). Data were processed using Xcalibur 2.1 (Thermo Fisher Scientific) and submitted to SEQUEST software for further analysis with the HUMAN UniProt SwissProt database. These procedures were performed in collaboration with Unitat de Proteòmica (CCiT, Universitat de Barcelona). Cytoscape v3.7.1 software was used. Functional enrichment analysis was performed using Gene Ontology, Reactome Pathways, and KEGG databases.
4.10 Electrophysiology
For electrophysiology, COS-7 cells were grown in 60-mm culture dishes using Dulbecco's modified Eagle's medium supplemented with 10% (v/v) fetal bovine serum and penicillin/streptomycin (100 U/mL). Transient transfection was performed using Lipofectamine 2000 (Invitrogen) when the cells reached nearly 60% confluence. Cells were transfected with Kv7.1 in pcDNA3.1 (2 μg) together with EBO pcD-Leu-2 (1 μg), Kv2.1 P404 W in pEYFP-C1 (2 μg) or JPH4 in pEYFP-C1 (2 μg).
Currents were recorded employing the perforated (amphotericin B) patch-clamp technique utilizing an Axopatch 200B amplifier (Axon Instruments), following previously established methods.36 The internal solution contained (in mM) K-aspartate 80, KCl 50, phosphocreatine 3, KH2PO4 10, Mg–adenosine 5′-triphosphate 3, HEPES-K 10, and EGTA 5, adjusted to pH 7.25 with KOH. Amphotericin B (20 mM; Sigma–Aldrich), dissolved in dimethyl sulfoxide, was added to the internal solution to achieve a final concentration of 0.5 mg/mL, as previously reported.7, 37 The composition of the external solution (in mM) comprised NaCl 130, KCl 4, CaCl2 1.8, MgCl2 1, HEPES-Na 10, and glucose 10, adjusted to pH 7.40 with NaOH. Junction potentials between the pipette and external solution were about −9 mV. Recorded currents underwent filtering at 1 kHz (using a four-pole Bessel filter) and sampling at 2 kHz. Micropipettes, fabricated from borosilicate glass capillary tubes (Narishige, GD-1), were pulled using a programmable horizontal puller (Sutter Instruments Co.) and then heat-polished with a microforge (Narishige). The micropipette resistance ranged from 2 to 4 MΩ. Data acquisition and analysis were performed using pClamp version 11 software (Axon Instruments). Recordings were conducted at room temperature (21–23°C) with a stimulation frequency of 0.03 Hz. Data analysis, including least squares fitting, and presentation were performed using Microcal Origin 2022 (Microcal Software) and Clampfit 11 programs.
AUTHOR CONTRIBUTIONS
Antonio Felipe: Conceptualization; funding acquisition; writing – original draft; validation; visualization; writing – review and editing; project administration; supervision; resources. Clara Serrano-Novillo: Investigation; writing – original draft; methodology; visualization; formal analysis. Irene Estadella-Pérez: Investigation; methodology; visualization; writing – original draft; formal analysis. María Navarro-Pérez: Investigation; methodology; visualization; formal analysis. Anna Oliveras: Investigation; formal analysis; methodology; visualization. Angela de Benito-Bueno: Investigation; formal analysis; methodology; visualization. Paula G. Socuéllamos: Investigation; visualization; methodology; formal analysis. Manel Bosch: Validation; supervision; resources. María José Coronado: Investigation; formal analysis; methodology; visualization. Daniel Sastre: Investigation; visualization; methodology; formal analysis. Carmen Valenzuela: Validation; supervision; resources. Christian Soeller: Validation; supervision; resources.
ACKNOWLEDGMENTS
Supported by the Ministerio de Ciencia e Innovación (PID2020-112647RB-I00 and PID2023-148085OB-I00 to AF and PID2022-137214OB-C21 to CV) and AEI (10.13039/501100011033), Spain and European Regional Development Fund (FEDER).
CONFLICT OF INTEREST STATEMENT
The authors declare no conflict of interest.
Open Research
DATA AVAILABILITY STATEMENT
The data that support the findings of this study are available from the corresponding author upon reasonable request.


