Protein O-GlcNAcylation levels are regulated independently of dietary intake in a tissue and time-specific manner during rat postnatal development
Funding information:
This work was supported by "Société Française d’Anesthésie et de Réanimation" (Paris, France), "Fondation d'entreprise Genavie" (Nantes, France), «Fédération française de cardiologie» (France), «Agence nationale de la recherche» (20-ASTC-0032-01-HEROISME) (Paris, France), «Direction générale de l'armement» (Paris, France) and the National Heart, Lung, and Blood Institute of the National Institutes of Health under award number NIH R01HL122546 to AKO (United states). TD is PhD student supported by grants from Direction Générale de l’Armement (DGA), France. AP is PhD student supported by grants from InFlectis BioScience, France. JD, LBu and LBe are supported by grants from the Fonds National de la Recherche Scientifique et Médicale (FNRS, PDR T.0211.18), Belgium; from the Action de Recherche Concertée de la Communauté Wallonie-Bruxelles (ARC16/21-074), Belgium and from the FRFS-WELBIO (Fundamental Research of excellence in Strategic areas - Walloon Excellence in Life Sciences and Biotechnology, WELBIO-CR-2019A-01), Wallonia-Brussels Federation, Belgium. LBu is Postdoctoral Researcher whereas LBe is Research Director of FNRS, Belgium. JD is FRIA (Fund for Research Training in Industry and Agriculture, Belgium) grantee.
Abstract
Aim
Metabolic sources switch from carbohydrates in utero, to fatty acids after birth and then a mix once adults. O-GlcNAcylation (O-GlcNAc) is a post-translational modification considered as a nutrient sensor. The purpose of this work was to assess changes in protein O-GlcNAc levels, regulatory enzymes and metabolites during the first periods of life and decipher the impact of O-GlcNAcylation on cardiac proteins.
Methods
Heart, brain and liver were harvested from rats before and after birth (D-1 and D0), in suckling animals (D12), after weaning with a standard (D28) or a low-carbohydrate diet (D28F), and adults (D84). O-GlcNAc levels and regulatory enzymes were evaluated by western blots. Mass spectrometry (MS) approaches were performed to quantify levels of metabolites regulating O-GlcNAc and identify putative cardiac O-GlcNAcylated proteins.
Results
Protein O-GlcNAc levels decrease drastically and progressively from D-1 to D84 (13-fold, P < .05) in the heart, whereas the changes were opposite in liver and brain. O-GlcNAc levels were unaffected by weaning diet in any tissues. Changes in expression of enzymes and levels of metabolites regulating O-GlcNAc were tissue-dependent. MS analyses identified changes in putative cardiac O-GlcNAcylated proteins, namely those involved in the stress response and energy metabolism, such as ACAT1, which is only O-GlcNAcylated at D0.
Conclusion
Our results demonstrate that protein O-GlcNAc levels are not linked to dietary intake and regulated in a time and tissue-specific manner during postnatal development. We have identified by untargeted MS putative proteins with a particular O-GlcNAc signature across the development process suggesting specific role of these proteins.
1 INTRODUCTION
Protein O-linked-N-acetyl glucosaminylation, more commonly referred to O-GlcNAcylation (O-GlcNAc), is an ubiquitous, well-conserved and reversible post-translational modification (PTM) consisting in the addition of a monosaccharide (β-D-N-acetylglucosamine) provided by uridine diphosphate N-acetylglucosamine (UDP-GlcNAc), on serine and threonine residues.1 The formation of UDP-GlcNAc via the hexosamine biosynthesis pathway (HBP) requires the contribution of several metabolites (glucose, glutamine, acetyl-CoA, uridine and ATP) (Figure S1A). Due to the contribution of these energy-linked metabolites, O-GlcNAc has been described in the literature as a metabolic sensor.2 Yet the link between diet composition and O-GlcNAc levels is not fully understood. In utero, fetal energy intake is mainly carbohydrates from maternal blood. After birth, energy intake solely comes from the mother's milk, that is rich in lipids.3 This switch in energy sources at birth is described as the first metabolic transition. Lipids become the main energy source until weaning and hepatic glycogenolysis and gluconeogenesis are established to meet the needs of several organs including the brain.4, 5 After weaning, the mother's milk is replaced by a mixed diet: the carbohydrate intake increases while the fat intake decreases. This second nutritional transition is more commonly referred to as the suckling to weaning transition.3 These two different metabolic transitions are associated with changes in glucose metabolism.6, 7
Cardiac metabolism depends on the type of nutrients available for energy supply. During the fetal period, the heart relies entirely on glucose and lactate for generating ATP. After birth, cardiac metabolism swiftly transitions to lipids derived from maternal milk for ATP production, before transitioning to a mix of carbohydrates and lipids when adult.8 In contrast, the brain depends on glucose and ketone bodies during development and into adulthood under fasting condition. The brain can also use lipids during the suckling period, but their contribution to energy supply remain low compared to glucose.9
The link between glucose availability and O-GlcNAcylation levels is controversial and the role of metabolic flux through HBP is still largely unknown. Some studies done in non-cardiac cells report that increasing glucose concentrations enhances protein O-GlcNAcylation in cells,10, 11 while glucose deprivation has the opposite effect.12 However, other studies performed in cardiomyocytes show that glucose deprivation is associated with an increase in O-GlcNAc levels and acute hyperglycaemia has no effect on O-GlcNAc levels.13, 14 Early studies in adipocyte cell cultures suggested that 2%-5% of intracellular glucose was funnelled through the HBP.15 More recently, this value has been reduced to 1%-3% and even 0.003%-0.006% of glycolytic flux in the heart through a stable isotope metabolic flow study.16, 17 As a result, HBP flux may exert more control on protein O-GlcNAcylation levels than glucose concentration. This might vary across tissues and depending on the environmental conditions and developmental period.
Despite major metabolic changes throughout development and the importance of O-GlcNAcylation in physiological and cellular processes, the impact of metabolic transitions occurring early in life on this PTM remains to be clarified. Therefore, the purposes of this study were to (a) assess the impact of metabolic transitions during early development on HBP-related metabolites and enzymes and ultimately on O-GlcNAcylation levels in different organs and (b) identify putative O-GlcNAcylated cardiac proteins to better understand the role of this PTM in the heart throughout development. We found regulation of O-GlcNAc levels occur in a time and tissue-specific manner, independently of metabolic transitions and dietary intake.
2 RESULTS
2.1 Variations in protein O-GlcNAcylation levels, O-GlcNAc regulatory enzymes and metabolites in the heart, brain and liver throughout early stages of life
2.1.1 Variations in O-GlcNAcylation levels are tissue-dependent throughout postnatal development
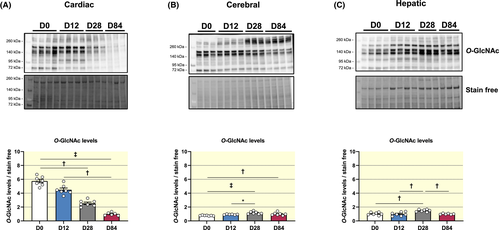
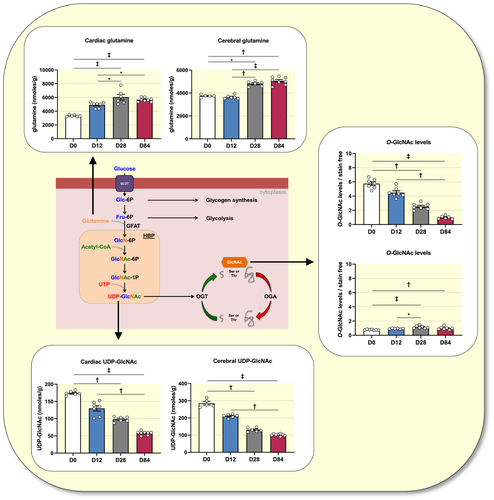
Cardiac O-GlcNAc levels decrease 5.75-fold from birth to adulthood (O-GlcNAc levels relative to D84: D0: 5.75 ± 0.25; D12: 4.49 ± 0.25; D28: 2.54 ± 0.16; D84: 1.00 ± 0.09) (Figure 1A). In contrast, cerebral and hepatic O-GlcNAc levels change in opposite direction with a smaller magnitude, namely an increase of ~20% during early stages of life (Figure 1B) and ~30% at D28 (Figure 1C), respectively. Altogether, these results suggest tissue-specific regulation of O-GlcNAc levels during development.
2.1.2 Changes in protein expression of O-GlcNAc regulatory enzymes are tissue specific and independent of their gene expression
Since O-GlcNAcylation levels vary throughout development, we assessed protein and gene expression of enzymes involved in their formation.
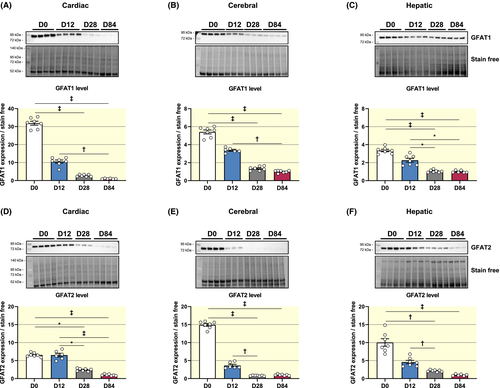
First, glucosamine-fructose-6-phosphate aminotransferase (GFAT) is the rate-limiting enzyme of the hexosamine biosynthesis pathway (HBP) and exists under two isoforms GFAT1 and GFAT2 (Figure S1A).18 Similar to what was observed for cardiac O-GlcNAcylation levels, GFAT1 protein levels decrease gradually in the heart throughout development (GFAT1 level relative to D84: D0: 31.88 ± 1.10; D12: 10.54 ± 0.86; D28: 2.74 ± 0.22; D84: 1.00 ± 0.07) (Figure 2A). A similar pattern occurs for cerebral and hepatic GFAT1, albeit changes are of smaller magnitude than in the heart (30- vs 5- and 3-fold, respectively) (Figure 2B,C). Cardiac, cerebral and hepatic protein levels of GFAT2 also decrease after 12 days of age (Figure 2D-F). The observed variations in protein levels concurred with variation in genes expressions only at the cerebral level (Table S1). Of note, cerebral Gfpt1 (GFAT1 gene) and Gfpt2 (GFAT2 gene) are more expressed at D0 and D12 compared to D28 and D84 while cardiac Gfpt2 and hepatic Gfpt1 are less expressed at D0 compared to D12 (Table S1).
Second, two enzymes are involved in the turnover of O-GlcNAcylation, adding or removing the GlcNAc moiety, namely O-linked N-acetylglucosamine transferase (OGT) and O-GlcNAcase (OGA) respectively (Figure S1A).
OGT and OGA exist under different isoforms from alternative splicing of the Ogt and Mgea5 genes respectively. Three isoforms of OGT are described: a nucleocytoplasmic (ncOGT—116 kDa), a short (sOGT—70 kDa) and a mitochondrial (mOGT—103 kDa) isoforms. Two isoforms of OGA have been clearly identified: a short (sOGA—76 kDa) and a long (lOGA—102 kDa) forms.18 We identified only a single form of each protein by western blot, corresponding to ncOGT and lOGA. Cardiac OGT protein level decreases throughout development (OGT level relative to D84: D0: 4.54 ± 0.28; D12: 3.22 ± 0.21; D28: 1.50 ± 0.08; D84: 1.00 ± 0.07) (Figure 3A). A similar pattern is observed for hepatic OGT (Figure 3C), whereas cerebral OGT level decreases from D0 to D12, and then significantly increases (Figure 3B). In all cases, changes in Ogt (OGT gene) expression do not concur with protein expression. In fact, Ogt cardiac gene expression increases at D12 before decreasing at D28 and D84, while cerebral Ogt expression is lower at D0 and D12 compared to D28 and D84. At the hepatic level, Ogt expression increases at D28 before decreasing (Table S1).
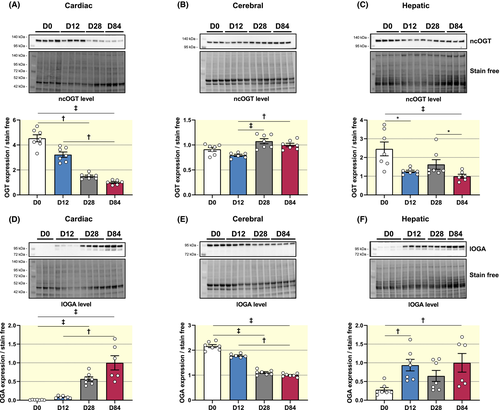
In the heart, OGA protein level is barely detectable at D0 and then increases throughout development (OGA level relative to D84: D0: 0.008 ± 0.002; D12: 0.078 ± 0.012; D28: 0.567 ± 0.058; D84: 1.000 ± 0.190) (Figure 3D). Unlike in the heart, brain OGA levels decrease from D0 to D84 (Figure 3E). In the liver, OGA increases at D12, tends to decrease at D28 before increasing again at D84 (Figure 3F). Like Ogt, Mgea5 expression does not correlate with protein expression. Mgea5 cardiac expression increases at D12 before decreasing at D28 and increasing again at D84. In the brain, Mgea5 is higher at D0 compared to the other periods studied. At the hepatic level, Mgea5 expression does not vary throughout development (Table S1).
In summary, in the heart, changes in protein levels of GFAT and OGT (decrease) and OGA (increase) concur with protein O-GlcNAc levels (decrease) throughout development. Notably, however, this does not occur in the brain or liver. Factors beyond tissue levels of these key enzymes likely underlie the broad developmental changes in protein O-GlcNAcylation observed.
2.1.3 Tissue UDP-GlcNAc level decreases while glutamine increases throughout postnatal development
To understand the variations in O-GlcNAcylation levels, we evaluated HBP-related metabolites (Table S2). We measured the glycolytic intermediates glucose-6-phosphate (G6P), fructose-6-phosphate (F6P) and fructose 1,6-bisphosphate (F1,6-P2), as well as, the amino acid glutamine. GFAT uses glutamine and F6P to form glucosamine-6-phosphate for UDP-GlcNAc formation through the HBP. As the sugar donor for protein O-GlcNAcylation; UDP-GlcNAc production affects O-GlcNAc levels.15 Tissue levels of G6P, F6P and glutamine increase, while F1,6-P2 decreases with development except in the brain at D84. UDP-GlcNAc levels decreased during development (heart: ~3-fold; brain: ~2.6-fold), which is similar to the pattern observed for cardiac protein O-GlcNAc levels (Figure 1A).
Altogether, these results suggest a cardiac-dependent regulation of protein O-GlcNAc levels by HBP-related metabolites, particularly UDP-GlcNAc and glutamine during development (Figure 4).
2.2 Impact of birth on cardiac, cerebral and hepatic O-GlcNAcylation and regulating factors
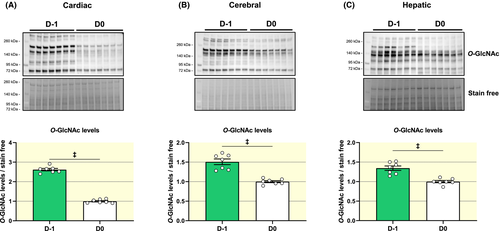
The literature describes O-GlcNAcylation as a metabolic sensor and a PTM involved in the stress response.19 Birth is both a major source of stress and an important metabolic transition. In utero energy intake comes primary from carbohydrates, whereas this switches to fats after birth. O-GlcNAcylated proteins fell after birth (D-1 to D0) in the heart, brain and liver (2.5, 1.5 and 1.3-fold respectively) (Figure 5A-C). In the heart, this reduction concurs with changes in protein expression of HBP enzymes between D0 and D-1, namely GFAT1, GFAT2 and OGT (~1.5-fold lower) and OGA (~6-fold higher) (Figures S2-S5). This is in contrast to brain and liver. In the brain, GFAT1 protein levels, but not GFAT2, are higher at D0 vs D-1, while OGT is lower and OGA is undetectable. In liver, changes in GFAT1 and GFAT2 between D0 and D-1 are not significant (Figures S2 and S3), while OGT decreases and OGA which is barely detectable at D-1, increases after birth (Figures S4 and S5).
As protein level, cardiac Mgea5 expression is lower at D-1 compared to D0. Gfpt1, Gfpt2 and Ogt gene expressions vary in opposite to protein levels, with a significant increase with birth only for Gfpt2. For the brain and the liver, Ogt expression is according to protein level with a decrease with birth. Birth has no impact on Gfpt1, Gfpt2 and Mgea5 gene expression (Table S1).
Next, we evaluated HBP-related metabolites. Between D-1 and D0, the changes in their levels were of subtle and most did not reach significance in the heart (F6P (P = .06), F1,6-P2 (NS), glutamine (P = .06) and UDP-GlcNAc (P = .09) except for G6P (50% higher at D0). In the brain, G6P is lower and glutamine and F1,6-P2 higher at D0 compared to D-1, while UDP-GlcNAc and F6P do not vary (Table S2).
In summary, there is a tissue-dependent impact of birth on protein O-GlcNAc levels, as well as, HBP enzymes and metabolites. The impact of stress cannot, however, be separated from that of the metabolic transition. Hence, we subsequently examined the impact of second metabolic transition at weaning.
2.3 Impact of suckling to weaning transition
2.3.1 Validation and impact of the low-carbohydrate diet
To assess the impact of the suckling to weaning transition, the impact of standard rat diet (D28) was compared to a nearly carbohydrate-free diet (D28F: 50% fat, 30% protein, 3% carbohydrates, minerals and cellulose for the remaining percentage). This diet was designed to mimic mother's milk and prevents the nutritional switch associated with weaning.6, 7 Interestingly, the glycaemia measured in the absorptive state is lower in rat fed with low-carbohydrate diet (D28: 9.60 ± 0.20; D28F: 6.45 ± 0.45; mmol/L) while the triglyceridaemia and cholesterolaemia are increased (triglyceridaemia: D28: 0.95 ± 0.06; D28F: 6.70 ± 1.66; mmol/L; cholesterolaemia: D28: 2.15 ± 0.05; D28F: 2.96 ± 0.12; mmol/L) (Figure 6A-C).

2.3.2 Impact of suckling to weaning transition on cardiac, cerebral and hepatic O-GlcNAcylation and regulating factors
Cardiac, cerebral and hepatic O-GlcNAc levels are not impacted by the diet modification (O-GlcNAc levels relative to D28 standard diet: heart: D28: 1.00 ± 0.06; D28F: 0.99 ± 0.08; brain: D28F: D28: 1.00 ± 0.04; 1.05 ± 0.04; Liver: D28: 1.00 ± 0.04; D28F: 0.90 ± 0.04) (Figure 7A-C). There were, however, significant tissue specific changes in protein expression of HBP enzymes in the D28F vs D28 group: (a) GFAT1 increases in the heart and brain, but decreases in liver, whereas GFAT2 decreases in the heart, but does not vary in the brain and the liver (Figures S6 and S7). (b) In the heart, OGT increases (D28: 1.00 ± 0.05; D28F: 1.40 ± 0.04) and OGA decreases (D28: 1.00 ± 0.06; D28F: 0.19 ± 0.02), while in liver, OGT decreases (D28: 1.00 ± 0.05; D28F: 0.83 ± 0.02) and OGA increases (D28: 1.00 ± 0.06; D28F: 1.33 ± 0.07) and in the brain, their expression is unchanged (Figures S8 and S9). In contrast, the diet modification has no impact on gene expression, and levels HBP-related metabolites (Tables S1 and S2), except for glutamine and UDP-GlcNAc levels in the brain, which are higher in the D28F group.
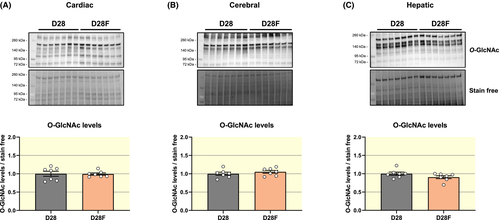
In summary, diet modification during the suckling to weaning transition does not have an impact on protein O-GlcNAc levels in the heart, brain and liver despite tissue-specific changes in the levels of HBP enzymes and related metabolites.
2.4 Identification of putative cardiac O-GlcNAcylated proteins by O-GlcNAcylomic
We performed unbiased O-GlcNAcylomic mass spectrometry to identify putative O-GlcNAcylated proteins in the heart and decipher the implication of this PTM on biological pathways during postnatal development. We chose the heart because this organ had the most profound developmental differences in O-GlcNAc levels.
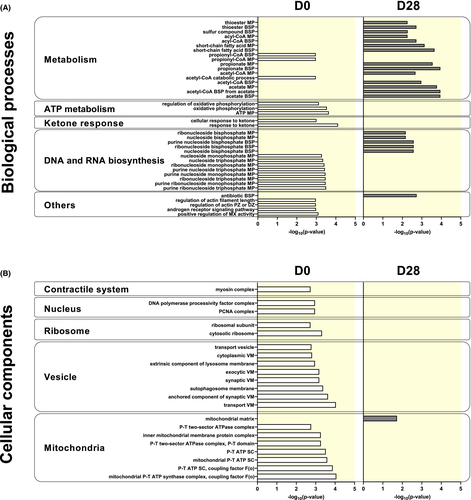
Overall, western blot validates the results obtained mass spectrometry and show more O-GlcNAcylated protein at D0 than D28. More interestingly, mass spectrometry identified 1589 putative O-GlcNAcylated proteins (Table S3). According to our quality control and criteria, 29 of the putative proteins described are only O-GlcNAcylated at D0, while only four putative O-GlcNAcylated proteins were unique to D28 (Table S4). After the GO enrichment, 1165 annotations at D0 and only 38 at D28 were found to be associated with biological processes (Table S5). For the cellular component analysis, 154 and 1 annotations were respectively founded at D0 and D28 (Table S5). For each, only the first 20 major annotations were represented.
Among the most salient findings, putative proteins only O-GlcNAcylated at D0 appear to be associated with a common biological process: heart metabolism. This notion is supported by the fact that the functions of O-GlcNAcylated protein only at D0 include nucleoside metabolism, ATP metabolism and propionyl/acetyl-CoA pathway. Interestingly, another biological process present is the ketone response (Figure 8A). Evaluating cellular components, we found putative proteins identified as only O-GlcNAcylated at D0 were mainly in related to mitochondria and vesicle transport (Figure 8B). On the other hand, putative proteins only O-GlcNAcylated at D28 are involved in metabolism specially that of lipids (eg short-chain fatty acid or acyl-CoA metabolic process) and localized into the mitochondria (Figure 8A,B).
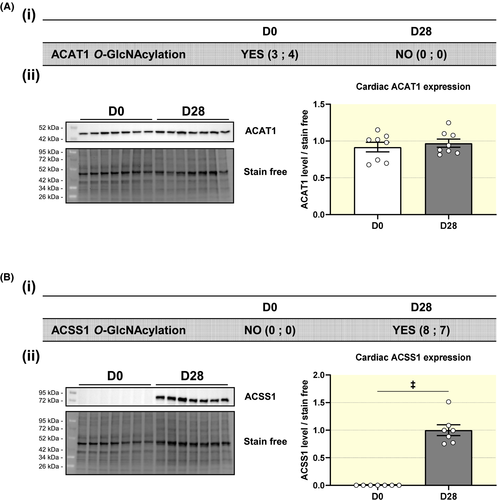
We further evaluated two representative proteins: the mitochondrial acetyl-CoA acetyltransferase also named acetoacetyl-CoA thiolase (ACAT1) and the acetyl-CoA synthetase (ACSS1). ACAT1 is involved in ketone body metabolism; it catalyses the condensation of two acetyl-CoA molecules into acetoacetyl-CoA. ACAT1 appears only at D0 in our O-GlcNAcylomic studies (Table S3). To confirm that the observed variation of O-GlcNAcylation is not due to changes in protein expression, we analysed ACAT1 total protein levels. In fact, ACAT1 protein expression was similar between D0 and D28 (Figure 9A). ACSS1 is involved in several pathways including metabolism of ketone bodies and lipids. O-GlcNAcylated ACSS1 appears only at D28 (Table S3). Unlike ACAT1, ACSS1 protein is only expressed at D28, revealing that its appearance in our O-GlcNAcylomic could be mainly due to the upregulation of protein expression and not by regulation of its O-GlcNAcylation (Figure 9B).
3 DISCUSSION
We demonstrate for the first time that cardiac, cerebral and hepatic O-GlcNAc levels, as well as those of HBP enzymes and related metabolites, are regulated in a tissue- and time-specific manner, independently of the metabolic transitions associated with early postnatal developmental stages. This result suggests tight regulation of O-GlcNAc levels to specific level for each specific developmental period and organ. Interestingly, regulatory enzymes for O-GlcNAcylation (GFAT1, GFAT2, OGT and OGA) varied according to the O-GlcNAc levels only in the heart. We also suggest that UDP-GlcNAc and glutamine (and glucose phosphate intermediate) are not the main regulatory elements of O-GlcNAc in all tissues examined, including the heart, throughout the first days of rodent life.
3.1 Interaction between O-GlcNAcylation, postnatal development and metabolic transitions
Our first important finding is that cardiac, cerebral and hepatic O-GlcNAcylation levels do not vary in a similar manner during postnatal development. Yang and colleagues demonstrated that O-GlcNAcylation levels were different between organs (brain, lungs, skin and thymus) at 4 and 20 months of age in mice, which is consistent with our results, yet it only covered the adulthood period.20 However, in their study, changes in O-GlcNAcylation levels are similar in all the organs, while we report a tissue-specific variation throughout development.
We show that O-GlcNAc levels decrease at birth, which is the first metabolic transition. Other physiological changes at birth, such as going from a low oxygen environment in utero to higher arterial oxygen content, could potentially cause this variation.21 A second metabolic transition occurs at weaning. To understand the impact of this transition, a group of rats were fed with a low-carbohydrate diet to mimic fat content of breast milk (75% of the energy is provided by fat) to avoid pups carbohydrate intake associated with the consumption of kibbles. O-GlcNAc levels remained similar between the groups. We speculate that OGA and OGT levels change in response to nutrient intake to maintain constant O-GlcNAc levels. We therefore suggest that O-GlcNAc levels are independent of energy sources and maintained in a specific level for each organ and developmental period. Conversely, increased O-GlcNAc levels cause negative feedback via an elevation of the expression of OGA.22 Taken together these results showed that (a) metabolic sources have no impact on O-GlcNAc levels, (b) organs seems to alter levels of proteins involved with O-GlcNAcylation to maintain O-GlcNAc homeostasis and (c) these levels vary according to the different stages of life.
In this study, UDP-GlcNAc and glutamine levels were quantified throughout development to better understand their potential relationship with O-GlcNAcylation. Glutamine is described to induce an increase in UDP-GlcNAc level and O-GlcNAcylated proteins.23 In our study UDP-GlcNAc level decreases with brain development, while O-GlcNAc levels increase. At the cardiac level, glutamine level increases while O-GlcNAc levels decrease. Finally, cardiac levels of UDP-GlcNAc in D28F group does not evolve compared to D28 group. This observation is in accordance with the result obtained by Taylor et al in HepG2 cells where the UDP-GlcNAc level does not change when glucose concentration varies from 0 to 20 mmol/L 12 and with data from Olson et al where the UDP-GlcNAc levels does not change when glucose concentration varies from 5.5 to 25 mmol/L in perfused heart.17 Moreover Balteau et al demonstrated that hyperglycaemia does not acutely modify O-GlcNAc levels in adult cardiomyocytes.13
Moreover glucose metabolism varies throughout development; Issad et al have demonstrated that insulin sensitivity develops with the suckling-weaning transition in the rat, potentially driven by the transition from high-fat milk to high-carbohydrate diet.24 This insulin-sensitivity is associated with modifications of total glucose metabolism and membrane GLUT4 recruitment which is higher in adipocytes after an insulin stimulation in high-carbohydrates weaned rats compared to high-fat weaned rats or suckling rats.6, 7 Despite all these changes in glucose metabolism, we observe a decrease in O-GlcNAcylation levels throughout development. In addition, all of these data suggest that neither UDP-GlcNAc, glutamine or even glucose are the main regulatory elements of O-GlcNAc levels.
3.2 O-GlcNAcylation and cardiac metabolism during postnatal development
O-GlcNAcylated proteins affect gene regulation, metabolism, structural function and stress.25 To the best of our knowledge, no prior studies evaluated developmental differences in cardiac O-GlcNAcylation.
Interestingly, we show that putative proteins only O-GlcNAcylated at D0 in the heart are mainly associated with metabolism. Cardiac metabolism is known to be modulated to meet organs need in different situation such as stress (eg exercise or pathophysiological situation).26 We propose that a modulation of O-GlcNAc levels on proteins associated with metabolism in such situations impact cardiac metabolism and function. Two proteins involved in metabolism with a particular O-GlcNAc pattern were studied. ACAT1 is only O-GlcNAcylated at D0 while expressed similarly at D0 and D28, which suggests regulation of its activity via O-GlcNAc throughout postnatal development. ACAT1 is involved in the ketone pathway, which are used by the heart during situation of starvation. Considering all these data, we can assume that O-GlcNAc level variation may influence cardiac ability to respond to stress at different developmental stage. This could explain why after cardiac ischemia induced at D1, a full recovery of cardiac function occurs within a month while heart function is drastically blunted when coronary ligation is done at D7.27 Taken together, it could indicate that O-GlcNAc plays a crucial role in cardiac adaptation to stress and postnatal development.
Putative proteins only O-GlcNAcylated at D28 are associated with lipid metabolism pathways. It has been recently described that fatty acid metabolism and O-GlcNAcylation have an impact on cardiac hypertrophy.28-30 We speculate that these proteins are involved in the switch from hyperplasia to hypertrophy development in the heart at the third postnatal week.31
3.3 Limitations
In our study, we sought to evaluate O-GlcNAcylation of proteins at different development periods using a Click-iT® and immunoprecipitation technique. With this method, only putative O-GlcNAcylated proteins are identified by mass spectrometry, this is why total protein expression is not reported here. For the protein of interest, a western blot analysis, as we have made for ACAT1 and ACSS1, must be performed to study the protein expression evolution during development.
4 CONCLUSION
We found that O-GlcNAc levels are not regulated by nutritional change, but in a tissue-, time- and protein-specific manner throughout postnatal development. The major involvement of these proteins in metabolism in the heart suggests a close relationship between this PTM, the stress response and the development in this tissue. This study opens perspectives to decipher O-GlcNAcylation processes: (a) study the in vivo activity level of OGA, OGT and GFAT to identify the regulator of the O-GlcNAcylation rate, (b) study the effect of O-GlcNAcylation on the activity, cell localization, expression or interaction of identified proteins by Click-iT® approach to better understand the O-GlcNAcylation and its involvement in these pathways.
5 MATERIAL AND METHODS
5.1 Reagent
5.1.1 The O-GlcNAcase inhibitor NButGT was synthetized using MSM methods 32
5.1.2 Animal model
Wistar rats were used at different developmental ages: before and after birth (D-1 and D0, respectively; n = 8), before and after weaning (D12 and D28, respectively; n = 8) or adult (D84; n = 8). Pregnant females were delivered to the Unité Thérapeutique Expérimentale at 15 days of gestation, in order to obtain rats D-1, D0 and D12. Other animals arrived one-week prior sacrifice and housed under standard conditions for acclimation. Eight 12 days old Wistar rats (D28F) were fed with low-carbohydrate diet in which the standard diet (SAFE A04; Safe, Augy, France) was replaced by a high-fat diet (50% fat, 30% protein, 3% carbohydrate, minerals and cellulose for the remaining percentage) (#U8954P, 00001 version; Safe). This diet mimics mother's milk and we used it to prevent the metabolic transition associated with weaning (Figure S1B).
Rats were housed under standard conditions of temperature (21-24°C), humidity (40%-60%) and 12 hours light/dark cycle with light period starting at 07:00 a.m. Food and water were available ad libitum. Experiments were performed in accordance with the ethics committee in charge of animal experimentation of the Pays de la Loire (#12760), French law on animal welfare, EU Directive 2010/63/EU for animal experiments, and the National Institutes of Health (NIH) Guide for the Care and Use of Laboratory Animals (NIH Pub. No. 85-23, revised 2011).
5.2 Organs and blood sampling
Rats were anaesthetized by inhalation of an isoflurane mixture (Forène, Abbott, Rungis, France) 5% and O2 (at a flow rate of 1 L·min−1) in an induction chamber. Organs were collected for biochemical and molecular biology analyses after sacrifice under standardized conditions (between 8:30 am and 10:00 am) to avoid circadian modifications on protein O-GlcNAcylation levels. Blood was collected from the vena cava. The beating heart was freeze-clamped using Wollenberger clamp. Liver and brain are then removed and immediately frozen in liquid nitrogen.
5.3 Tissue preparation
Frozen tissues were crushed in a mortar to obtain a powder that will be used for protein, mRNA or mass spectrometry analyses. In order to preserve post-translational modifications, all grinding steps were carried out in liquid nitrogen. Powder was then stored at −80°C.
5.4 Protein and RNA analyses
The powder was solubilized on ice in lysis buffer (600 µL/30mg powder) (Table S6). A second grinding was carried out using the TissueLyser (Qiagen, Hilden, Germany) at 30 Hz for 1 minute and 30 seconds. A centrifugation at 10 000 g and 4°C was finally carried out for 5 minutes to precipitate the cellular debris. The supernatant, containing the proteins, was recovered to perform a protein quantification assay based on bicinchoninic acid method.
Western blotting experiments were performed on heart, brain and liver as described previously33 (Table S7). Analysis was performed using Image Lab software (Bio-Rad, California, United States). For each target, a ratio to the corresponding stain-free intensity was calculated.
The extracted RNAs were reverse transcribed into complementary DNA (cDNA) using the cDNA Reverse Transcription High-Capacity kit (Applied Biosystem, Courtaboeuf, France). The reverse transcription was carried out in two steps: 10 minutes at 25°C followed by 2 hours at 37°C. PCR was performed as described previously34 with a reaction mixture containing Power SYBR® Green PCR Master mix (#4367659, Applied Biosystem, Warrington, United Kingdom) and exon-exon primers for the gene of interest (Table S8). For each tissue, samples were quantified in duplicate and normalized to YWHAZ and GAPDH. The results are obtained using StepOnePlus software (Thermo Fisher Scientific, Massachusetts, USA).
5.5 Metabolic assessment
Blood sample from rats were collected using tubes containing EDTA-K2. After centrifugation at 3.000 g during 10 minutes, plasmas were collected and stored at −80°C until analysis. All parameters were measured on Cobas 6000 Ce Roche analyzer (Roche Diagnostics, Meylan France) using dedicated reagents. For substrates: Glucose measurement was performed using enzymatic method with hexokinase; cholesterol by enzymatic method using cholesterol oxidase; triglycerides by enzymatic method using lipoprotein lipase.
5.6 Mass spectrometry and protein identification
5.6.1 Purification of O-GlcNAcylated proteins and LC-MS/MS
Twenty milligrams of heart powder were homogenized in 200 μL of RIPA lysis buffer (ThermoFisher Scientific Inc, Waltham, Massachusetts, United States, #89900) supplemented with a protease/phosphatase inhibitor cocktail (ThermoFisher Scientific Inc #78430 and #78428) and 1 µmol/L of O-GlcNAc cycling enzyme inhibitors (Sigma-Aldrich, Saint Louis, Missouri, United States, A7413 and A7229). Proteins from the lysate were precipitated using the chloroform/methanol precipitation method and then resuspended in 1% SDS and 20 mµmol/L HEPES buffer at pH 7.9. To completely dissolve the pellet, proteins were resuspended and heated 5-10 minutes at 90°C O-GlcNAc groups from proteins were firstly stabilized and labelled with tetramethylrhodamine azide (TAMRA) by using the Click-iT® O-GlcNAc enzymatic labelling system kit (C33368) and followed by the Click-iT® protein analysis detection kit (C33370) from Invitrogen according to the manufacturer's instructions. Afterwards, SDS was quenched with NEFTD buffer (100 mµmol/L NaCl, 50 mµmol/L Tris-HCl pH 7.4, 5 mµmol/L EDTA, 6% NP-40) and lysate was precleared with washed protein G sepharose beads. Following centrifugation (500 g–1 minute), supernatant was incubated with pre-washed protein G sepharose beads (10 µL/500 µg of protein) coupled with anti-TAMRA antibody (15/500 µg of protein, A6397, Invitrogen) for 1.5 hour at 4°C. After centrifugation (500 g—1 minute), the beads were washed with once NEFTD buffer and three times with NEFT buffer (NEFTD without NP-40). The beads were then boiled 5 minutes in Laemmli buffer (2 mµmol/L EDTA, 4% SDS, 20% Glycerol, 0.004% bromophenol blue, 50 mµmol/L DTT and 100 mµmol/L Tris pH 6.8). The proteins from above were separated on 1 mm criterion TGX, 4%-15%, 26 wells (Bio-Rad, 567-1085) and stained with Coomassie blue (Sigma-Aldrich). Gel bands were first in-gel digested with trypsin. Peptides were then analyzed by HR/AM LC-MS/MS on an Orbitrap tribrid Fusion Lumos essentially as described.35 Spectra were acquired by a data dependent scan routine with ion precursor detection in the Orbitrap and daughter ion in the Iontrap. The resulting MS/MS data were processed using Sequest HT search engine within Proteome Discoverer 2.3 against a rat protein database obtained from Uniprot (29 953 entries). Trypsin was specified as cleavage enzyme allowing up to 2 missed cleavages, 4 modifications per peptide and up to 5 charges. Mass error was set to 10 ppm for precursor ions and 0.1 Da for fragment ions. Oxidation on methionine, carbamidomethyl on cysteine were considered as variable modifications. False discovery rate (FDR) was assessed using Percolator and thresholds for protein, peptide and modification site were specified at 1%. The filtered Sequest HT output files for each peptide were grouped according to the protein from which they were derived and their individual number of peptide spectral matches (PSM) was taken as an indicator of protein abundance. We identified 5521 putative O-GlcNAcylated proteins and for each protein, abundance was evaluated from the addition of PSM of all bands (Table S9).
5.6.2 Gene ontology analysis
For the Click-iT® mass spectrometry, the clustering of the differential proteins was analysed using the ClusterProfiler R package (version 3.12.0) for Gene Ontology (GO) analysis. Only proteins with at least 2 unique peptides, 15% of coverage and for which the duplicates were equal to zero at the same period of development were retained. The results of the analysis include the two following aspects: biological processes (BP) and cellular components (CC). Only top 20 GO based on P-value were considered significantly enriched and were represented. The statistical analysis was performed with a multiple t-test with a Bonferroni correction.
5.6.3 Assay of HBP-related metabolites by liquid chromatography-mass spectrometry (LC-MS)
Cardiac and brain levels of glucose-6-phosphate (G6P), fructose-6-phosphate (F6P), fructose-1,6-bisphosphate (F1,6-P2), glutamine and UDP-GlcNAc were determined using a previously validated LC-MS method.17 MS signals were extracted using the software Agilent MassHunter Quantitative Analysis (B.07.00 version; Agilent Technologies; Santa Clara, USA).
5.7 Data and statistical analyses
Results were expressed as mean ± SEM of n different rats. Analyses of western blots were expressed in relation to the average of the protein quantification (stain free) and then reduced to the average of the control samples (D84 for D0/D12/D28/D84 analysis, D0 for D-1/D0 analysis and D28 for D28/D28F analysis). For results D0/D12/D28/D84, data were analysed by a Kruskal-Wallis test with uncorrected Dunn's test. For results D-1/D0 and D28/D28F, data were analysed by a Mann-Whitney test. A value of P < .05 was considered significant.
For LC-MS analyses of HBP-related metabolites, G6P, glutamine and UDP-GlcNAc were quantified using their respective isotope-labelled internal standards [1,2,3,4,5,6-13C6]-glucose-6-phosphate, [1,2,3,4,5-13C5, 1,2-12N2]-glutamine and [1,2-13C2]-UDP-GlcNAc respectively. F6P and F1,6-P2 were expressed as signal intensity ratio relative to the isotope labelled standard [1,2,3,4,5,6-13C6]-glucose-6-phosphate. All statistical calculations and graphs (except those performed with R software) were performed using GraphPad PRISM 7 software (7.00 version).
ACKNOWLEDGMENTS
The authors thank the IBISA core facility Therassay for its assistance and their technical support. JD, LBu, LBe are supported by grants from the Fonds National de la Recherche Scientifique et Médicale (FNRS), Belgium, and Action de Recherche Concertée de la Communauté Wallonie-Bruxelles, Belgium, and by WELBIO grant. JD is supported by the Fund for Scientific Research in Industry and Agriculture, Belgium. LBu is Postdoctoral Researcher and LBe is Research Director of FNRS, Belgium. GlcNAc inhibitors synthesis of this project was implemented by the IBISA core facility CHEM-Symbiose, as part of the Biogenouest network, devoted to the synthesis of molecules with biological interest.
CONFLICT OF INTEREST
The authors declare that they have no known competing financial interests or personal relationships that could have appeared to influence the work reported in this paper.
AUTHOR CONTRIBUTIONS
TD, MD, JD, AP, LBu, AE, DV, BB, AT, JL, MR, EBC and JM performed the experiments and analysis. Click-it chemistry experimental procedures have been established by JD, LBu and LBe. LC-MS/MS was performed by JD and DV. TD, MD and BL conceived the project and designed the experiments. BL, LBe, TI, JM, EBC, JD, LBu, MDW, BR, CG, DV, AKO, YB and CDR reread and corrected the paper before submission.
Open Research
DATA AVAILABILITY STATEMENT
The data that support the findings of this study are available from the corresponding author upon reasonable request.


