Dietary phosphorus requirement of coho salmon (Oncorhynchus kisutch) alevins cultured in freshwater
Funding information
Shandong Provincial Key Research and Development Programs (Major Scientific and Technological Innovation Projects, MSTIP), Grant/Award Numbers: 2018CXGC0102 and 2019JZZY020710; Scientific and Technologic Development Program of Weifang, Grant/Award Number: 2019ZJ1046; Innovation-driven Development Special Project of Guangxi Science and Technology Major Project, Grant/Award Number: AA17204044
Abstract
A 12-week feeding trial was conducted to evaluate the effects of dietary phosphorus on growth performance, whole-body composition, liver phosphorus metabolism enzyme and digestive enzyme activities of coho salmon (Oncorhynchus kisutch) alevins. Six experimental diets were formulated with graded phosphorus levels of 0.3%, 0.59%, 0.73%, 0.85%, 1.05% and 1.19% respectively. Each diet was fed to triplicate groups of fish (0.36 ± 0.01 g), which were randomly assigned to 18 tanks (water volume 240-L), with each stocked initially with 50 fish. The specific growth rate (SGR), whole-body and vertebrae phosphorus contents, lipase and amylase were significantly improved with dietary phosphorus level increased from 0.3% to 0.85% (p < .05). The feed conversion rate, alkaline phosphatase and creatine kinase activities were significantly decreased with dietary phosphorus level increased from 0.3% to 0.73% (p < .05). The hepatosomatic index, intestosomatic index, condition factor and whole-body moisture, crude protein, crude lipid and ash were not affected by dietary treatments (p > .05). More accurate information on dietary phosphorus requirement was obtained by cubic curve regression analysis of SGR, whole-body and vertebrae phosphorus contents, which indicated that phosphorus dietary requirement levels for coho salmon alevins were 0.95%, 1.06% and 1.11% respectively.
1 INTRODUCTION
Minerals are frequently found as salts with either inorganic elements or organic compounds, and their sufficient amount availability in dietaries of fishes is essential for optimal growth of fishes (Zafar and Khan, 2018). Phosphorus, an important mineral nutrient, is indispensable for fish growth, skeletal development, lipid and carbohydrate metabolism (Lall & Lewis-McCrea, 2007). Farmed fishes gained phosphorus mainly from the diets, because of the low phosphorus salt contents in water (Lall, 2003). The dietary phosphorus deficiency or suboptimal supply affected normal growth and mineralization in fishes (Shen et al., 2016; Xie et al., 2017; Yao et al., 2014; Yoon et al., 2015; Yuan et al., 2011). During the experimental feeding period in Atlantic salmon (Salmo salar), the reduced bone mineralization and a greater prevalence of vertebral deformities was caused by the low phosphorus diet, compared to the medium and high phosphorus diets (Fraser et al., 2019).
There have been some studies on the phosphorus requirement of fishes to date, which showed that fish demand for optimal phosphorus level was ranged from 0.51% to 0.96%, thus indicated that different fishes have different dietary phosphorus requirements (Araújo etal., 2017; Liang et al., 2012; Wang et al., 2017). Furthermore, excessive phosphorus inflowed into water bodies would stimulates algal bloom or eutrophication, which is negative for aquatic ecosystems (Chowdhury et al., 2017). Therefore, taking the economic and environmental costs into consideration, it is necessary to estimate dietary phosphorus requirements in farmed fishes.
Oncorhynchus kisutch, commonly known as coho salmon, has a high content of highly unsaturated fat acids (HUFAs), especially omega-3 HUFAs which benefits human being a lot, such as reducing the risk of heart disease and the progression of Alzheimer's disease, and enhancing brain development (Ma et al., 2007). Coho salmon, belonging to typical cold water fish, is an important aquaculture pacific salmon species, and its farming is gradually expanded in China in recent years. In order to improve its culture, there is an urgent need to develop nutritionally balanced diets based on phosphorus requirement. The present experiment used Ca(H2PO4)2·H2O as the resource of phosphorus and thereafter estimated the optimal dietary requirement of phosphorus based on the effect of phosphorus levels on growth performance, whole-body composition, phosphorus contents of whole-body and vertebrae, and liver phosphorus metabolism enzyme and digestive enzyme activities in coho salmon alevins.
2 MATERIALS AND METHODS
2.1 Experimental diets
The formulation and proximate composition of experimental diets are presented in Table 1. Six experimental diets (contained about 41.9% crude protein and 10.1% crude lipid) were formulated to contain graded levels (0.3%, 0.59%, 0.73%, 0.85%, 1.05% and 1.19%) of dietary phosphorus. Phosphorus was supplemented in the form of monocalcium phosphate (MCP, Ca(H2PO4)2·H2O) in the experimental diets. The alevins were obtained and reared at one of the hatcheries in Shandong Collaborative Innovation Center of Coho Salmon Health Culture Engineering Technology, Linyi, China. A total of 900 alevins, each weighing approximately 0.36 ± 0.01 g, were randomly distributed to 18 white plastic tanks (80 × 60 × 60 cm, L × W × H, water volume 240-L). Each diet treatment contained triplicate tanks, with initial 50 fish per tank. The tanks were connected to a flow-through rearing system with continuous filtered underground fresh spring water. The alevins were fed four times daily (7:00, 10:30, 14:00 and 17:30) for 12 weeks. A method of overfeeding (15%–20% body weight) was used to feed alevins, if there was leftover material collection deduction. Water temperature was 16.0 ± 1.0°C; pH ranged from 7.1 to 7.5; dissolved oxygen was above 7.5 mg O2 L−1. The alevins were reared under natural light.
| Ingredients | Dietary P levels (%) | ||||||
|---|---|---|---|---|---|---|---|
| 0 | 0.3 | 0.5 | 0.7 | 0.9 | 1.1 | ||
| Casein1 | 400.0 | 400.0 | 400.0 | 400.0 | 400.0 | 400.0 | |
| Gelatine1 | 100.0 | 100.0 | 100.0 | 100.0 | 100.0 | 100.0 | |
| Dextrin1 | 160.0 | 160.0 | 160.0 | 160.0 | 160.0 | 160.0 | |
| α-Cellulose1 | 95.0 | 95.0 | 95.0 | 95.0 | 95.0 | 95.0 | |
| Fish oil1 | 75.0 | 75.0 | 75.0 | 75.0 | 75.0 | 75.0 | |
| Soybean oil1 | 75.0 | 75.0 | 75.0 | 75.0 | 75.0 | 75.0 | |
| Mineral premix, copper-free2 | 60.0 | 60.0 | 60.0 | 60.0 | 60.0 | 60.0 | |
| Vitamin premix3 | 10.0 | 10.0 | 10.0 | 10.0 | 10.0 | 10.0 | |
| L-Arg | 10.0 | 10.0 | 10.0 | 10.0 | 10.0 | 10.0 | |
| Ethoxyquin | 6.0 | 6.0 | 6.0 | 6.0 | 6.0 | 6.0 | |
| DL-Met | 5.0 | 5.0 | 5.0 | 5.0 | 5.0 | 5.0 | |
| Choline chloride | 3.0 | 3.0 | 3.0 | 3.0 | 3.0 | 3.0 | |
| Ascorbic acid phosphate | 0.5 | 0.5 | 0.5 | 0.5 | 0.5 | 0.5 | |
| Glycine betaine | 0.5 | 0.5 | 0.5 | 0.5 | 0.5 | 0.5 | |
| Ca(H2PO4)2·H2O (mg kg−1) | 0 | 1069.0 | 9373.0 | 17678.0 | 25983.0 | 34287.0 | |
| KH2PO4(mg kg−1) | 0 | 12104.0 | 12104.0 | 12104.0 | 12104.0 | 12104.0 | |
| Proximate composition | |||||||
| Crude protein (%) | 42.76 | 42.90 | 42.71 | 42.90 | 42.80 | 42.78 | |
| Crude lipid (%) | 10.21 | 10.06 | 10.31 | 10.13 | 10.22 | 10.41 | |
| Ash (%) | 5.01 | 5.18 | 5.29 | 5.48 | 5.50 | 5.63 | |
| Moisture (%) | 7.39 | 7.36 | 7.34 | 7.50 | 7.44 | 7.43 | |
| Phosphorus (%) | 0.30 | 0.59 | 0.73 | 0.85 | 1.05 | 1.19 | |
- 1 Provided by Shandong Conqueren Marine Technology Co., Ltd., Weifang, China.
- 2 Composition (g kg–1 mineral premix): AlK(SO4)2·12H2O, 123.7; CuSO4.5H2O, 32.0; CoCl2·6H2O,49.0; FeSO4.7H2O, 707.0; MgSO4.7H2O, 4317.0; MnSO4.4H2O, 31.0; KI, 5.3; NaCl, 4934.0; Na2SeO3.H2O, 3.4; ZnSO4.7H2O,177.0.
- 3 Composition (IU or g kg−1 vitamin premix): retinal palmitate, 10,000 IU; cholecalciferol, 4,000 IU; α-tocopherol, 75.0 IU; menadione, 22.0 g; thiamine-HCl, 40.0 g; riboflavin, 30.0 g; D-calcium pantothenate, 150.0 g; pyridoxine-HCl, 20.0 g; meso-inositol, 500.0 g; D-biotin, 1.0 g; folic acid, 15.0 g; ascorbic acid, 200.0 g; niacin, 300.0 g; cyanocobalamin, 0.3 g.
2.2 Sampling procedures
At the end of the 12-week feeding trial, alevins in each replicate tank were starved for 24 hours, following counted the total number, the mean body weight of alevins in each replicate tank were individually measured and counted. Sixteen fish from each tank were picked randomly and stored in −20°C for the analysis of whole-body composition and final whole-body phosphorus contents. Other eighteen fish from each tank were randomly sampled and euthanized (MS-222, 20 mg/L), in which nine were rapidly dissected to obtain the liver and vertebrae, and then stored at −80°C. The remaining anaesthetic fish from each tank were used to measure fish body lengths and weights and then dissected to get the liver, intestine for morphological indexes.
2.3 Analytical methods
2.3.1 Growth performance
The calculation formulae for the parameters mentioned above are as follows:
Survival rate (%) = 100 × (final body weight)/(initial body weight).
Specific growth rate (SGR, % day-1) = 100 × [ln (final body weight) – ln (initial body weight)]/days
Feed conversion ratio (FCR, %) = total feed intake [g]/(final body weight [g] - initial body weight [g])
Condition factor (CF, g/cm3) = 100 × (body weight/body length3).
Hepatosomatic index (HSI, %) = 100 × (liver weight/body weight).
Intestinal somatic index (ISI, %) = 100 × (intestinal weight/body weight).
2.3.2 Proximate composition analysis
The moisture, protein, lipid and ash contents of diets and the whole-body were determined following standard methods (AOAC (Association of Official Analytical Chemists), 1995). Moisture content of diet and fish was determined by drying samples at 105 °C until weight constant. Crude protein was measured following the Kjeldahl method (Kjeltec 8400; Foss Tecator, Sweden). Crude lipid was measured following the ether-extraction method (2043 Soxhlet Avanti; Foss Tecator, Hoganas Sweden). Ash was determined by a muffle furnace at 550°C for 24 hours. Phosphorus contents were analysed using inductivity-coupled plasma mass spectrometry (ICP-OES Optima 5300DV, Perkin Elmer Corporation).
2.3.3 Liver ALP, CK, LPS and AMS activities
The fish liver samples (one homogenates per three livers) were homogenized to make a 10% liver homogenate in cold 0.9% Tris–HCl buffer by a glass tissue homogenizer and centrifuged for 15 min at 2500 g, and the liver homogenate supernatants were collected and stored at −80°C, which were used to determine the activities of alkaline phosphatase (ALP) (Bessey et al., 1946), creatine kinase (CK) (Zhao et al., 2015), amylase (AMS) (Robyt & Whelan, 1968) and lipase (LPS) (Furne et al., 2005).
2.3.4 Statistical analyses
All statistical analyses were performed with SPSS 25.0 (SPSS, Chicago, IL, USA). Results were presented as the means ±SD. Data were assessed for statistically significant observations using one-way analysis of variance (ANOVA), and the significant difference was set as p <.05. When overall differences were significant, Duncan's test was used to compare the means between individual treatments.
3 RESULTS
3.1 Growth performance and feed utilization
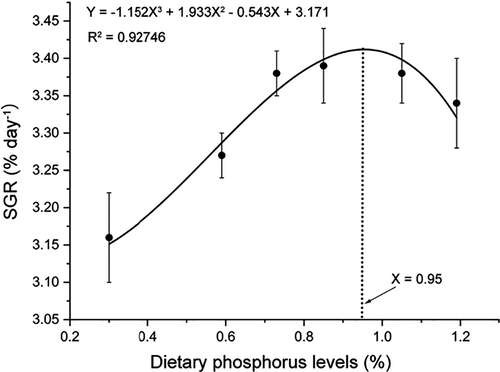
All alevins fed diets with different phosphorus levels survived throughout the feeding trial (Table 2). The final body weight, SGR and FCR were all affected significantly by the graded dietary phosphorus levels (p < .05). The final body weight and SGR were all increased with phosphorus level up to 0.85%, beyond which the significance maintained (Table 2). FCR was decreased with phosphorus level up to 0.73%, maintained the significance until 1.05% and then increased at 1.19% (Table 2). More accurate information on dietary phosphorus requirement was obtained by subjecting the data against various dietary phosphorus levels to cubic curve regression analysis, which yielded the optimal phosphorus requirement of SGR at 0.95% (YSGR = −1.152X3 + 1.933X2-0.543X + 3.171, R2 = 0.92746) (Figure 1). The CF, HSI and ISI were not significantly changed in fish fed diets with different phosphorus levels (p > .05) (Table 2).
| Dietary P levels (%) | 0.30 | 0.59 | 0.73 | 0.85 | 1.05 | 1.19 | P value |
|---|---|---|---|---|---|---|---|
| Survival rate (%) | 100 | 100 | 100 | 100 | 100 | 100 | - |
| Initial body weight (g) | 0.36 ± 0.01 | 0.36 ± 0.01 | 0.35 ± 0.01 | 0.36 ± 0.01 | 0.35 ± 0.01 | 0.36 ± 0.01 | - |
| Final body weight (g) | 5.13 ± 0.24a | 5.54 ± 0.11ab | 6.07 ± 0.14b | 6.18 ± 0.21b | 6.03 ± 0.19b | 6.03 ± 0.34b | .043 |
| SGR (% day−1) | 3.16 ± 0.06a | 3.27 ± 0.03ab | 3.38 ± 0.03b | 3.39 ± 0.05b | 3.38 ± 0.04b | 3.34 ± 0.06b | .025 |
| CF | 1.22 ± 0.16 | 1.22 ± 0.05 | 1.11 ± 0.06 | 0.89 ± 0.03 | 1.08 ± 0.26 | 1.06 ± 0.07 | .570 |
| HSI | 1.49 ± 0.18 | 1.39 ± 0.06 | 1.26 ± 0.27 | 1.00 ± 0.09 | 1.07 ± 0.10 | 1.26 ± 0.70 | .513 |
| ISI | 1.38 ± 0.16 | 1.36 ± 0.50 | 1.35 ± 0.10 | 1.24 ± 0.02 | 0.94 ± 0.13 | 1.01 ± 0.12 | .479 |
| FCR | 1.12 ± 0.06b | 1.01 ± 0.03ab | 0.92 ± 0.03a | 0.90 ± 0.10a | 0.91 ± 0.03a | 0.95 ± 0.05ab | .012 |
Note
- Values are means, with pooled SD (n = 3). Means in the same column with different superscript letters are significantly different (p <.05). Abbreviation: CF, Condition factor; FCR, feed conversion ratio; HSI, hepatosomatic index; ISI, intestinal somatic index; SGR, specific growth rate.
3.2 Whole-body composition and vertebrae phosphorus content
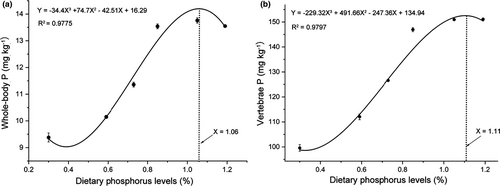
The proximate composition of whole-body and vertebrae phosphorus content of alevins fed diets with varying phosphorus levels were given in Table 3. The contents of moisture, crude protein, crude lipid and ash were not significantly changed (p > .05), while the phosphorus contents of whole-body and vertebrae were significantly changed (p < .05) in fish fed diets with different phosphorus levels. Phosphorus contents in both whole-body and vertebrae were continuously increased with dietary phosphorus level up to 0.85% (p < .05), beyond which, no further significant increase of whole-body phosphorus content was observed, while the vertebrae phosphorus content continuously increased significantly until the dietary phosphorus level up to 1.05% and maintained the significance at 1.19% (Table 3). Based on the phosphorus contents of whole-body and vertebrae, the dietary phosphorus levels for maintaining maximum phosphorus storages obtained by cubic curve regression analysis were 1.06% and 1.11% respectively (Ywhole-body p = −34.4X3 + 74.7 X2 - 42.51X + 16.29, R2 = 0.9775; Yvertebrae p = −229.32X3 + 491.66X2 - 247.36X + 134.94, R2 = 0.9797) (Figure 2A, B).
| Dietary phosphorus levels (%) | 0.30 | 0.59 | 0.73 | 0.85 | 1.05 | 1.19 | P value |
|---|---|---|---|---|---|---|---|
| Whole-body Composition (mg kg−1) | |||||||
| Moisture (%) | 75.67 ± 0.16 | 75.53 ± 0.07 | 75.38 ± 0.16 | 75.67 ± 0.28 | 75.62 ± 0.12 | 75.47 ± 0.43 | 0.925 |
| Crude protein (%) | 14.28 ± 0.12 | 14.47 ± 0.16 | 14.47 ± 0.19 | 14.77 ± 0.13 | 14.57 ± 0.28 | 14.68 ± 0.04 | 0.472 |
| Crude lipid (%) | 4.87 ± 0.36 | 5.66 ± 0.43 | 4.63 ± 0.24 | 4.54 ± 0.31 | 4.76 ± 0.52 | 5.17 ± 0.18 | 0.365 |
| Ash (%) | 3.08 ± 0.03 | 3.18 ± 0.01 | 3.13 ± 0.07 | 3.15 ± 0.13 | 3.19 ± 0.01 | 3.18 ± 0.07 | 0.841 |
| Phosphorus | 9.38 ± 0.17a | 10.15 ± 0.06b | 11.36 ± 0.09c | 13.54 ± 0.09d | 13.76 ± 0.10d | 13.55 ± 0.04d | < 0.001 |
| Vertebrae phosphorus (mg kg−1) | |||||||
| Phosphorus | 99.58 ± 1.36a | 112.06 ± 1.14b | 126.61 ± 0.31c | 146.95 ± 0.83d | 150.97 ± 0.32e | 151.11 ± 0.50e | < 0.001 |
Note
- Values are means, with pooled SD (n = 3). Means in the same column with different superscript letters are significantly different (p < .05). Abbreviation: P, phosphorus.
3.3 Liver ALP, CK, LPS and AMS activities
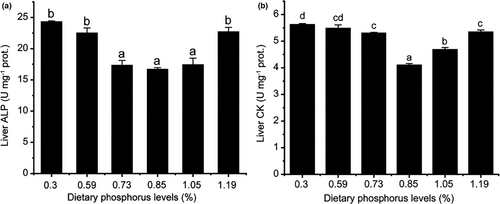
The liver ALP and CK activities were significantly affected by different phosphorus levels (p < .05) (Figure 3A, B). The two enzyme activities were significantly decreased and then increased with increasing dietary phosphorus levels (p < .05). What different was that the lowest activity of ALP reached at 0.73% of dietary phosphorus level, maintained the significance from 0.73% to 1.05% and then increased at 1.19% (Figure 3A), while the lowest activity of CK reached at 0.85% of dietary phosphorus level, beyond which the activity increased significantly (Figure 3B).
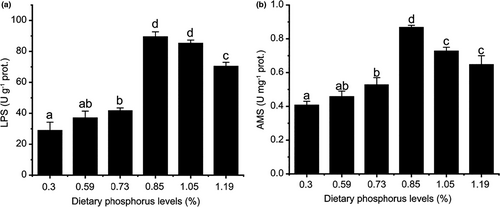
The activities of LPS and AMS were also significantly increased and then decreased with increasing dietary phosphorus levels. The highest activity of LPS and AMS was both reached at 0.85% of dietary phosphorus level (Figure 4). What different was that the activity of LPS maintained significance at 1.05% and decreased at 1.19% (Figure 4A). AMS, however, decreased at 1.05% and then maintained the significance at 1.19% (Figure 4B).
4 DISCUSSION
The content of dietary phosphorus affected many aspects in most studied farmed fishes (Chen et al., 2017; Schamber et al., 2014; Yang et al., 2021). The present results clearly showed that the optimal dietary phosphorus level significantly improved the growth performance and feed utilization in coho salmon alevins (Table 2, Figure 1). Therefore, finding the optimal phosphorus level is necessary for coho salmon alevins. The results showed that coho salmon alevins fed low phosphorus level dietary had low SPR and poor FCR (Table 2, Figure 1). Similar results were also found in many fishes, such as juvenile yellow catfish (Pelteobagrus fulvidraco), large Nile tilapia (Oreochromis niloticus) and stinging catfish (Heteropneustes fossilis) fingerlings (Schamber et al., 2014; Tang et al., 2012; Zafar & Khan, 2018), which suggested that insufficient phosphorus supply might led to inadequate utilization of amino acids derived from dietary protein to build up body protein of fish, thus more dietary protein shifted to the trans-deamination pathway and resulted in poor fish growth (Schamber et al., 2014). Excessive dietary phosphorus level, however, also inhibited the fish growth, for excessive phosphorus might leading to competitive inhibition of magnesium, zinc, iron and other cations during intestinal absorption (Roy & Lall, 2003). Based on the cubic curve regression analysis, the highest SGR was obtained with the dietary phosphorus level at 0.95%, when dietary phosphorus level further increased to 1.05% and 1.19%, the special growth rate not changed significantly (p < .05), which indicated that coho salmon alevins can sustain the dietary phosphorus level at 1.19% (Table 2).
Whole-body moisture, ash, crude protein and crude lipid of coho salmon alevins were not significantly changed with different dietary treatments after the feeding trail (p > .05), which was similar with the study of rainbow trout (Oncorhynchus mykiss) (Bureau & Cho, 1999). However, in many investigated fishes, such as juvenile Atlantic salmon, crucian carp (Carassius auratus), stinging catfish and juvenile blunt snout bream (Megalobrama amblycephala), dietary phosphorus levels affected all components of whole-body composition, in detail, the crude lipid content was significantly decreased, the crude protein, moisture and ash were significantly increased with the dietary phosphorus increased to a certain level (Burke et al., 2010; Chen, et al., 2016; Yang et al., 2021; Zafar & Khan, 2018). In addition, the crude lipid and ash were all significantly changed, but the whole-body moisture and crude protein were not affected by different dietary phosphorus levels in European sea bass (Dicentrarchus labrax L.), juvenile yellow catfish and large Nile tilapia (Oliva-Teles & Pimentel-Rodrigues, 2004; Schamber et al., 2014; Tang et al., 2012). Based on the previous studies, it was suggested that the whole-body moisture, ash, crude protein and crude lipid of different fishes might have different sensitivities to dietary phosphorus treatments.
Dietary phosphorus levels greatly affected both whole-body and vertebrae phosphorus contents in many farmed fishes (Mai et al., 2006; Ogino., C., & Takeda, H., 1976; Shao et al., 2008). The whole-body or vertebrae phosphorus contents had been commonly used as indicators of dietary phosphorus status in fish nutrition studies (Hardy et al., 1993; Luo et al., 2010; Mai et al., 2006; Shao et al., 2008). In the present study, phosphorus levels had a very significant effect on whole-body and vertebrae phosphorus contents of coho salmon alevins (Table 3, Figure 2). Cubic curve regression analysis indicated that the maximum whole-body and vertebrae phosphorus contents obtained by dietary phosphorus levels up to 1.06% and 1.11%, respectively, which were higher than the dietary phosphorus requirement for maximum SGR (Figures 1, 2B). Similar findings were also observed in large yellow croaker (Pseudosciaena crocea R.) (Mai et al., 2006), juvenile Japanese seabass (Zhang et al., 2006), black sea bream (Sparus macrocephalus) (Shao et al., 2008) and so on. The dietary phosphorus requirement level for bone mineralization was usually higher than that for maximal SGR (Eya & Lovell, 1997; Ketaren et al., 1993), at least over relatively short-term determination periods (Åsgård & Shearer, 1997; Rodehutscord, 1996), which suggested that vertebrae had a capacity to buffer changes in phosphorus supply, and the phosphorus deposition need not be at its maximum for the highest SGR (Mai et al., 2006).
The absorption of nutrients such as lipid, glucose, calcium and inorganic phosphate depends on ALP (Villanueva et al., 1997). Due to the importance of ALP, it is necessary to estimate its activity in alevins fed diets with different phosphorus levels. In the present study, liver ALP activity decreased with dietary phosphorus levels up to 0.73% and then increased at the phosphorus level of 1.19% (Figure 3A). The result was agreed with the plasma ALP activity in juvenile black seabream (Shao et al., 2008). Similarly, a low phosphorus intake caused increased plasma ALP activity in red sea bream (Chrysophrys major) (Sakamoto & Yone, 1980). On the contrary, plasma ALP activity in rainbow trout was not significantly affected when treated with sufficient and deficient phosphorus diets (Shearer & Hardy, 1987). In Japanese seabass (Lateolabrax japonicus), ALP activity was increased with the increase of dietary phosphorus levels (Zhang et al., 2006). Based on previous studies, the activity of ALP was influenced by many factors, such as water chemistry (Bowser et al., 1989), feeding intake (Sauer & Haider, 1979), temperature (Lie et al., 1988; Sakaguchi & Hamaguchi, 1979; Sauer & Haider, 1977) and fish life stage (Johnston et al., 1994).
The digestive enzyme activities were suggested as nutrient digestibility and utilization indicators (Deng et al., 2010). In the present study, liver LPS and AMS activities were significantly affected by different dietary phosphorus levels. The activities of LPS and AMS increased with dietary phosphorus level up to 0.85% and then all decreased at 1.19% (Figure 4A, B), which suggested that phosphorus could improve the digestive ability of coho salmon, while excessive phosphorus would decrease the digestive ability to some extent.
5 CONCLUSION
The present study showed that different dietary phosphorus levels significantly affected the SGR, whole-body and vertebrae phosphorus contents, liver metabolism (ALP and CK) and digestive enzyme (LPS and AMS) activities of coho salmon alevins. Based on SGR, whole-body and vertebrae phosphorus contents, the dietary phosphorus requirements of coho salmon alevins were estimated to be 0.95%, 1.06% and 1.19% respectively. Taking the physiologic, economics and environment into consideration, it was suggested that the dietary phosphorus level of 0.95% is optimal for coho salmon alevins to gain the best growth, as well as the least economic and environmental costs.
ACKNOWLEDGEMENTS
The study was supported by the Shandong Provincial Key Research and Development Programs (Major Scientific and Technological Innovation Projects, MSTIP), Grant/Award Numbers: 2018CXGC0102 and 2019JZZY020710; Scientific and Technologic Development Program of Weifang, Grant/Award Number: 2019ZJ1046; Innovation-driven Development Special Project of Guangxi Science and Technology Major Project, Grant/Award Number: AA17204044.
CONFLICT OF INTEREST
The authors declare that there is no conflicts of interest.
ETHICAL APPROVAL
The present study was carried out strictly according to the recommendations in the Guide for the Use of Experimental Animals of the Weifang University.
Open Research
Data Availability Statement
All the data in the article are available from the corresponding author upon reasonable request.


