Replacement of living microalgae with a dried alfalfa chloroplast product in diets for the Brown mussel (Perna perna), Yellow clam (Mesodesma mactroides) and Manila clam (Venerupis philippinarum)
Abstract
Owing to its high nutritional value and widespread availability, the legume alfalfa Medicago sativa (Linnaeus, 1753) is a possible feed for aquatic animals. In this study, a dried alfalfa chloroplast (DAC) product supplied by Virentia Inc., Quebec, Canada, was evaluated as a partial or total replacement for live microalgae (LM) in diets for juveniles of Perna perna and the Mesodesma mactroides—two species with high aquaculture potential in Brazil. In addition, trials were conducted with Venerupis philippinarum, a species commonly used in global aquaculture. Nine diets containing different ratios (based on dry weight) of live microalgae (Chaetoceros neogracile and/or Isochrysis galbana) and DAC were evaluated. With all three bivalve species, additions of DAC to partial microalgal rations increased final dry and organic weights, compared with those provided with partial algal rations alone. M. macrooides and P. perna appeared to utilize DAC to a greater extent than V. philippinarum as indicated by the higher final organic weights obtained by these two species when larger fractions of LM were substituted with DAC. Overall, the results of this study indicate that DAC supplements can be useful in supporting mussel and clam tissue growth when algal feeds are limited or unavailable.
1 INTRODUCTION
Mollusk culture holds great potential for delivering positive environmental impacts and nutritional benefits for humans. About 17.7 million tons of molluscs (34.6 billion USD) are produced annually, consisting of mostly clams, mussels and oysters (FAO, 2020). In Brazil, the state of Santa Catarina is responsible for 98.1% of the national mariculture production of bivalve molluscs, with 20.9 thousand tons (live weight) produced in 2017 (IBGE, 2018). The Brown mussel Perna perna (Linneaus, 1758) accounts for over half of the country's production with 11.9 thousand tons harvested in 2017, generating revenues of nearly 10 million USD (EPAGRI, 2018).
Recent trends in bivalve aquaculture in Brazil are focused on more sustainable practices, which include diversifying the number of farmed species. Among new potential species for mollusc culture, the clam Mesodesma mactroides (Reeve, 1854; syn. Amarilladesma mactroides), commonly called the Yellow clam, has received recent attention (Proverbio, 2017; Santos et al., 2020; Santos, Bernardes, Ramirez, Ramos, et al., 2020). Mesodesma mactroides is important in Brazil, Uruguay and Argentina as a historical recreational fishery with associated socio-economic value (Brazeiro & Defeo, 1999; Defeo et al., 1992; Herrmann et al., 2011; Ihering, 1897; Shoeman et al., 2013). Preliminary studies on the potential aquaculture value of this species have shown promising results (Santos, Bernardes, Ramirez, Gomes, et al., 2020; Santos, Bernardes, Ramirez, Ramos, et al., 2020).
The Manila clam Venerupis philippinarum (Adams & Reeve, 1850) is one of the most cultured bivalve species in the world, with a production of 4.1 million tons in 2018 (FAO, 2020). In 2014, Manila clams represented ~25% of the total worldwide mollusc production (Cordero et al., 2017). They show potential for increased aquaculture production and have high potential for use in polyculture systems (FAO, 2018); however, improved hatchery and juvenile rearing efficiencies would improve economic returns.
Success of bivalve mollusc culture greatly depends on efficient hatcheries and nurseries (Helm et al., 2004), with feed being of critical importance. Phytoplankton is the principal food of bivalves molluscs; however, feeding behaviour and the nutrition of bivalve species can be affected by their infaunal or epifaunal mode of life (Bayne, 2017; Hawkins et al., 1980; Prins & Smaal, 1989; Prins et al., 1991; Smaal et al., 1997). Infaunal species show greater capacity for particle selection when compared to epifauna species (Bacon et al., 1998). The most common algal diet for hatchery and nursery bivalve culture is based on a multi-species mix of live microalgae that meet the nutritional requirements of larvae and juvenile stages (Brown et al., 1997); however, the high cost and technical effort required for microalgal production are often obstacles for bivalve seed production (Muller-Feuga et al., 2003).
Although several studies have examined supplementation (Langdon & Waldock, 1981; Sühnel et al., 2012) or replacement (Adams et al., 2013; Langdon & Önal, 1999; Pérez-Camacho et al., 1998; Sühnel et al., 2014, 2015) of live microalgae in diets for bivalve molluscs, there is still a need for less expensive alternative feeds (Luzardo-Alvarez et al., 2010). Total or partial replacement of live microalgae by a low-cost alternative food source may decrease hatchery and nursery production costs, resulting in more profitable commercial operations.
Due to its high nutritional value (Fiorentini & Galoppini, 1981) and availability, the legume plant alfalfa Medicago sativa (Linnaeus, 1753) is a potential alternative for feeding aquacultured animals. This plant is a widely farmed crop and has a high protein content with a balanced amino acid profile, as well as containing vitamins and carotenoids (Vhanalakar, & Muley, 2015).
Promoted as a high protein-containing ingredient, alfalfa has already been tested as a component in fish feed. For instance, Ali et al. (2003) showed that inclusion of up to 5% alfalfa meal could be used in fry diets of the tilapia Oreochromis niloticus without any performance loss. Olvera-Novoa et al. (1990) reported alfalfa could replace up to 35% of dietary fish meal protein without adversely affecting growth of fingerling Oreochromis mossambicus. Despite these findings, very little has been reported on the effects of feeding molluscs on alfalfa products.
In the present study, we report the effects of partial and total replacements of a live microalgae diet by a dried alfalfa chloroplast concentrate (Virentia Inc.) on the growth of juvenile mussels (P. perna) and clams (M. mactroides and V. philippinarum).
2 MATERIALS AND METHODS
2.1 Origin of experimental animals
For this study, juveniles of P. perna were acquired from Daniela Beach, Florianópolis, Santa Catarina (27°26′37.2″S and 48°31′26.3″W) where they were harvested by local fishermen. Juveniles of M. mactroides were produced in the Laboratory of Marine Mollusks (LMM) of the Federal University of Santa Catarina, following the method of Santos, Bernardes, Ramirez, Gomes, et al. (2020). The initial mean shell heights of the juvenile P. perna and M. mactroides utilized in this study were 5.5 ± 2.0 and 3.5 ± 0.5 mm (n = 15), respectively, and their wet weights were 914 ± 4 and 335 ± 3 mg (n = 405) respectively. Manila clam (V. philippinarum) juveniles were provided by Taylor Shellfish (Kona, HI) and were 0.6–1 mm in shell height upon receipt.
2.2 Preparation of the dried alfalfa chloroplast
Dried alfalfa chloroplast concentrate (DAC) was produced by Virentia Inc. (Québec, Canada) as follows: Alfalfa foliage was collected at the pre-flowering stage. The foliage was chopped and passed through a screw press to separate a wet solid phase from the chloroplast-containing juice. Care was taken to preserve intactness of the chloroplasts by operating the press under conditions that minimized shearing, pressure differentials and heating (PCT/CA2020/050507). The intact chloroplasts were separated by continuous-flow centrifugation and washed from the residual plant soluble material by tangential flow filtration. The washed chloroplast paste was then spray dried at low temperature. As temperature of the liquid or dried phases containing the chloroplasts was maintained below 48°C at all times during fractionation, enrichment and drying, the final dried alfalfa chloroplast product qualifies as raw. The production of DAC provides a fraction of intact chloroplasts having similar physical attributes to microalgae.
2.3 Experimental design and diets
Experimental non-algal supplements were based on inclusion of DAC at 25%, 50%, 75% and 100% replacement of a full ration of a live microalgal (LM) diet. Moreover, for each DAC replacement ration level, control groups were included with bivalves fed on partial algal rations alone, as well as a starved control group. In total, nine dietary treatments were tested with each bivalve species. Each treatment was assigned a code referring to the percent dry weight ratio of LM to DAC in the diet (Table 1).
| Treatment | % LM | % DAC |
|---|---|---|
| 100/00 | 100 | 00 |
| 75/00 | 75 | 00 |
| 50/00 | 50 | 00 |
| 25/00 | 25 | 00 |
| 00/100 | 00 | 100 |
| 25/75 | 25 | 75 |
| 50/50 | 50 | 50 |
| 75/25 | 75 | 25 |
| 00/00 | 00 | 00 |
Note
- Each treatment was assigned a code referring to the per cent dry weight ratio of live microalgae (LM) to dried alfalfa chloroplast (DAC) in the diet.
For Brown mussels and Yellow clams, we used the microalgae Isochrysis aff. galbana (ISO) for the algal component of the diets. A daily 100% ration of ISO was added at 100,000 cells mL−1 (100/00). For the 100% DAC treatment (00/100), the concentration of added alfalfa was adjusted to 2 mg L−1, which was equivalent to the dry organic weight of 100,000 cells of ISO ml−1 (Langdon & Önal, 1999). For Manila clams, we used an even mixture (1:1 by cell concentration) of Isochrysis galbana (Caribbean strain) and Chaetoceros gracilis (CG) fed at a total concentration of 50,000 cells ml−1. Likewise, the concentration of added alfalfa was adjusted to 1 mg L−1 for the 100% DAC treatment (00/100) in the Manila clam trial. In all trials, the other experimental diets were formulated as proportions of these quantities. DAC aliquots were weighed and stored in 2 ml hermetically sealed containers at 4°C for use over each 7-day experimental period. At the time of feeding, the DAC powder was hydrated and suspended with a known volume of seawater and fed to animals, according to the experimental treatment.
Feeding trials with Brown mussels and Yellow clams were conducted using plastic 15 L containers (the experimental unit EU). Seawater was filtered (1 µm) and ultraviolet-sterilized, at a salinity of 35 and average temperature of 18.8 ± 1.7°C. Manila clams were cultured in 5 L volumes of aerated, 1 µm filtered seawater obtained from Yaquina Bay, Oregon. Seawater temperature was maintained between 20 and 22°C. Culture water for all experiments was renewed every 48 h.
The nine dietary treatments were randomly assigned to containers and tested in triplicate (Table 1). Fifteen P. perna plus 15 M. mactroides or 20 V. philippinarum spat were randomly assigned to each EU. Experiments with P. perna and M. mactroides we conducted jointly by adding both species to the same EU. Juvenile P. perna were placed in the bottom of each EU and juvenile M. mactroides were held in 4.5 × 14 × 12 cm polyethylene terephthalate (PET) containers placed inside the EU, that were filled with 420 cm3 of beach sand previously sterilized by autoclaving at 120°C for 30 min. Manila clams were placed in PET petri dishes on the bottom of the 5 L containers to facilitate water changes. The experiment lasted for 21 days for Brown mussels and Yellow clams and 35 days for Manila clams.
At the end of the experimental period, juvenile survival in each EU was recorded by counting the remaining live animals. At the beginning of the experiments (T0) and at the end, mean live weight (LW), dry weight (DW) and organic weight (OW) of surviving animals from each EU were determined. For DW measurements, living juveniles from each EU were dried in an oven at 60°C for 48 h before weighing. After that, the dried juveniles were transferred to a muffle furnace at 450°C for 48 h, and ash weights (AW) determined. Finally, OW were calculated by subtracting AW from DW values for each sample. All group weight measurements were obtained by weighing the animal groups on a precision scale 0.001 g (JA3003N BioPrecisa or Sartorius Research) and individual weights were obtained by dividing group weights by the number of animals in each group.
2.4 Characterization of the DAC and LM
Size analysis of DAC particles was carried out by dispersing the particles in filtered seawater and examining the particles from digital images (Lecia DFC400 camera) taken using a microscope (Leica DM1000) with a ×40 objective lens. Images of the particles were analysed using Image Pro Premier (version 9.2) and Image J software (version 1.5i).
A 24-h particle settlement trial was conducted to determine: (1) the fraction of DAC particles in suspension that decrease over time as a result of settlement; (2) the change in mean particle size over time; and (3) differential losses of DAC between different containers that were either bubbled with an airstone (aerated system) or were not (static system). Six 1 L beakers were each filled with 1 L of 1 µm filtered seawater (~20°C, salinity of 34). Three of these beakers were vigorously bubbled with an airstone (aerated) while three of the beakers were not bubbled (static system). DAC was added at a concentration similar to that used as a full ration in the Manila clam feeding trial (1 mg organic weight L−1), which resulted in an initial particle concentration of ~50,000 cells L−1. This particle concentration was necessary to obtain measurable densities using a haemocytometer. Water samples were removed with a transfer pipette at 0, 0.25, 0.5, 1, 2, 8 and 24 h and placed in a centrifuge tube. Within an hour of collection, each tube was vortexed for 10 s and then a sample digitally photographed and measured using image analysis as previously described. Fatty acids and lipid class analyses of DAC and microalgae were carried out at the Marine Lipid Laboratory, Oregon State University. Lipid extraction was performed based on the method of Folch et al. (1956). Fatty acids were analysed using a HP 6890 gas chromatograph (GC) with flame ionization detection (FID) equipped with a 7683 autosampler and a ZB wax +GC column (Phenomenex) as described in Copeman et al., 2020). Peaks were identified using retention times based upon standards purchased from Supelco (37 component FAME, BAME, PUFA 1 and PUFA 3). Lipid classes were analysed using a Chromarod-Iatroscan system based on the methods developed by Lu et al. (2008).
Amino acid composition of DAC and microalgaes were carried out at the Amino Acid Laboratory, University of California, Davis (UC Davis). Total amino acid content and composition were analysed in accordance with AOAC (2005) official method 994.12. Samples of DAC were hydrolysed with hydrochloric acid (6N) in sealed ampoules (110°C, 24 h), dried with nitrogen gas. Samples containing free amino acids were dissolved in sulphosalicylic acid (3%), incubated overnight at room temperature, centrifuged and filtered (0.45 µm). Finally, the samples were adjusted to pH 2.2 and analysed using a Biochrom 30 Amino acid analyser (Biochrom US). Total protein was determined from the sum of the total amino acids (by dry matter concentration) excluding taurine. Tryptophan was not measured since it was destroyed by hydrolysis during the extraction process. Tryptophan is typically present at very low concentrations in alfalfa (~1.2% of total amino acids; Hojilla-Evangelista et al., 2017) and would have had a negligible effect on our estimate of DAC total protein content. Carbohydrate concentrations were estimated based on the total sample weight minus the sum of the measured protein, lipid and ash weights. Energy (kJ g−1) content was estimated from measured or estimated macronutrient concentrations and based on typical energetic values of protein (23.6 kJ g−1), lipid (39.5 kJ g−1) and carbohydrate (17.2 kJ g−1).
2.5 Data analysis
Data were tested for the basic assumptions for analysis of variance (ANOVA) using Shapiro–Wilk and Levene tests for normality of errors and homogeneity of variances, respectively. Growth and survival of juveniles were analysed using two-way ANOVA with the main effects ‘live microalgae ration’ (LM; levels: 0, 25, 50, 75, 100) and ‘dried alfalfa chloroplast’ (DAC; levels: 0, 1) and the interaction LM × DAC to evaluate the effect of DAC on bivalve performance. Also, one-way ANOVA were run to analyse the effects of treatments (Table 1) followed by comparison of treatment means using Tukey's test (p < .05). Particle concentration and mean cell diameters with respect to (ln)time were evaluated by regression analysis. Statistical analyses were performed using R Studio (R Studio Team, 2020) and JMP software (v15.1.0; SAS Institute Inc.).
3 RESULTS
3.1 DAC characteristics
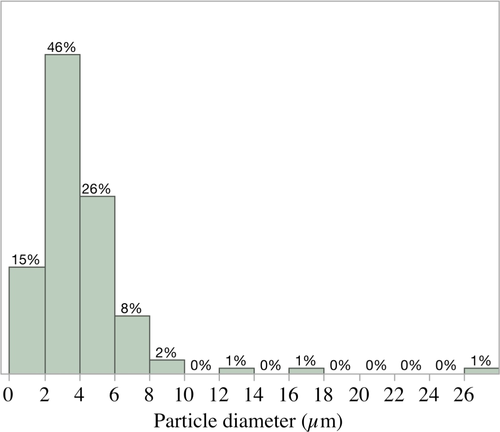
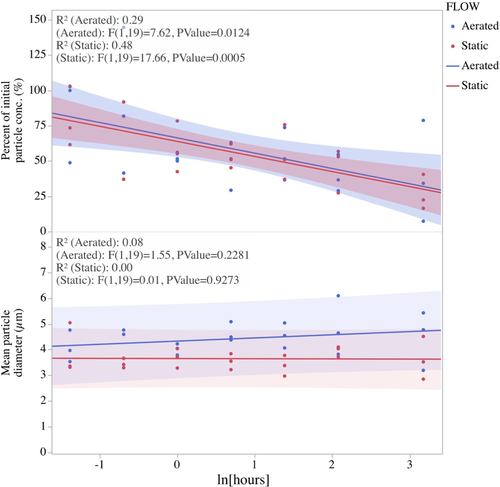
Particles of DAC varied from 0.54 to 27.0 µm with a mean particle diameter of 3.96 ± 2.81 µm (Figure 1). Ninety-seven per cent of the particles measured were <10 µm in diameter and should have been of a suitable size for ingestion by juveniles of the three species of bivalves used in the present study. When suspended in seawater, the concentrations of DAC declined significantly over time (multiple regression analysis, p = .0002) but were not impacted by the presence or absence of aeration (p = .777) and there was no significant interaction between time and aeration (p = .676) (Figure 2). The mean particle size of DAC suspended in water did not change over time (multiple regression analysis p = .671) but was significantly impacted by aeration (p < .0001) with particles in the aerated and static systems averaging 4.39 µm and 3.68 µm respectively. There was no interaction (p = .516) between aeration and time indicating that mean particle size did not significantly change over the duration of suspension due to the absence or presence of aeration.
Composition analysis indicated that the dry weight of DAC was made up of 20.7% lipid, 43.4% total amino acids (protein excluding taurine), 27.1% carbohydrates and 8% ash. The energy content of DAC particles was determined as 23.1 kJ g−1 (Table 2).
| Parameter | Value | Method of analysis |
|---|---|---|
| Total protein (%)* | 43.4 | Sum of total amino acids excluding taurine |
| Total carbohydrate (%) | 27.1 | Total sample weight – (protein weight +total lipid weight +ash weight) = estimated carbohydrate weight (expressed as a percent of total sample weight) |
| Total lipid (%) | 20.7 | Folch (1956) |
| Ash (%) | 8.0 | DAC samples were added to pre-weighed containers, weighed and then placed in a drying oven (65°C) for 72 h. The samples were again weighed to calculate dry weights and then placed in an oven (450°C) for 24 h to obtain ash weights. |
| Energy (kJ g−1) | 23.1 |
Estimated from measured or estimated macronutrient concentrations and based on typical energetic values of protein (23.6 kJ g−1), lipid (39.5 kJ g−1) and carbohydrate (17.2 kJ/g) |
- *Total protein was estimated from the sum of total amino acids which did not include tryptophan and was likely (1%–1.5%) higher than the reported estimate.
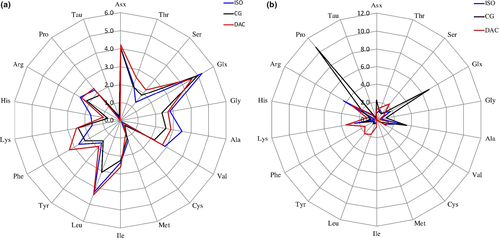
The total amino acid profile for DAC was similar to those of ISO and CG (Figure 3a) with high levels (>4%) of glutamic acid +glutamine, aspartic acid +asparagine and leucine and low levels (<1%) of cysteine and taurine. Levels of the essential amino acid histidine were low (0.99%) in DAC and CG but higher (1.69%) in ISO (Figure 3a). There were greater differences in the relative concentrations of the free amino acids with high levels of glutamic acid +glutamine ( 6.8%) and proline (10.7%) in CG compared with <2% glutamic acid and <1% proline in DAC and ISO (Figure 3b).
Lipid class compositions of DAC, ISO and CG (Table 3) indicated that DAC contained more lipid (20.7%) than either ISO or CG, 9.7 and 8.2%, respectively. More than 85% of the lipid of DAC and algal species was made up of phospholipids, with much lower proportions (<10%) of free fatty acids and triacylglycerols. Sterols and sterol esters were present at less than 2% of the total fatty acid content.
| Class composition | DAC | ISO | CG |
|---|---|---|---|
| Sterol esters | 0.00 | 0.13 | 0.19 |
| Triacylglycerols | 0.19 | 6.34 | 1.19 |
| Free fatty acids | 8.58 | 0.79 | 6.53 |
| Sterols | 1.11 | 0.45 | 2.17 |
| Phospholipids* | 86.14 | 92.28 | 89.93 |
| Alcohols | 3.99 | - | - |
| PUFA (% of total fatty acids) | 65.9 | 52.4 | 53.5 |
| Total lipids (% weight to weight on dry weight basis) | 20.7 | 9.7 | 8.2 |
- *Alcohols and phospholipids were pooled for ISO and CG but analysed separately for DAC.
Fatty acid profiles of DAC, ISO and CG (Table 4) show that 18:3n-3 (linolenic acid) was the predominant fatty acid (49%) in DAC with very low concentrations (<0.2%) or absence of n-3 and n-6 polyunsaturated fatty acids (PUFAs), such as arachidonic (20:4n-6), eicosapentaenoic (20:5n-3) and docosahexaenoic (22:6n-3) fatty acids. In contrast, 18:3n-3 was present at 14% in ISO and was not detected in CG, whereas 20:5n-3 was present at 23% in CG and 22:6n-3 was present at 12% in ISO. Arachadonic acid was present at low concentrations in CG (<2%) and not detected in ISO.
| Fatty acid | DAC | Isochrysis galbana | Chaetoceros gracilis |
|---|---|---|---|
| 14:0 (Myristic acid) | 0.23 ± 0.04 | 15.46 ± 0.49 | 9.19 ± 1.24 |
| 14:1 | 0.32 ± 0.11 | 0.66 ± 0.38 | 1.01 ± 0.01 |
| i15:0 | 1.30 ± 0.06 | 0.33 ± 0.01 | 0.53 ± 0.00 |
| 15:0 | 0.22 ± 0.02 | 0.23 ± 0.01 | 0.39 ± 0.03 |
| 15:1 | 0.00 ± 0.00 | 0.04 ± 0.05 | 0.12 ± 0.00 |
| i16:0 | 0.17 ± 0.20 | 0.20 ± 0.01 | 0.34 ± 0.00 |
| ai16:0 | 2.06 ± 0.30 | 1.27 ± 0.05 | 1.98 ± 0.02 |
| 16:0 | 14.17 ± 0.36 | 9.32 ± 0.30 | 4.76 ± .030 |
| 16:1n-11 | 7.62 ± 1.20 | 2.26 ± 0.13 | 3.45 ± 0.03 |
| 16:1n-7 (Palmitoleic acid) | 0.08 ± 0.09 | 5.47 ± 0.08 | 17.09 ± 0.79 |
| i17:0 | 2.31 ± 0.11 | 0.00 ± 0.00 | 2.05 ± 0.05 |
| ai17:0 | 0.03 ± 0.06 | 0.60 ± 0.03 | 0.50 ± 0.01 |
| 16:2n-4 | 0.00 ± 0.00 | 0.91 ± 0.01 | 9.05 ± 0.04 |
| 17:0 | 0.00 ± 0.00 | 0.00 ± 0.00 | 0.11 ± 0.00 |
| 16:3n-4 (Palmitolonolenic acid) | 0.00 ± 0.00 | 0.23 ± 0.00 | 15.75±0.66 |
| 17:1 | 0.00 ± 0.00 | 0.24 ± 0.01 | 2.68 ± 0.06 |
| 16:4n-1 | 0.00 ± 0.00 | 0.21 ± 0.00 | 0.93 ± 0.09 |
| 18:0 | 1.88 ± 0.02 | 0.40 ± 0.18 | 0.92 ± 0.00 |
| 18:1n-9 | 1.85 ± 0.39 | 8.52 ± 0.05 | 0.22 ± 0.01 |
| 18:1n-7 | 0.32 ± 0.06 | 1.63 ± 0.02 | 0.73 ± 0.04 |
| 18:2n-6 | 16.31 ± 0.59 | 5.38 ± 0.02 | 0.22 ± 0.00 |
| 18:3n-6 | 0.00 ± 0.00 | 0.25 ± 0.00 | 0.61 ± 0.04 |
| 18:3n-3 (a-linolenic acid) | 49.04 ± 3.62 | 13.64 ± 0.04 | 0.00 ± 0.00 |
| 18:4n-3 | 0.00 ± 0.00 | 17.37 ± 0.01 | 0.74 ± 0.02 |
| 20:0 | 0.44 ± 0.05 | 0.00±0.00 | 0.21 ± 0.00 |
| 20:1n-11 | 0.00 ± 0.00 | 0.96 ± 0.00 | 0.00 ± 0.00 |
| 20:1n-7 | 0.00 ± 0.00 | 0.00±0.00 | 0.17 ± 0.00 |
| 20:4n-6 (ARA) | 0.00 ± 0.00 | 0.00 ± 0.00 | 1.25 ± 0.06 |
| 20:5n-3 (EPA) | 0.00 ± 0.00 | 0.84 ± 0.00 | 23.20 ± 1.62 |
| 22:5n-6 | 0.00 ± 0.00 | 1.36 ± 0.05 | 0.00±0.00 |
| 22:4n-3 | 0.38 ± 0.17 | 0.00 ± 0.00 | 0.00 ± 0.00 |
| 24:0 | 1.07 ± 0.25 | 0.00 ± 0.00 | 0.06±0.08 |
| 22:6n-3 (DHA) | 0.13 ± 0.27 | 11.99 ± 0.49 | 1.58 ± 0.08 |
Note
- Microalgae samples were taken from cultures at Oregon State University which were used for the Manila clam trials. Fatty acids were not compared statistically due to low sample sizes of microalgae (n = 2). Fatty acids that represented less than 0.1% of the percent of total fatty acids in all three sources were not reported. ai, anti-iso and i, iso.
3.2 Survival and weight of Brown mussels Perna perna
Survival of P. perna after 21 days varied from 91.11 ± 7.69 to 100 ± 00%, with no significant difference among tested diets.
At the end of the 3-week experimental period (T21), LW (Figure 4) of juveniles varied between 67.20 ± 5.01 and 133.78 ± 16.37 mg among treatments. Mussel live weights were significantly impacted by the main effect ‘live microalgal ration’ (LM; p < .0001) but neither the main effect ‘DAC’ nor the interaction between LM and DAC were significant (p = .2111 and p = .2235 respectively) (Figure 4). The only difference in mussel LW was observed between the starved control 00/00 (67.20 ± 5.01 mg), that was lower than those of mussels from the 75/25 (133.78 ± 16.37 mg), 75/00 (132.66 ± 8.16 mg) and 100/00 (130.75 ± 16.41 mg) treatments.
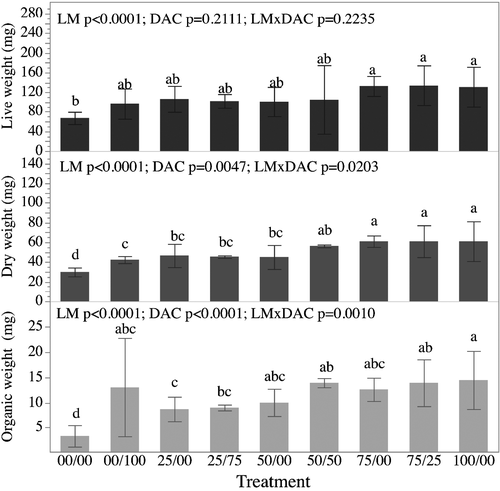
Final DW values ranged from 29.91 ± 1.82 to 61.03 ± 8.08 mg among treatments. Mussel DW were significantly impacted by the main effects LM and DAC (p < .0001 and p = .0047 respectively) with higher overall DWs observed in the treatments that received DAC when compared to those that did not receive DAC. There was also a significant interaction between LM and DAC (p = .0203) suggesting that the relationships between LM and DWs were impacted by the inclusion or exclusion of DAC (Figure 4). DW of the mussels fed on a 100% algal ration (100/00; 61.03 ± 8.08 mg), 75/25 (61.00 ± 6.47 mg), 75/00 (60.92 ± 2.31 mg) diets were significantly (p < .05) higher than those fed on a 25% algal ration alone (25/00) (46.55 ± 4.72 mg), 25/75 (45.42 ± 0.52 mg), 50/00 (45.03 ± 4.87 mg) and 100% DAC (00/100; 42.35 ± 1.43 mg) diets. DW values of the starved control group (00/00) were significantly lower (p < .05) than those of mussels from all other dietary treatments (Figure 4).
Final OW values ranged from 3.30 ± 0.86 to 14.47 ± 2.32 mg among treatments. Mussel organic weights were significantly impacted by the main effects LM and DAC (p < .0001 for both effects) with higher overall OWs observed in the treatments that received DAC when compared to those that did not receive DAC. There was also a significant interaction between LM and DAC (p = .0010) suggesting that the relationships between LM and OWs were impacted by the inclusion or exclusion of DAC (Figure 4). OW of mussels fed on a diet of the 100% algal ration (100/00) was significantly (p < .05) higher than those of mussels fed on 25/75 (9.00 ± 0.23 mg) and 25/00 (8.68 ± 0.99 mg) diets. OW values of the starved control group (00/00) were significantly lower (p < .05) than those of mussels fed on all other diets (Figure 4).
3.3 Survival and weight of Manila clams Venerupis philippinarum
Survival of V. philippinarum after 35 days varied from 98 ± 0.03 to 100 ± 00% and showed no difference among treatments.
Live weights were significantly impacted by the main effects LM and DAC (p < .0001 for both effects) with higher overall LWs observed in the treatments that received DAC when compared to those that did not receive DAC. There was not a significant interaction between LM and DAC (p = .1107) suggesting that the relationships between LM and LWs were not impacted by the inclusion or exclusion of DAC (Figure 5).
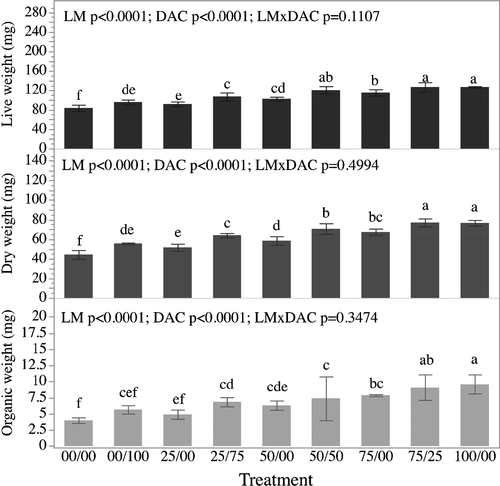
Mean DW (Figure 5) values varied from 44.40 ± 1.78 to 76.93 ± 1.18 mg among treatments. Dry weights were significantly impacted by the main effects LM and DAC (p < .0001 for both effects) with higher overall DWs observed in the treatments that received DAC when compared to those that did not receive DAC. There was not a significant interaction between LM and DAC (p = .4994) suggesting that the relationships between LM and DWs were not impacted by the inclusion or exclusion of DAC (Figure 5). DW of the Manila clams fed on the full algal ration (100/00; 76.6 ± 1.18 mg) was significantly (p < .05) higher than those of clams from all other treatments with the exception of clams from the 75/25 treatment (76.93 ± 1.60 mg). Notably, clams from all treatments with DAC, including dietary treatments 75/25 (76.93 ± 1.60 mg), 50/50 (70.71 ± 2.15 mg), 25/75 (64.1 ± 0.89 mg) and 00/100 (55.8 ± 0.33 mg), had significantly higher dry weights (p < .05) than those of clams fed on the respective LM rations alone or unfed treatments: 75/0 (67.4 ± 1.34 mg), 50/0 (58.5 ± 1.75 mg), 25/0 (51.7 ± 1.40 mg) and 00/00 (44.4 ± 1.78 mg) (Figure 4E). DW of starved Manila clams (00/00; 44.4 ± 1.78 mg) was significantly lower (p < .05) than those of clams from 100/00, 75/00, 75/25, 00/100 and 50/00 dietary treatments (Figure 5).
Mean OW of Manila clams ranged from 4.00 ± 0.18 to 9.61 ± 0.60 mg among treatments. Organic weights were significantly impacted the main effects LM and DAC (p < .0001 for both) with higher overall LWs observed in the treatments that received DAC when compared to those that did not receive DAC. There was not a significant interaction between LM and DAC (p = .3474) suggesting that the relationships between LM and OWs were not impacted by the inclusion or exclusion of DAC (Figure 5).
3.4 Survival and weight of Yellow clams Mesodesma mactroides
Survival of M. mactroides after 21 days varied from 84.44 ± 10.18 to 97.78 ± 3.84% and showed no difference among treatments.
At T21, LW of M. mactroides ranged from 23.11 ± 2.05 to 76.58 ± 0.37 mg. Live weights were significantly impacted by the main effects LM (p < .0001) but not the main effect DAC (p = .1325), however, there was a significant interaction between LM and DAC (p = .0165) suggesting that the relationships between LM and LWs were impacted by the inclusion or exclusion of DAC (Figure 6). LW values for M. mactroides were found to be greatest with the 100% algal diet (100/00; 76.58 ± 3.16 mg) and significantly (p < .05) greater compared with the LW of juvenile clams from all other treatments (Figure 6).
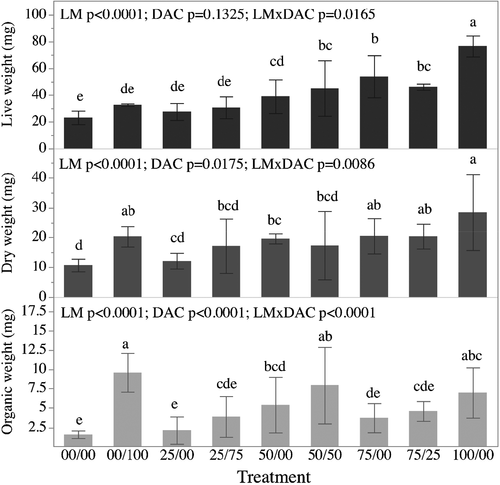
Mean DW values varied from 10.70 ± 0.87 to 28.42 ± 5.08 mg among treatments at T21. Dry weights were significantly impacted by the main effects LM and DAC (and p < .0001 and p = .00175 respectively) with higher overall DWs observed in the treatments that received DAC when compared to those that did not receive DAC. There was also a significant interaction between LM and DAC (p = .0086) suggesting that the relationships between LM and DWs were impacted by the inclusion or exclusion of DAC (Figure 6). DW of the clams fed on the full algal ration (100/00; 28.42 ± 5.08 mg) was significantly (p < .05) higher than those of clams from treatments 50/00 (19.64 ± 0.68 mg), 50/50 (17.30 ± 4.61 mg), 25/75 (17.15 ± 3.67 mg) and 25/00 (12.18 ± 1.08 mg). DW of starved clams from the control treatment (00/00) was significantly lower (p < .05) than those of clams from 100/00, 75/00, 75/25, 00/100 and 50/00 dietary treatments (Figure 6).
Mean OW values ranged from 1.59 ± 0.19 to 9.60 ± 1.01 mg among treatments. Organic weights were significantly impacted by the main effects LM and DAC (p < .0001 for both effects) with higher overall OWs observed in the treatments that received DAC when compared to those that did not receive DAC. There was also a significant interaction between LM and DAC (p = .0001) suggesting that the relationships between LM and DWs were impacted by the inclusion or exclusion of DAC (Figure 6). OW values did not differ among the treatments 00/100 (9.60 ± 1.01 mg), 50/50 (7.94 ± 1.99 mg) and 100/00 (6.99 ± 1.31 mg); although, OW of clams fed on a 100% DAC ration (00/100) showed higher weights (p < .05), when compared to animals from treatments 50/00 (5.40 ± 1.44 mg), 75/25 (4.59 ± 0.51 mg), 25/75 (3.89 ± 1.06 mg), 75/00 (3.73 ± 0.76 mg) and 25/00 (2.12 ± 0.71 mg). OW of starved clams from the starved control treatment (00/00) was significantly lower (p < .05) than those of clams from 00/100, 50/50, 100/00 and 50/00 treatments (Figure 6).
4 DISCUSSION
This study showed that the raw dried alfalfa chloroplast (DAC) preparation can serve as a partial replacement of living algae for rearing juveniles of the epifaunal mussel species P. perna as well as the infaunal clams M. mactroides and V. philippinarum. Overall, when these species were fed partial rations of live microalgae, their growth (in terms of dry and organic weights) at the end of the study was improved though the use of DAC as a replacement. These trends suggest that all three species were able to obtain nutrition from DAC; however, the overall trends also suggested that P. perna and M. mactroides were able to utilize DAC to a greater extent when it represented larger fractional replacements of LM (as evidenced by the significant interaction between LM and DAC). This is in contrast with V. philippinarum, which showed more consistent and modest gains in growth as a result of DAC additions to all partial LM rations.
The extent to which DAC could be used as a substitute for the 100% LM ration, without significantly affecting either dry or organic weights, varied by species. The clams P. perna and V. philippinarum could be grown with up to 50% and 25% replacement of LM with DAC, respectively, without significant reductions in growth when compared to full rations of LM. Mesodesma mactroides could be fed as much as 100% DAC without significant reductions in dry or organic weights, however, this result was not as consistent across ration levels. For example, M. mactroides fed 100% DAC (00/100) had a final mean organic weight that was similar to that of clams fed on the 100% LM (100/00) ration, but the clams had lower organic weights with the 25/75 treatment than with either 100% LM or DM diets. Moreover, the response of M. mactroides to the different substitution levels of DAC resulted in more variable growth responses in terms of dry and organic weights across the range of substitution levels. Due to the more consistent growth response, DAC may be better suited as a partial algae replacement for P. perna than for M. mactroides.
For the M. mactroides, dry and organic weights of juvenile clams fed on 100% DAC were significantly greater than that of starved clams and those fed on 25% rations of LM. The highest final OW occurred with a ration of 100% DAC. Considering that M. mactroides is an infaunal benthic bivalve species (Gianuca, 1987), it may be better adapted for feeding on non-living organic particles, such as DAC, compared with mussels. In addition, ingested mineral particles, which were observed in the clam's faecal strands, may have facilitated breakdown and digestion of DAC. In the clam Macoma balthica, the presence of sand grains in the digestive tract was shown to help reduce ingested particle sizes from 320 to 80 µm (Kristensen, 1972).
Overall, V. philippinarum grew larger than those fed reduced rations of LM when DAC was provided as a supplement to each of the partial algal rations. However, when considering all growth metrics, only 25% replacement with DAC (75/25) resulted in similar clam sizes at the end of the trial to that of clams fed on 100% LM. These results suggest that DAC provides nutrition to V. philippinarum, but it is nutritionally inferior to LM. There are a variety of differences between LM and DAC that may explain their different nutritional values, including particle size, sinking rate and nutrient composition.
Particle size selection in bivalve molluscs has been described by many researchers (e.g., Ward, & Shumway, 2004); for example, particles 0.5–12 μm in size were preferentially ingested by larvae of Crassostrea virginica (Baldwin, & Newell, 1995), and 1.0- to 4.0-μm-sized particles were selected by adult Mytilus edulis (Rosa et al., 2015). Raby et al. (1997) observed 5- to 15-µm-sized particles ingested by the scallop Placopecten magellicanus and the clam Mya arenaria. Ninety-seven percent of the particles of the dried alfalfa chloroplasts (Virentia Inc.) were less than 10 µm and, based on the literature, should have been of a suitable particle size for ingestion by juvenile mussels P. perna and clams M. mactroides and V. philippinarum. Examination of faecal strands collected from experimental animals fed on DAC-containing diets, indicated that the mussels and clams ingested and partially digested these particles. However, DAC was prone to losses, largely attributed to settlement on the bottom of the tanks, and only 50% of the particles remained after 24 h of suspension. These losses may have contributed to the lower growth rates observed in clams and mussels that received DAC replacements when compared to the 100% LM ration.
Although the use of alfalfa products has not been reported for bivalve diets, alfalfa meal has been tested as a protein source in the diet of several fish species (Ali et al., 2003; Chatzifotis et al., 2006; Olvera-Novoa et al., 1990; Yanar et al., 2008) and as a source of carotenoids for improving pigmentation of crayfish Cherax quadricarinatus (Harpaz et al., 2002). Alfalfa has been reported to have a well-balanced amino acid composition and to be rich in carotenoids and carbohydrates (Fiorentini, & Galoppini, 1981), protein (19.80%), carbohydrate (17.9%), vitamin A (123 IU UI g−1) and vitamin E (120 mg kg−1) (Moreira et al., 2007). In this study, we found that DAC contained more protein (43.4%) than carbohydrate (27.1%) and lipid (20.7%). The total amino acid composition was well balanced and similar to those of ISO and CG.
With regard to essential fatty acids, bivalve species have been reported to require dietary sources of polyunsaturated fatty acids (PUFA), such as docosahexaenoic acid (DHA; 22:6n-3) (Cheng et al., 2020; Farías, & Uriarte, 2006; Langdon, & Waldock, 1981; Sühnel et al., 2012), eicosapentaenoic acid (EPA; 20:5n-3) (Farías et al., 2003; Sühnel et al., 2012), arachidonic acid (ARA; 20:4n-6) (Pernet, & Tremblay, 2004) and docosapentanoic acid (DPA = 22:5n-6) (Milke et al., 2006); Pernet et al., 2005). Besides promoting growth, PUFAs are an energy source, a component of cell membranes, and act as precursors for biochemicals involved in the immune response (Fritsche, 2006). This is especially the case for EPA and DHA n-3 fatty acids, whose biological activities include the reduction of the inflammatory response (Al-Nouri et al., 2012; Cumming et al., 2001; Komprda, 2012).
In this study, I. galbana alone was combined with DAC in diets for Brown mussels and Yellow clams, but C. gracilis was added to the diets for Manila clams. Some studies have shown that I. galbana is one of the best monospecific microalgae diets for hatchery production of mollusks (Enright et al., 1986; Helm et al., 2004; Rivero-Rodríguez et al., 2007; Taylor et al., 1997). Isochrysis galbana and C. gracilis have been reported to be rich in lipids (Kim et al., 2012) and n-3 PUFAs (Adarme-Vega et al., 2012; Devos et al., 2006). In this study, we found that I. galbana contained about 12% DHA and C. gracilis contained 23% EPA (Table 4). We found that alfalfa chloroplasts do not possess these essential PUFA (Peoples et al., 1978) and the poor, or inconsistent, growth of mussels and clams fed on DAC might have been due to this deficiency. Algal-sourced PUFA may not have been sufficient to overcome deficiencies in DAC.
In summary, the present study showed that the alfalfa chloroplast product (DAC) can be successfully used as a partial or complete replacement for live microalgae in the diets of juvenile P. perna, M. mactroides and V. philippinarum. Overall, we found statistically significant higher final dry and organic weights of juvenile mussels and clams when DAC was added to partial rations of LM. These results indicate that supplements of DAC may be useful in maintaining juvenile mussels and clams when microalgal feeds are limited or not available. The use of DAC as a partial replacement for LM may provide an economic benefit to land-based nursery systems by reducing overall feed costs or by increasing production capacity, with minimal investments to meet higher feed requirements.
ACKNOWLEDGEMENTS
The authors thank Dr Grant Vandenberg, Laval University, Canada, for facilitating the project. Also, thanks to Greg Jakobs and others at Taylor Shellfish for providing the Manila clams used in this study and to Austin Williams for assisting in the clam experiment at Oregon State University. We also wish to gratefully acknowledge Louise Coopman who carried out the lipid and fatty acid analyses. This study was financed in part by the Coordenação de Aperfeiçoamento de Pessoal de Nível Superior-Brasil (CAPES)-Finance Code 001 to the Federal University of Santa Catarina and by a grant to Oregon State University from Virentia Inc.
Conflict of interest
Co-author Louis P. Vézina provided the project with dried alfalfa chlorophyll (DAC) products and he wrote section 2.2 Preparation of the dried alfalfa chloroplast (DAC) for the paper. He is a member of Virentia, the company that funded the project; however, he was not directly involved in the design, execution and interpretation of the experiments reported in this study.
Open Research
DATA AVAILABILITY STATEMENT
The data that support the findings of this study are available from the corresponding author upon reasonable request.


