The penile duplex ultrasound: How and when to perform it?
Abstract
Background
Because it is a superficial structure, the penis is ideally suited to ultrasound imaging. A number of disease processes, including Peyronie's disease, penile fractures and tumors, are clearly visualized with ultrasound. Baseline and dynamic assessment of cavernosal arterial changes after pharmaco-stimulation with alprostadil allows standardized diagnosis of arterial and venogenic causes of erectile dysfunction (ED).
Objective
To illustrate how to correctly perform flaccid and dynamic penile duplex ultrasound (D-PDU) and in which patients to recommend it.
Materials/Methods
An extensive search of the literature was carried out on Pubmed with the insertion of the following Medical Subjects Headings (MeSH) terms and keywords “penile color Doppler ultrasound” “peak systolic velocity” “end-diastolic velocity”, “acceleration time”, “resistance index”.
Evidence
In our experience, arterial erectile dysfunction is identified after standardized intracavernous injection (ICI) of alprostadil (10 mcg) when values of peak systolic velocity (PSV) are <35 cm/s and, in the most severe forms, for values <25 cm/s. Arterial insufficiency can also be identified by increased acceleration time (AT) values (>110 ms) and/or by a lack of visualization of helicine arteries at power Doppler mode along with incomplete achievement of penile rigidity. The veno-occlusive incompetence is determined when end-diastolic velocity (EDV) values are >4.5–5 cm/s or in the case of resistance index (RI) values <0.75. The assessment of additional surrogate markers of endothelial dysfunction, that is, intima-media thickness, mean platelet volume (MPV), endothelial progenitor cells (EPC), endothelial cell specific molecule-1(endocan) are also useful in assessing the patient's cardiovascular risk but are still considered investigational in the interpretation of D-PDU results.
Conclusion
D-PDU scan after ICI with vasoactive drugs is a safe procedure and represents the gold standard for the diagnostics of penile pathologies and should be performed in men with ED not responding to oral conventional therapies and/or in those requiring accurate stratification of cardiovascular risk.
1 INTRODUCTION
Penile anatomical pathology is a frequent cause of erectile dysfunction (ED), and penile blood flow studies are important in discriminating vascular incompetence that are relevant for the patient.1 Arteriopathy causes ED through a decrease of blood flow in the penile arteries; also, vascular impairments when associated with alteration of cavernous smooth muscle cells, represent the major cause of ED in men over 50. Atherosclerosis may be considered the most important disease linked to ED and Leriche's syndrome, defined by aortic-iliac atherosclerosis along with “claudicatio-intermittens”.2 Dyslipidemia, hypertension, diabetes mellitus, obesity, smoking and sedentary life-style should be considered as independent risk factors for atherosclerosis and consequently, may contribute to the pathogenesis of ED.3 Moreover, if present in combination with each other, they may influence the severity of DE leading to less or more severe forms.4 High-resolution gray-scale imaging, especially in combination with color and pulsed-wave Doppler, forms the basis of modern penile ultrasound evaluation. In this pictorial review, we will summarize the state of the art regarding the most appropriate technique for dynamic- Penile duplex ultrasound (D-PDU), analysis of the spectral Doppler waveform, and different imaging related to most common normal and pathological cases in clinical practice.
2 MATERIALS/METHODS
An extensive search of the literature was carried out on Pubmed with the insertion of the following Medical Subjects Headings (MeSH) terms and keywords “penile color Doppler ultrasound” “peak systolic velocity” “end-diastolic velocity”, “acceleration time”, “resistance index”.
3 TECHNIQUE
Because of most notably psychological interferences on the erectile process,5, 6 it is important that D-PDU can be performed in an outclinic dedicated area, with the sole operator present within the room. The examination is performed with the patient lying in a supine position, invited to keep the penis in the midline and inverted over the pubic triangle. It starts with a grayscale baseline study of penile shape and erectile tissue, in order to exclude lesions of these structures. Finally, some Authors have recently proposed the evaluation of peak systolic velocity (PSV) in the flaccid state, considering his high degree of correlation with the erectile dynamic response to intracavernous injection (ICI) and with the stratification of cardiovascular risk.7 However, we consider this method not very useful for the purpose of an accurate vascular imaging study of the erectile dynamics.
After this preliminary phase, we perform a standard ICI of 10 mcg of PGE1, followed by a short manual self-massage. In the first 5 min following the injection, the progressive vasodilation of the cavernous arteries is observed with Duplex Doppler, their caliber and flow symmetry is checked and possible anatomical variants or tributary arteries are searched for. Afterward, we move on to the study with power Doppler, in order to verify the relaxation of the cavernous and emerging branches, and to evaluate the morphology of these vessels. To promote better trabecular relaxation, some authors8, 9 suggest to perform penile pharmaco-stimulation along with Video Sexual Stimulation (VSS), but this aspect remains very controversial due to a lack of standardization in re-dosing protocols prior to VSS.10 The association between sildenafil and VSS has recently been proposed to induce an erection, and diagnostic results are encouraging.11 Despite some authors' experience,12 we emphasize that a significant extension of the examination time may allow the induction of complete erection and better diagnostic conclusions. In our experience, the degree of anxiety correlates negatively with PSV and directly with dynamic end-diastolic velocity (EDV) at all time-points examined. Interestingly, patients with the highest degree of anxiety show a distinct penile hemodynamic pattern, achieving normal PSV values only 20 min after ICI of alprostadil. Similarly, this group of patients show higher mean EDV values, after 5 and 10 min, as compared to minimal-to-moderate anxiety patients.13 These ultrasound hemodynamic parameters confer the appearance of a “low-responder” pattern to patients with severe anxiety. This latter could be easily measured before the procedure with different validated questionnaires, that is, GAD-7.13
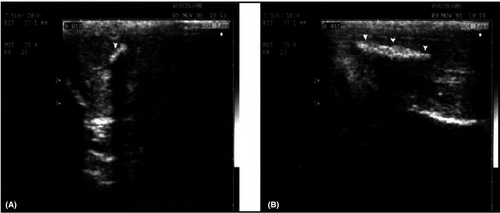
Then, we move on to velocitometric measurements with pulsed Doppler (DP), alternating between the two sides, in order to ensure perfusion symmetry; bilateral penile blood flow assessment is important and the lowest measurements obtained usually show a correlation with the degree of erection.14 It is important that the evaluation with pulsed Doppler is carried out taking care to place the sample volume at the origin of the cavernous artery. This precaution is necessary because a progressive reduction in the flow velocity at most distal sites of the arteries occurs and the consequent increase in intracavernous pressure also causes a progressive compression of the vessels, which however is less intense at their origin from the pelvic floor. In the state of maximal erection, the gray scale study of the membranes and the erectile tissue is completed (some penile plaques only manifest themselves in this way; Figure 1). If there are signs of arterial insufficiency, it will be good practice to include in the examination also the study of the abdominal aorta and common iliac arteries (the detection of hypogastric arteries is very difficult), in order to document any sign of proximal involvement of arterial pathology.
4 PONDERATED ANALYSIS OF THE SPECTRAL DOPPLER WAVEFORM
4.1 Qualitative analysis
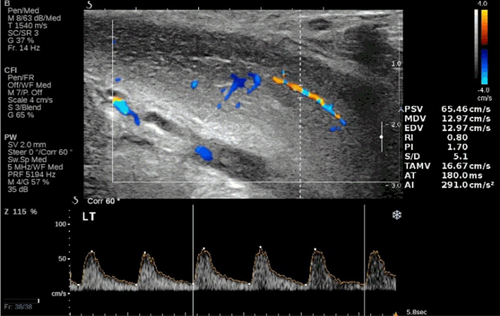
In the shape of the Doppler waves, the systolic and the diastolic components are easily recognized, respectively. In the presence of “low peripheral resistance” states, the systolic phase begins with a steep rise, culminating in a sharp peak. From here the path descends less abruptly and ends, sometimes with a small notch thus starting the diastolic phase. This is characterized by a smooth inclined deflection toward the baseline, which however remains constantly positive. In the presence if “high peripheral resistance” states, the systolic phase similarly begins with a steep rise, culminating in a sharp peak. Unlike the previous type of velocitogram, however, here the trace descends with similar steepness and ends with a negative deflection; that is, the beginning from the diastolic phase, which quickly turns out to the baseline. If with the injection of vasoactive drugs one could hypothesize to abolish any functional inhibitory control of the tone of the trabecular smooth muscle, the simple observation of the development of all erectile phases would allow to express a satisfactory judgment on the quality of the veno-occlusive mechanism. Unfortunately, as we have anticipated, this is not possible in all cases.
4.2 Quantitative analysis
Among the different parameters used in vascular diagnostics for the quantification of flows, only a few prove to be useful in the study of ED: the peak systolic velocity (PSV), the acceleration time (AT), and the end-diastolic velocity (EDV) (see Table 1). The values of the three parameters can be quickly obtained by the system software used. The PSV, expressed in cm/s, indicates the maximum flow rate detectable in systole, in the various samples performed during the examination. However, for obtaining a reliable measurement, it is necessary to point out some technical tips:
- Place the sample volume always at the origin of the cavernous artery. Measurements carried out in more distal sites provide different data that are affected by the degree of repletion of the corpora cavernosa;
- Be sure that you are sampling the main cavernous artery. In fact, secondary ipsilateral arterial branches, with remarkable lower flow velocities are not uncommon;
- Take care to accurately position the Doppler correction angle (max 60 degrees), according to the actual flow direction, since it is on the basis of this tool that the equipment is able to calculate the flow velocity;
- Remember that maximum PSV generally develops 5–6 min after drug stimulation, 22% of patients have a greater response latency (range 1–18 min).14 The evaluation of the PSVs must therefore continue for at least 20–25 min.
| Doppler parameter | Diagnostic significance |
|---|---|
| Peak systolic velocity (PSV) of CA | Indicates arterial inflow |
| Normal: ≥35 cm/s | |
| Borderline: 25–35 cm/s | |
| Abnormal: <25 cm/s | |
| End-diastolic velocity (EDV) of CA | Indicates veno-occlusive competence |
| Normal: <3–5 cm/s | |
| Venous leakage: >5 cm/s | |
| Resistive index (RI) of CA (PSV-VTD)/PSV | Normal: >0.9 |
| Venous leakage: <0.75 | |
| Systolic rise time (SRT) of CA | Normal < 110 ms |
| Abnormal > 110 ms | |
| Flaccidpenileacceleration (FPA) (PSV-EDV)/SRT) | Indicates vascular rigidity |
| Abnormal < 1.17 m/s2 |
- Abbreviation: CA, cavernous artery.
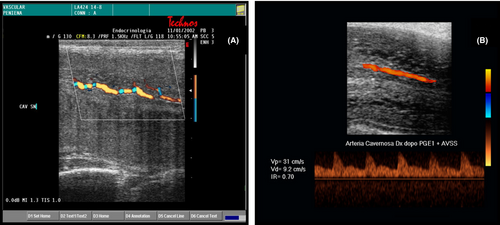
In this regard, it should be remembered that persistent adrenergic overtone due to elevated anxiety may occur15 thus impairing veno-occlusive mechanism. In this case, the careful use of color or power Doppler allows to detect a characteristic “corkscrew” appearance of the cavernous arteries and the absence of visualization of the emerging branches, resulting in a persistently low PSV (Figure 2). Unfortunately, power Doppler application is not univocal in its interpretation especially when adrenergic overtone does not resolve. To this purpose, we use to leave the patient alone for a few minutes after ICI unless the arteries do relax themselves and the velocitometric waveforms normalize. If this is not the case, we recommend the repetition of D-PDU instead of re-dosing of alprostadil, whereas the occurrence of prolonged erection may be more frequent.
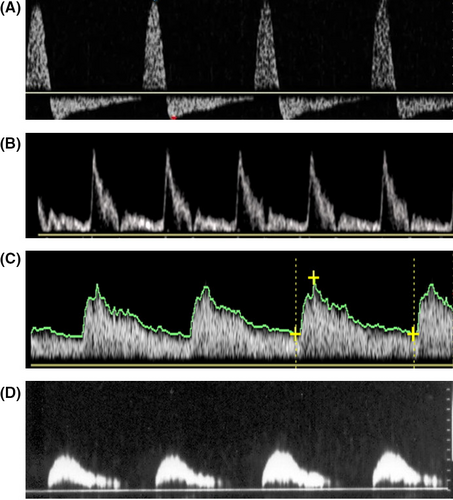
If the above suggestions are applied, PSV measurement is a fundamental criterion for the diagnosis of vascular ED. In fact, comparative studies with pharmaco-arteriography have shown that the threshold value below which an arterial alteration must be suspected is 35 cm/s. Between 34 and 30 cm/s, we conclude for mild arterial insufficiency; between 25 and 29 cm/s, intermediate arterial insufficiency; below 25 cm/s, severe arterial insufficiency.16 It has now been shown that PSV is a parameter that inversely correlates with age, and it is therefore possible to correct the PSV for the patient's age. A very low PSV (<25 cm/s) should raise the suspicion of diffuse vascular disease and suggests extending the ultrasound evaluation to the arteries of other parts of the body, even if marked protocol heterogeneity exist, rendering data interpretation a problem.17 It should also be noted that there are many patients who, despite PSV values greater than 25 cm/s, still have significant arterial disease at angiographic examination,18 and patients with evident power Doppler arteriolar damage may have absolutely normal PSV values.19 Finally, it has been shown that subjects with valid communicating arteries (dorsal-cavernous and accessory cavernous with flows comparable to those of the main trunks) can achieve a valid erection even with PSV values lower than those considered normal.20 In the past, some authors had already criticized the absolute validity of this index21 and in recent years a further element of doubt has emerged from a work that demonstrated the poor reproducibility of the D-PDU in the follow up of ED patients.22 Therefore, the PSV should be considered a valid parameter for the morpho-functional diagnosis of ED, but not in absolute value as regards systemic vascular disease.23 Figure 3 shows different aspects of continuous qualitative reasoned analysis of the penile arterial velocitograms.
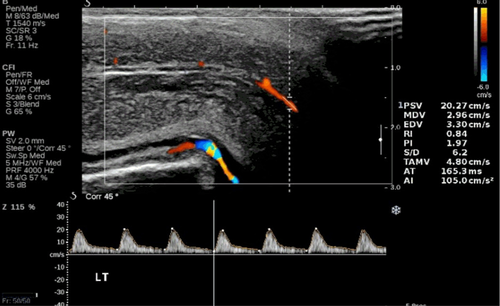
The acceleration time (AT “acceleration time”, or SRT, “systolic rise time”), expressed in milliseconds (ms), is the time measured from the start of the systolic peak up to its maximum value. It corresponds to “pulse celerity”. It usually slows down in obliterating arteriopathies,24 when the ascending branch becomes late; the apex rounds off and the flow velocity decreases (“small and late pulse”). Correlating the data of the D-PDU with those of the pharmaco-arteriography, some authors have found that higher acceleration times at the threshold of 110 ms are predictive of arterial disease.25 However, this parameter is very variable during the execution of the examination, therefore we believe it must be evaluated very critically by the examiner, in order to be able to express an accurate diagnostic judgment (Figure 4).
Using these parameters alone, however, it remains difficult to differentiate between arterial disease and arteriolopathy. Yet it has been shown that also the alteration of the terminal arteries can result in veno-occlusive ED.26 Arteriolar dysfunction is suspected during arteriography when the branches of the helicines are poorly visible in the enlargements of the arteriograms, despite a good visualization of the penile arteries.27 This criterion can also be correctly applied to diagnostics with D-PDU. The morphological analysis of the vascular pattern obtainable with Power Doppler has largely confirmed the existence of primitively arteriolar damage, demonstrating in some patients the narrowing, distortion and rarefaction of these small vessels.
The end-diastolic velocity (EDV), expressed in cm/s, indicates the amount of flow still present in a vessel at the end of the diastolic phase. The semi-quantitative equivalent of this parameter is the resistance index (“resistive index” – RI), which results from the PSV-EDV/PSV formula and expresses the degree of peripheral resistance to flow. Some authors, on the basis of cavernosometric data, argue that an end-diastolic rate persistently greater than or equal to 4.5–5 cm/s after drug stimulation, in the presence of a normal arterial inflow, would be highly indicative of veno-occlusive dysfunction.28-30 Other authors give great importance to the RI.31 An RI greater than 0.90 would indicate a state of normality, while an RI less than 0.75 would suggest “venous leakage”. For values between 0.75 and 0.90 there would be an overlap of normal patients and patients with veno-occlusive deficiency.32 However, we have previously seen that the information related to the degree of veno-occlusion can be obtained more simply with the morphological analysis of the velocitometric curve, whose shape allows us to even predict the extent of the endocavernous pressure. Furthermore, when the waveform begins to reflect increased pulsatility, the use of RI becomes absolutely inappropriate, since different velocitograms, typical of different degrees of resistance, can have identical indices. Finally, the difficulty in differentiating between functional and organic veno-occlusive deficit is not abolished by the use of these parameters. For these reasons, we believe that more than the absolute value of the EDV speed and the RI, it is the stable achievement of a phase 3 (EDV equal to zero) that indicates adequate veno-occlusion (Figure 5).
5 DYNAMIC PENILE DUPLEX ULTRASOUND: NORMAL PATTERNS
5.1 Gray-scale ultrasound
The corpora cavernosa of the penis, the glans and the urethral spongiosa are clearly visible in each of their portions. With a flaccid penis, the complex anatomical stratification of the penis is only partially visible, while better results are obtained during the tumescence phase. Skin, subcutaneous and Dartos are not always easily separable. A very thin non-continuous, hyperechoic line indicates the interface constituted by the fascia of the penis. Immediately below it, there is an echogenic layer consisting of the vascular connective external to the albuginea, in which the circumflex veins and the nerve-vascular bundle run, dorsally. The next layer is the albuginea, which appears in axial section as a well measurable hyperechoic band, with uniform thickness, arranged around the corpora cavernosa. The normal echo-structure of the corpora cavernosa has an average echogenicity, quite homogeneously distributed, due to the multiple interfaces created by the septa. While increasing blood flow into the corpora cavernosa, the albuginea gradually becomes thinner. The cavernous arteries appear as two thin paraseptal hyperechoic tracks in sagittal scans. In this phase, it is possible through a non-invasive technique now validated,33 to study the functional ability of the cavernous endothelium to release nitric oxide after occlusion using a mini-cuff. This method is able to accurately identify (cut-off for flow-mediated-dilatation of 40%), in the absence of other pathological parameters, the presence of early endothelial dysfunction but has no validation in clinical practice.
5.2 Color Doppler
In the flaccid state, the cavenous arteries are clearly visible only at the origin. In the minutes immediately following the ICI of alprostadil, a clear, symmetrical dilatation of the arteries is observed, which can be explored along their entire length; the main emerging trunks are also evident. The color of the arteries, initially red because the flow is directed toward the probe, tends to turn blue. This happens because, as we have seen, in the normal patient a progressive reduction of diastolic flow develops, up to its inversion. Since the diastolic time is greater than the systolic period, the dominant signal is that of diastolic reflux, away from the probe and therefore coded in blue. In the period following pharmacological stimulation, any secondary tributaries and normal communicating vessels, such as the trans-septal arteries and cavernous-cancellous anastomoses, become very evident.
5.3 Power Doppler
The power Doppler makes possible a real “echo-angiography” of the cavernous and branches emerging from them.34 The normal picture demonstrates the regularity of the caliber and course of the cavernous arteries (Figure 6). There is no consensus on the interpretation of this tool in penile dynamics.

5.4 Pulsed Doppler
In flaccid conditions, the velocitometric curve presents the typical high resistance flows. The normal PSV consistently exceeds 12.5 cm/s, 7 the waveform is sharp and is followed by a sudden deflection, which is negativized in the proto-diastole. In the first minutes after the ICI of the drug, the velocitogram rises considerably with the systolic peak and has the appearance of a continuous wave due to the presence of a high component of diastolic flow (Phase 1). Within 5′–7′, the maximum PSV is usually reached and a progressive decrease in the diastolic flow rate is already observed, with the appearance of a dicrot wave at the beginning of diastole (Phase 2). Between 7 and 10 min there is the progression to phases 3 and 4, with the EDV tendency to decrease, and then approximate to zero. Stage 5 (full erection, maximal penile rigidity) is not always achieved; the voluntary contraction of the bulbocavernosus muscles may favors maximal erection achievement. Re-dosing with combination of vasoactive agents has been reported to improve diagnostic accuracy in this setting35; however, in these cases, if EDV is negative at the end of procedure and RI > 1, the possibility of a prolonged erection increases and a detumescence procedure is recommended to avoid unpleasant sequelae to the patient.36 In the authors' experience and according to AUA guidelines, when erection exceeds 3–4 h duration along with an inversion of telediastolic velocity, a pharmacological “reverse” is indicated in order to prevent possible surgical detumescence. We usually inject an alpha-selective adrenergic agonist (1–2 mg ethylephrine or phenylephrine) solution with 1:10 dilution ratio. One mL injections are made every 5 min into the corpora by a 21G butterfly as needed, up to 1 h; the α-adrenergic action antagonizes the vasodilator effects of ICI with PGE1.1
6 DYNAMIC PENILE DUPLEX ULTRASOUND: CORRELATION WITH OTHER MARKERS OF ENDOTHELIAL DYSFUNCTION
The association between ED, particularly the vasculogenic form, and cardiovascular risk is well known. Accordingly, D-PDU represents a true cardiovascular imaging test that allows early identification of the presence of endothelial dysfunction and atherosclerosis.37 Endothelial dysfunction seems to be the common thread linking erectile dysfunction, cardiovascular disease and their common risk factors. Indeed hypertension, obesity, dyslipidemia, alterations in glucose metabolism have all been related to endothelial dysfunction. The latter is characterized by vascular stiffness, increased vascular tone, increased production of inflammatory cytokines and inflammatory response, increased permeability, decrease in endothelial cell growth, dysregulation of fibrinolytic factor and reduced production of endothelial nitric oxide synthase (eNOS) resulting in reduced bioavailability of nitric oxide (NO).38 All these alterations in turn are correlated with the pathogenesis of atherosclerosis.39
There are several markers of endothelial dysfunction that have been correlated with the disease patterns seen at D-PDU. Among these, an important role is played by endothelial progenitor cells (EPC) and endothelial microparticles (EMP). The former are markers of endothelial repair, while the latter are markers of endothelial cell apoptosis.40 In particular, circulating levels of EPCs seem to be reduced in patients with ED and coronary artery disease (CAD), indicating an alteration of normal endothelial repair processes.41 However, in a previous study we showed that in patients with vascular erectile dysfunction there is an increase of EMPs and of a dysfunctional phenotype of EPCs (CD45neg/CD34pos/CD144pos) in turn correlated with severe reduction of PSV (<25 cm/s), increased intima-media thickness (IMT) and increased acceleration time (AT) at D-PDU. These evidences suggest the possibility of an integrated approach between D-PDU and EPC levels for early detection of vascular dysfunction and prevention of future cardiovascular comorbidity.42 Similarly, in another study, Foresta and colleagues demonstrated in patients with ED the reduction of total EPCs levels and the relative increase of a particular phenotype of osteocalcin-expressing EPCs correlated with coronary atherosclerosis.43 Furthermore, they showed that this phenotype was associated with increased IMT > 0.3 mm and the presence of plaques within the cavernous artery (IMT > 0.4 mm) at PCDU43 (Figure 7). In agreement with these findings, increased IMT and the presence of cavernous artery plaques was correlated with a 3-fold raised risk of major cardiovascular events.44 Another marker linked to endothelial dysfunction is the mean platelet volume (MPV). In detail, endothelial dysfunction and the consequent reduced levels of NO and prostacyclin favor the activation of platelets, resulting in increased release of inflammatory and mitogenic mediators which further aggravate endothelial damage. Since the MPV is an index of platelet activity, it correlates with the presence of more thrombogenic platelets and accordingly with vascular pathologies including ED.45 Indeed, the increase in mean platelet volume correlates with an approximately 2.28-fold increase in the risk of developing CAD, with an increase in mortality following CAD and with a greater risk of restenosis after angioplasty. It has similarly been correlated with an increased risk of stroke and peripheral arterial disease.46 Regarding erectile dysfunction, on D-PDU analysis, increased MPV correlates not only with the presence of arterial erectile dysfunction, but also with the severity of the condition. In fact, we demonstrated a negative correlation between blood levels of MPV and PSV values found at the D-PDU.46
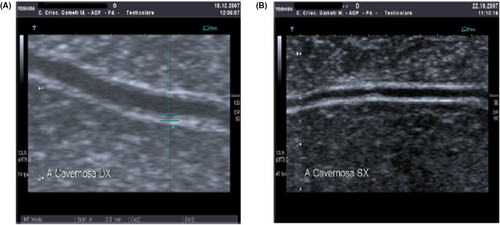
Finally, endocan (endothelial cell specific molecule-1) has also been seen to be related to vascular pathologies and consequently to erectile dysfunction. It is a proteoglycan released by the damaged endothelium and involved in the proliferation of vascular smooth muscle which in turn takes part in the atherosclerotic process. The evidence of literature suggests that in patients with ED, endocan levels are higher and negatively correlated with PSV values at the D-PDU.47
7 CONCLUSIONS
D-PDU is an important diagnostic tool even in the oral drugs era. We believe that the D-PDU has a fundamental diagnostic role even in the young patient with primary ED or secondary to trauma of the pelvis, perineum and penis. Remarkably, young patients with severe anxiety show a “late-responder” penile hemodynamic pattern. In these patients, although PSV in flaccid state may be below 13 cm/s, a normal PSV value (>35 cm/s) may be reached late (20 min) after ICI. Therefore, D-PDU scan after ICI with vasoactive drugs should be considered a safe and accurate diagnostic test in patients with ED of any origin, while PSV in the flaccid state may not be able to investigate between different causes of vascular ED. Also, the importance of recognizing the etiology of ED has must be reinforced even in the elderly.48 In this regard, we want to remember how performing a D-PDU before the prescription of oral drugs can often be a predictor of their effectiveness.49 In fact, the data indicate that there is a correlation between the nature and severity of penile vascular damage and the response to oral drugs such as sildenafil, with a lower response observed in the presence of severe venous occlusive dysfunction or mixed ED.50
Finally, we want to emphasize that ED can be the first sentinel symptom for patients at vascular risk.51 The correct performance of a D-PDU is able to recognize various forms of arterial ED52 and may be mandatory for patients' referral to most inclusive morphological examination of the aorta, iliac vessels, femoral and carotid bifurcations, coronary arteries in search of lesions unrecognized that could save the patient's life.
CONFLICT OF INTEREST
The authors declare no conflict of interest.
AUTHORS' CONTRIBUTIONS
Conceptualization, A.A and S.L.V.; methodology, A.C; data curation, A.C., E.A.G, E.C., and A.B.; writing—original draft preparation A.A and S.L.V, writing—review and editing, A.B.; visualization A.C., E.A.G, E.C. and A.B., supervision A.A. and S.L.V. All authors have read and agreed to the published version of the manuscript.


