Ultraviolet/visible/near-infrared spectral analysis and chemometric tools for the discrimination of wines between subzones inside a controlled designation of origin: a case study of Rías Baixas
Abstract
Background and Aims
Chemometrics combined with ultraviolet (UV), visible (VIS) and near-infrared (NIR) spectral analysis were evaluated to classify wines belonging to the controlled designation of origin (DO) Rías Baixas (Spain).
Methods and Results
Samples of wines made solely from the Albariño cultivar from subzones Condado, Salnés, Rosal and Ribeira do Ulla were analysed in transmittance mode using UV, VIS and NIR ranges alone or in combination. Principal component analysis was used to explore and determine data patterns. Soft independent modelling of class analogy (SIMCA), linear discriminant analysis and support vector machine classification were used to classify the samples. Condado wines were completely classified by applying SIMCA to the UV/VIS/NIR, NIR or VIS/NIR spectral ranges. Salnés and Ribeira do Ulla wines were completely classified by applying SIMCA to the UV/VIS spectral range. Finally, Rosal wines were completely classified by applying linear discriminant analysis to the VIS/NIR spectral range.
Conclusions
These results show that combinations of UV/VIS/NIR spectra and chemometric methods can be used as a rapid technique to classify subzones into a DO such as Rías Baixas. This technique may also assist authentication because the models also discriminated wines from outside Rías Baixas.
Significance of the Study
The importance of spectral range selection and chemometric tools for the classification of wines inside a DO was demonstrated.
Introduction
Spectroscopy has become one of the most attractive and common methods of analysis, providing simultaneous, rapid and non-destructive quantification of the major components of many agricultural products and plant materials (Restaino et al. 2011, Rohman and Che Man 2011, Rohman et al. 2011, Rios-Corripio et al. 2012).
Near-infrared (NIR) spectroscopy analysis is characterised by low molar absorptivities and scattering, which allows a nearly effortless evaluation of pure materials. Although Herschel discovered light in the NIR region as early as 1800, scientists of the first half of the last century ignored it, believing that it lacked analytical interest. More than 100 years later, the use of the NIR region of the electromagnetic spectrum has become one of the most promising techniques in molecular spectroscopy (Cozzolino et al. 2011a).
Near-infrared equipment has undergone radical changes, with the development of a new generation of instruments and accessories. The high-speed operation of the diode-array spectrophotometers currently available in the market provides the opportunity to acquire spectral information from relatively large surface areas of a sample in a short time, thus enabling real-time analysis (González-Caballero et al. 2010).
In a highly competitive market, wineries must invest more in technology to increase productivity and to improve wine quality (Di Egidio et al. 2010). Many aspects of wine composition have been measured with NIR spectroscopy in red and white wines; they include alcohol, pH, volatile acidity, reducing sugars, volatile compounds, sulfur dioxide, and organic acids such as malic, tartaric and lactic acids (Cozzolino et al. 2011c). NIR spectroscopy has gained wide acceptance in the field of food chemistry mainly because of its suitability for recording the spectra of solid and liquid samples at low cost without any pretreatment and in a non-destructive way. It is also an easy-to-use, reliable and versatile analytical method for determining different compounds in food products (Sáiz-Abajo et al. 2004).
The controlled designation of origin (DO) is the name of a region or place officially recognised to produce certain foods with special characteristics of the location. Determining the geographical origin of a sample is a good indicator of authenticity, and NIR has previously been applied to test wine authenticity (Cozzolino et al. , Riovanto et al. 2011). There is a need in the food industry to improve quality and process controls through rapid, automatic and modern production systems. Classification methods are optimal tools for quality determination where qualitative responses are studied and modelled (Ballabio and Todeschini 2009).
Wine is influenced by several factors: microclimate and macroclimate, soil, topography, and a range of cultural conditions. Wine classification according to its origin has been studied to assess differences, and to determine authenticity and possible adulterations (Caruso et al. 2012).
Distinct wine cultivars and wines from different regions have been repeatedly and successfully differentiated using NIR (Alvarez et al. 2003). To our knowledge, however, differences between the production subzones inside a DO have not been evaluated using ultraviolet/visible (UV/VIS) and NIR spectroscopic techniques and chemometric tools.
The aim of this work was to evaluate the feasibility of using UV/VIS and NIR spectroscopic techniques and chemometric tools to classify wines from subzones of the Spanish DO Rías Baixas (Condado, Salnés, Rosal and Ribeira do Ulla).
Materials and methods
Samples
Commercial white wines (33 samples) made during the 2009 vintage solely from the Albariño cultivar from Rías Baixas were analysed (Table 1). The wines were collected from producers in the Condado, Rosal, Salnés, Soutomaior and Ribeira do Ulla subzones. All samples were stored at 5°C until analysis.
| Total wines | |
|---|---|
| Subzones of DO Rías Baixas | |
| Condado (Albariño) | 10 |
| Salnés (Albariño) | 10 |
| Rosal (Albariño) | 8 |
| Ribeira do Ulla (Albariño) | 5 |
| Other DOs | |
| Valdeorras (Godello) | 1 |
| Ribeira sacra (Godello) | 1 |
| Monterrei (Godello) | 1 |
| Ribeiro (Treixadura) | 1 |
| Rioja white | 1 |
| Table wine | 2 |
Commercial white wines (eight samples) from other DOs and table wines were analysed to determine if the techniques could discriminate between them.
Spectral measurements
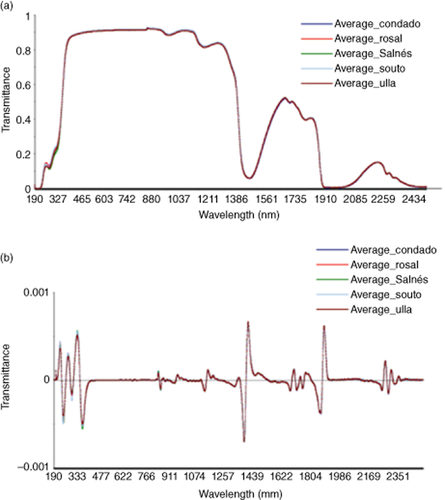
Before UV/VIS/NIR analysis, the samples were heated to 30–35°C (Cozzolino et al. 2007) for 20 min to increase the reproducibility of the measurements (Ferrari et al. 2011). Samples were scanned in transmittance mode (T) at 2-nm intervals in the UV/VIS/NIR (190–2500 nm) region using a cuvette with a 1-mm path length. The analysis was performed with a V-670 spectrophotometer (Jasco Inc., Hachioji, Tokyo, Japan), and the spectral data were collected with Spectra ManagerTM II software (Jasco Inc.). Representative spectra are shown in Figure 1. The samples were collected and analysed in triplicate.

(a) Typical ultraviolet/visible/near-infrared (UV/VIS/NIR) average spectra of wine samples utilised, and (b) second derived UV/VIS/NIR average spectra of samples.
Data pretreatments and multivariate data analysis
The spectra were exported from the Spectra ManagerTM II software to the Unscrambler software (version X 10.2; CAMO ASA, Oslo, Norway) for chemometric analysis and pre-processed treatments. Because of insufficient number of wines, the spectral data for the subzone Soutomaior were excluded from the data analysis.
The spectra are affected by temperature (Cozzolino et al. 2007, Shen et al. ), light scattering (Chen et al. 2011), baseline drift and background noise (Shen et al. ). Therefore, it is necessary to apply pretreatments to reduce these deviations, to obtain the useful spectra information and to develop the models of classification. In classification analysis, pattern recognition methods (supervised and unsupervised methods) can be used to interpret data matrices (Cozzolino et al. 2011c).
The spectra were pre-processed using the standard normal variate (SNV) method, smoothing (25 points and second-order filtering operation) and second derived Savitzky–Golay derivation transformations (Liu et al. 2008, Lorenzo et al. 2009, Riovanto et al. 2011, Garde-Cerdán et al. 2012, Shen et al. ).
Principal component analysis (PCA) models were developed using raw and pre-processed data. PCA is the first step of data analysis to detect patterns or outliers in the data (Fernández-Novales et al. 2009, Shen et al. ). PCA uses a mathematical procedure to transform a set of correlated response variables into principal components, generating a new set of non-correlated variables (Cozzolino et al. 2011c). PCA can provide information about the structure of data, and it helps determine the optimised maximum variance for future modelling (Shen et al. ).
Discrimination models were developed using linear discriminant analysis (LDA). LDA is a supervised classification technique by which the number of categories and samples in each category are previously defined (Cozzolino et al. 2011c, Riovanto et al. 2011, Fudge et al. 2012, Liu et al. 2012). The method produces several linear discriminant functions equal to the number of categories minus one. This allows the samples to be classified into one or other category (Manley et al. 2008, Cozzolino et al. 2011c, Riovanto et al. 2011, Liu et al. 2012). Using LDA for classification allows for maximum differentiation between categories and minimises the variance within categories (Riovanto et al. 2011). Discriminant functions are calculated so that the classes are observed at the widest while reducing dimensionality without loss of differentiation between these classes. These functions are set as the new axes that best provide for the differences between categories or classes (Alcázar et al. 2003). LDA is based on PCA scores and is carried out using the score values of the first components that give the highest level of separation with high variance in the developed PCA models (Ferrari et al. 2011, Riovanto et al. 2011, Fudge et al. 2012).
Soft independent modelling of class analogy (SIMCA) is the most commonly used technique for class modelling (Cozzolino et al. 2011c, Oliveri et al. 2011). SIMCA is a supervised pattern recognition method that allows for the classification of samples into an existing group. Each class model is developed independently. This method applies PCA class modelling for each sample category studied (Ballabio and Todeschini 2009, Cozzolino et al. 2011a). Then, new unknown samples are compared with the class models and assigned to classes according to their similitude with the calibration samples. The new samples are classified into one or another group if they are similar enough to the members of one class (Cozzolino et al. 2011c).
Support vector machine (SVM) is a pattern recognition method and is a supervised method like SIMCA and LDA. It defines a function that describes the limit to separate classes by maximising the distance between them (Ballabio and Todeschini 2009). SVM can work with linear and non-linear multivariate analysis, and quickly resolves these problems (Liu et al. 2011). This method employs linear equations instead of quadratic programming to obtain the support vectors. SVM has advantages over other classification methods such as neural networks because it produces a unique solution and is less susceptible to overfitting. This method is effective for modelling non-linear data and uses an iterative training algorithm to achieve the separation of different classes. The concept of SVM is to non-linearly map the original data X into a higher dimensional feature space, and to create a hyperplane between two sets of data for classification (Chen et al. 2007, Lin et al. 2009).
Results and discussion
Figure 1a shows the raw average UV/VIS/NIR spectra of Condado, Rosal, Salnés, Soutomaior and Ribeira do Ulla samples. There are no obvious differences in spectra upon visual inspection. The figure shows water-related absorption bands found at around 950 and 1460 nm, which are related to the third overtone of O-H (Murray 1987, McGlone and Kawano 1998, Williams 2001). Also observed were the principal regions of absorptions of ethanol at 1600–1900 nm related to O-H combinations (Xiaobo et al. 2010), C-H stretch first overtones (Liu et al. 2008, Xiaobo et al. 2010), and 2200–2300 nm related to C-H combinations vibrations and overtones of ethanol and sugars (Osborne et al. 1993, Dambergs et al. 2002, Cozzolino et al. , Da Costa Filho 2009, Shen et al. ). The 1200-nm region is related to sugars (González-Caballero et al. 2010). Spectral variations at 990 nm were produced by the O-H stretch second overtones from sugars and organic acids. Absorptions were observed at 1690 nm related to either C-H3 stretch first overtone, and at 1750 nm related to C-H2, C-H stretch first overtones in glucose, ethanol and water (Liu et al. 2008, Ferrari et al. 2011). Absorption at 2260 nm was likely related to O-H stretch overtones for glucose.
In the UV region, 202 and 230 nm were the peaks with the highest responses. These are associated with carboxyl groups of organic acids (Shen et al. 2010, Cozzolino et al. 2011a, Ferrari et al. 2011). Figure 1b shows the transformed spectra by second derivation, and demonstrates that the features of the spectra are improved after processing.
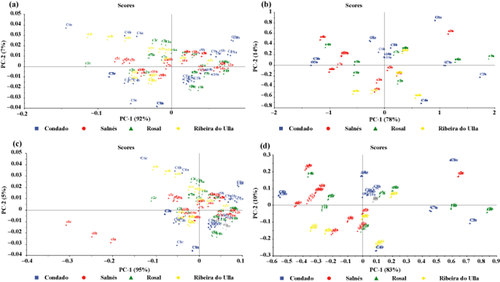
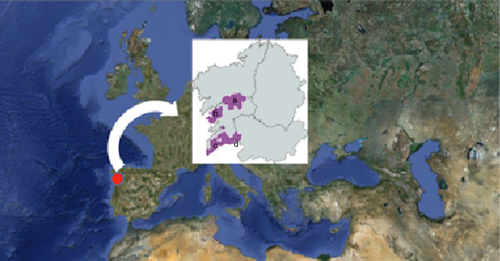
PCA was performed on UV/VIS/NIR (190–2500 nm), NIR (780–2500 nm), VIS (400–780 nm), UV (190–400 nm), UV/VIS (190–780 nm) and VIS/NIR (400–2500 nm) spectral zones of the wine samples. PCA was applied to raw data, SNV, smoothing and 2a-derived data to examine grouping of samples related to subzones of origin and significant differences between subzones of origin. Figure 2a–d shows the score plots of the raw data for the VIS zone, the SNV data for the UV zone, the smoothing data for the VIS zone and the 2a-derived data for the UV/VIS zone. Each plot describes the 99, 92, 100 and 93%, respectively, of the total variance of the VIS, UV and UV/VIS zones of the wine samples analysed. Figure 3 shows the map of Rías Baixas. There is no clear separation of wine samples according to their subzones in the DO Rías Baixas. Wines of subzones Salnés and Condado, however, were better separated from those of other subzones.

Two-dimensional principal component score plot for Rías Baixas samples. (a) Visible (VIS) zone of raw data, (b) ultraviolet (UV) zone of standard normal variate (SNV) data, (c) VIS zone of smoothing data, and (d) UV-VIS zone of 2a-derived data.

Map of designation of origin (DO) Rías Baixas. Red shows the different subzones in the DO: (a) Ribeira do Ulla, (b) Salnés, (c) Rosal, and (d) Condado.
Some samples are overlapped, but there is a tendency towards sample separation. This trend could be influenced by the microclimate of subzones, which have little separation. In the other samples (Rosal and Ribeira do Ulla), however, there was no tendency to separate.
Table 2 shows the best LDA classification of wines according to their subzone in Rías Baixas for each range of the spectra studied. The best total classification was obtained in the UV/VIS/NIR spectra with 86.04%, followed by VIS/NIR spectra with 81.67% and the VIS spectra with 80.63%. The UV and UV/VIS spectral ranges showed the poorest classifications. For the subzones, 100% classifications were obtained for Condado using the VIS range and for Rosal using the VIS/NIR range. The poor classification using UV or UV/VIS suggests that phenolic compounds do not explain the differences among wines in the subzones of DO Rías Baixas.
| UV/VIS/NIR (%) | NIR (%) | VIS (%) | VIS/NIR (%) | UV (%) | UV/VIS (%) | |
|---|---|---|---|---|---|---|
| Condado | 93.33 | 93.33 | 100 | 93.33 | 50 | 53.33 |
| Rosal | 87.5 | 95.83 | 83.33 | 100 | 75 | 75 |
| Salnés | 90 | 86.67 | 73.33 | 86.67 | 66.67 | 60 |
| Ribeira do Ulla | 73.33 | 46.67 | 66.67 | 46.67 | 80 | 80 |
| Total classification | 86.04 | 80.63 | 80.83 | 81.67 | 67.92 | 67.08 |
- DO, designation of origin; LDA, linear discriminant analysis; NIR, near-infrared; UV, ultraviolet; VIS, visible.
Table 3 shows the SIMCA classification obtained. Classification was 100% using the UV/VIS/NIR, NIR and VIS spectra ranges for Condado. Salnés and Ribeira do Ulla were 100 % classified using the UV/VIS range.
| UV/VIS/NIR (%) | NIR (%) | VIS (%) | VIS/NIR (%) | UV (%) | UV/VIS (%) | |
|---|---|---|---|---|---|---|
| Condado | 100 | 100 | 60 | 100 | 26,67 | 0 |
| Rosal | 50 | 0 | 0 | 12,5 | 100 | 0 |
| Salnés | 0 | 0 | 30 | 10 | 0 | 100 |
| Ribeira de Ulla | 73.33 | 0 | 20 | 40 | 80 | 100 |
| Total classification | 55.83 | 25.00 | 27.50 | 40.63 | 51.67 | 50.00 |
- NIR, near-infrared; SIMCA, soft independent modelling of class analogy; UV, ultraviolet; VIS, visible.
In general, total classification rates were lower than those obtained by the LDA classification method. In the SIMCA classification, there was a high misclassification of certain subzones.
The SVM classification was 100% for Condado using the UV/VIS/NIR and UV/VIS ranges, and for Salnés using the VIS range (Table 4).
| UV/VIS/NIR (%) | NIR (%) | VIS (%) | VIS/NIR (%) | UV (%) | UV/VIS (%) | |
|---|---|---|---|---|---|---|
| Condado | 100 | 93.33 | 90 | 96.67 | 60 | 100 |
| Rosal | 87.50 | 95.83 | 95.83 | 95.83 | 70.83 | 83.33 |
| Salnés | 90 | 96.67 | 100 | 96.67 | 90 | 90 |
| Ribeira do Ulla | 60 | 53.33 | 46.67 | 40 | 60 | 60 |
| Total classification | 84.38 | 84.79 | 83.12 | 82.29 | 70.21 | 83.33 |
- DO, designation of origin; NIR, near-infrared; SVM, support vector machine; UV, ultraviolet; VIS, visible.
Seven additional samples from other DOs were spectrally measured and classified with SIMCA classification. Classification analysis showed that all of these samples did not belong to the DO Rías Baixas.
Conclusions
The UV, VIS and NIR spectra, and their combinations, together with chemometric tools, can classify subzones from DO Rías Baixas.
Condado wines can be 100% classified by applying SIMCA to the UV/VIS/NIR, NIR or VIS/NIR spectral ranges. Salnés and Ribeira de Ulla wines can be 100% classified by applying SIMCA to the UV/VIS spectral range, and Rosal wines can be 100% classified by applying LDA to the VIS/NIR spectral range.
The models also differentiate wines that are not from DO Rías Baixas. Thus, this technique can be used for authentication purposes.


