Stable isotope data from bonobo (Pan paniscus) faecal samples from the Lomako Forest Reserve, Democratic Republic of the Congo
1 INTRODUCTION
Behavioural observations of bonobos (Pan paniscus) have revealed that their preferred foods are fruit, yet they consume terrestrial herbaceous vegetation (THV) throughout the year (Badrian, Badrian, & Susman, 1981; Badrian & Malenky, 1984; White, 1992). THV accounts for ~2% of bonobo diets but many bonobo sites are characterised by dense understories, obscuring feeding observations on the ground. THV has been viewed as an important food source for P. paniscus, and some evidence suggests that the THV consumed by bonobos bears higher nutritional yields than that consumed by chimpanzees (Pan troglodytes) in East Africa (Malenky & Wrangham, 1994).
Stable isotope analysis has been used to supplement feeding observations of nonhuman primates (NHPs) and has helped further our knowledge of the dietary patterns of Pan spp. (Loudon, Sandberg, Wrangham, Fahey, & Sponheimer, 2016; Schoeninger, Most, Moore, & Somerville, 2016). The δ13C and δ15N values of an animal reflect the foods they ate and are permanently recorded in their tissues or excreta (Sandberg, Loudon, & Sponheimer, 2012). Since NHPs consume plants, botanical δ13C and δ15N values aid interpretations of their stable isotope compositions. Most tropical grasses use the C4 photosynthetic pathway and have tissue δ13C values between −11‰ and −14‰ (O'Leary, 1988). In contrast, trees, shrubs and temperate grasses follow the C3 photosynthetic pathway and have δ13C values averaging about −27‰ and range between −23‰ and −31.5‰. The range of δ13C values in C3 plants is in part due to a “canopy effect.” Plants growing under dense canopy cover have lower δ13C values than plants in open areas due to the incorporation of 13C-depleted CO2 produced by decaying leaves (Medina & Minchin, 1980) and lower light intensities (Ehleringer, Field, Lin, & Kuo, 1986). Plant organs also vary in carbon isotope compositions with nonphotosynthetic organs typically exhibiting higher δ13C values compared to leaves (Codron et al., 2005). Nitrogen isotopic variation is more difficult to interpret. However, animal tissues are usually 15N-enriched relative to diet and there is a stepwise increase in δ15N values (~3‰) with each trophic level (Schoeninger & DeNiro, 1984).
We explore the stable isotope ecology of P. paniscus through analysis of faeces from the Iyema bonobos inhabiting the Lomako Forest in the Democratic Republic of the Congo (DRC). To contextualise these data, we compare them to stable isotope data from hair (after transformation to hair-equivalent values) collected from other Pan communities and to the δ13C and δ15N values of available plants from other Pan sites. Based on the structural attributes of the Lomako forests, we expect the Iyema community will exhibit lower δ13C values compared to Pan communities living in forests with discontinuous canopies or communities in anthropogenically disturbed forests or open savannahs (Loudon et al., 2016). We predict that the Iyema δ13C and δ15N values should align closely to the values of the LuiKotale bonobo community based on the canopy cover and the feeding ecology of each community (Oelze et al., 2011; White, 1992). We also predict that the Iyema bonobos stable isotope compositions will closely resemble Lomako fruit values and should overlap on isotopic bi-plots.
2 MATERIALS AND METHODS
Fifty-seven bonobo faecal samples were collected from the Iyema field site in the Lomako Forest (00°55′N, 21°06′E) located in the DRC in June–July 2014. Iyema is a ~16-km2 study area, consisting of primary rainforests and some secondary rainforests and swamp forests (White, 1992). The forest floor is carpeted with THV, and all levels of the canopy are characterised by dense foliage consisting of shrubs, lianas and trees of various heights forming a continuous canopy (Badrian & Malenky, 1984). The bonobos are semi-habituated, and a best abundance estimation model suggests there are 26–66 individuals in the community (Brand et al., 2016). Faecal samples were collected after defecation, and we recorded the date, geographic location and, when possible, the age/sex of the individual. For some individuals, we collected multiple samples. Faeces provide stable isotope data on the undigested portion of an individual's diet on the order of days, limiting our abilities to examine seasonal differences but provide short-term feeding data. We collected plant organs (i.e., fruits, leaves, piths and seeds) from three different heights including ground level (0–2 m), mid-canopy (2–10 m) and high canopy (10+ m). We also collected from lianas that originated in the mid- or high canopy and drew nutrients from trees, and then grew downward. We note lianas specifically, since their δ13C values can be impacted by the height at which they drew nutrients. All samples were dried on-site using a camp stove and placed in labelled bags with desiccant. This research complied with the University of Oregon's Institutional Animal Care and Use Committee (#12-09), adhered to the legal requirements of the DRC, and was approved by the Institut Congolais pour la Conservation de la Nature (#0492).
Samples were ground into powder, weighed to ~1.5 mg, placed in tin capsules and combusted in an elemental analyser for stable carbon and nitrogen isotope abundances using a flow-through inlet system on a continuous flow isotope ratio mass spectrometer. 13C/12C and 15N/14N ratios are expressed using the delta (δ) notation in parts per thousand or permil (‰) relative to the Vienna PeeDee Belemnite (VPDB) and atmospheric N2 (AIR) standards, respectively.
To examine the relationship between the stable isotope values of the Iyema bonobos and the plants at Lomako, we added 0.7‰ to the δ13C values and subtracted 2.0‰ from the δ15N values of faeces (Sponheimer, Robinson, Ayliffe, et al., 2003). To compare the Iyema values to published hair stable isotope compositions from other chimpanzee and bonobo communities, we adjusted the faecal values to their hair equivalents by adding 3.7‰ to the faecal δ13C values (Sponheimer, Robinson, Ayliffe, et al., 2003) and 1.0‰ to the faecal δ15N values (Sponheimer, Robinson, Roeder, et al., 2003). To control for changes in the δ13C compositions of atmospheric CO2 linked to the burning of fossil fuels (McCarroll & Loader, 2004), we added 1.83‰ to the Iyema δ13Chair values. Previously published hair isotope data were adjusted to pre-industrial equivalents, and the Pan data sets required to make such adjustments are available here: https://figshare.com/articles/Supporting_Data_Loudon_et_al_2016_AJP/3179371
We compared the bonobo communities to three broad habitat categories inhabited by P. troglodytes that we refer to as “forest,” “savannah” and “anthropogenically-disturbed.” Those communities inhabiting environments with a grass understory are defined as “savannah.” We compared the δ13C and δ15N values of plants collected at Lomako to those from Kibale (Blumenthal, Rothman, Chritz, & Cerling, 2016), Loango (Oelze, Head, Robbins, Richards, & Boesch, 2014), Salonga (Oelze et al., 2011) and the Tai National Forest (Fahy, Richards, Riedel, Hublin, & Boesch, 2013). We used Welch's analysis of variance (ANOVA) and Tukey's honest significant difference (HSD) pairwise tests to compare the δ13C and δ15N values of plants, faeces, or hair, for each community or habitat category (α = 0.05).
3 RESULTS AND DISCUSSION
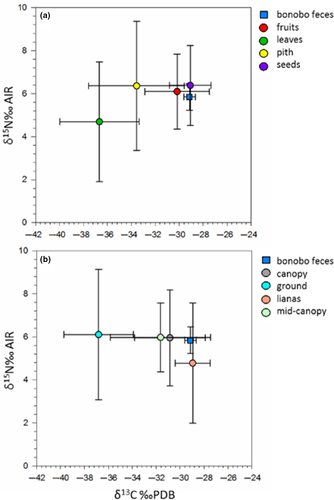
To date, the Iyema bonobo δ13Cfaecal values are the lowest published for any Pan community (−29.9‰ ± 0.5, n = 57) and they have among the highest δ15Nfaecal values (7.8 ± 0.6‰, n = 57; see Supporting Information Table S1 for bonobo data). The bonobo faecal stable isotope data are driven by the Lomako plants which have very low δ13C values (−32.0‰ ± 4.0, n = 39) and high δ15N values (5.8‰ ± 2.2, n = 39; plant data are presented in Supporting Information Table S2). When we converted the δ13Cfaecal and δ15Nfaecal values to their dietary equivalents, the Iyema bonobos had diets with isotopic compositions similar to seeds and fruits, and their diets were isotopically similar to nonleaf canopy plant parts (Table 1; Figure 1). These data accord well with observations and faecal analyses collected at Lomako. Badrian et al. (1981) observed that fruit accounted for 49% of the bonobo diet, Badrian and Malenky (1984) found that fruit consisted of 54% of their diet, and White (1992) found that fruit accounted for 72% of feeding observations. The high δ15Nfaecal values of the Iyema bonobos are consistent with a fruit-rich diet, although piths and seeds are good fits from this perspective. The δ13Cfaecal and δ15Nfaecal data are most consistent with the Iyema bonobos having diets of chiefly fruits and/or seeds when plotted in isotopic bi-space (Figure 1). In terms of canopy stratification, White (1992) found that the Lomako bonobos spent 5.4% of all observations on the ground and feeding on THV accounted for 2.1% of observations. Analyses of Lomako THV suggest it provides high nutritional yields (Malenky & Stiles, 1991; Malenky & Wrangham, 1994) and that it is used as a protein source for the bonobos (White, 1996). However, isotopically, we could not detect the consumption of THV, which is consistent with its consumption being rare as noted by White (1992). In general, the stable isotope data suggest that the Iyema bonobos preferentially eat plants at the canopy and mid-canopy including lianas which originate at these strata (Figure 1).
| Plant organ | N | δ13C‰ | δ15N‰ | Height | N | δ13C‰ | δ15N‰ |
|---|---|---|---|---|---|---|---|
| Fruit | 20 | −30.2 ± 2.7 | 6.1 ± 1.8 | Ground (0−2m) | 7 | −36.8 ± 2.9 | 6.1 ± 3.0 |
| Leaves | 9 | −36.7 ± 3.3 | 4.7 ± 2.8 | Mid-canopy (2−10m) | 14 | −31.6 ± 4.2 | 6.0 ± 1.6 |
| Pith | 5 | −33.6 ± 4.0 | 6.4 ± 3.0 | Canopy (>10m) | 13 | −30.9 ± 3.0 | 6.0 ± 2.2 |
| Seed | 5 | −29.1 ± 1.7 | 6.4 ± 1.8 | Lianaa | 5 | −28.9 ± 1.5 | 4.8 ± 2.8 |
| Bonobosb | 57 | −29.2 ± 0.5 | 5.8 ± 0.6 | Bonobosb | 57 | −29.2 ± 0.5 | 5.8 ± 0.6 |
Notes
- The δ13C data presented here were not corrected for the burning of fossil fuels.
- a Lianas are vines that grew from the mid- or high canopy downward, drawing nutrients from trees at that strata and thus impacting their carbon stable isotope values.
- b The bonobo values presented here reflect faecal-diet offsets by adding 0.7‰ to the δ13Cfaecal values and subtracting 2.0 to the δ15Nfaecal values.

We found differences in the δ13Cplant (F4, 87.7 = 13.7; p < 0.0001) and δ15Nplant values (F4,93.6 = 8.8; p < 0.0001) among the five Pan communities (Supporting Information Table S3). The δ13C values of the Lomako plants are lower than the plants at Salonga (p < 0.0001), which is inhabited by the LuiKotale bonobos (Oelze et al., 2014), and the plants at Kibale (p < 0.0001). Differences in foliar δ13C values across wide geographic regions are influenced by mean annual precipitation (Loudon et al., 2016). The differences in the δ13C values between Salonga and Lomako occurred despite both sites are characterised by continuous canopies. Moreover, at Lomako, we found that the ground-level plants had δ13C values that were 5.9‰ lower than those of canopy plants (Supporting Information Table S3). In the closed canopy forests of Kibale, differences between the δ13C values of leaves collected in the understory versus the subcanopy and canopies were ~2.9‰ (Blumenthal et al., 2016). Despite the differences in the δ13C values of the plants at these sites, the Salonga and Kibale forests are both characterised by continuous canopies.
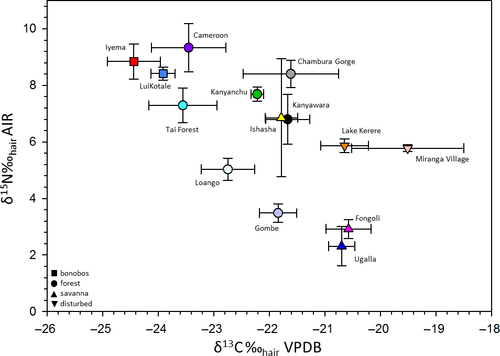
We found differences in the δ13Chair (F13,46.2 = 271.3; p < 0.0001) and δ15Nhair values among the 14 Pan communities (F13,44.1 = 636.8; p < 0.0001; Table 2; Figure 2). Pairwise comparisons revealed that the Iyema bonobos had lower δ13Chair values (p < 0.001) than all the communities, and higher δ15Nhair values (p < 0.0001) for nine of the communities, with the exceptions being Cameroon, Kanyanchu, Chambura Gorge and LuiKotale. Comparisons between the Pan ecological categories (i.e., bonobos and P. troglodytes in “forest,” “savannah” and “anthropogenically-disturbed habitats”) yielded differences in δ13Chair (F3,54.7 = 523.8; p < 0.0001) and δ15Nhair values (F3,97.2 = 491.9; p < 0.0001; Table 2 and Supporting Information Figure S1). Pairwise comparisons showed that the bonobo communities exhibited lower δ13Chair values (p < 0.0001) and higher δ15Nhair values (p < 0.0001) than the Pan communities living in the other ecological categories.
| Site | Rainfall (mm) | N | δ13C‰ | δ15N‰ | Reference for isotope data |
|---|---|---|---|---|---|
| Lake Kerere (Uganda) | 1,750 | 9 | −20.6 ± 0.4 | 5.9 ± 0.2 | Loudon et al., 2016 |
| Miranga Village (Uganda) | 1,700 | 5 | −19.5 ± 1.0 | 5.8 ± 0.1 | Loudon et al., 2016 |
| “Disturbed forest” P. troglodytes | 14 | −20.2 ± 0.9 | 5.8 ± 0.2 | ||
| Cameroon | 1,700 | 38 | −23.5 ± 0.7 | 9.3 ± 0.8 | Macho & Lee-Thorp, 2014 |
| Chambura Gorge (Uganda) | 950 | 7 | −21.6 ± 0.9 | 8.4 ± 0.5 | Loudon et al., 2016 |
| Gombe (Tanzania) | 1,250 | 13 | −21.8 ± 0.3 | 3.5 ± 0.3 | Schoeninger et al., 2016 |
| Kanyanchu (Uganda) | 1,500 | 4 | −22.2 ± 0.1 | 7.7 ± 0.3 | Loudon et al., 2016 |
| Kanyawara (Uganda) | 1,671 | 6 | −21.7 ± 0.4 | 6.8 ± 0.9 | Loudon et al., 2016 |
| Loango (Gabon) | 2,215 | 14 | −22.8 ± 0.5 | 5.0 ± 0.4 | Oelze et al., 2014 |
| Tai National Forest (Côte d'Ivoire) | 1,830 | 31 | −23.6 ± 0.6 | 7.3 ± 0.6 | Fahy et al., 2013 |
| “Forest” P. troglodytes | 113 | −23.0 ± 0.9 | 7.3 ± 2.1 | ||
| Fongoli (Senegal) | 900 | 36 | −20.6 ± 0.4 | 2.9 ± 0.3 | Sponheimer et al., 2006 |
| Ishasha (DRC) | 750 | 9 | −21.8 ± 0.3 | 6.9 ± 2.1 | Schoeninger et al., 1999 |
| Ugalla (Tanzania) | 1,012 | 8 | −20.7 ± 0.3 | 2.3 ± 0.7 | Schoeninger et al., 1999 |
| “Savannah” P. troglodytes | 58 | −20.8 ± 0.6 | 3.5 ± 1.8 | ||
| Iyema (DRC) | 2,000 | 57 | −24.4 ± 0.5 | 8.8 ± 0.6 | This study |
| LuiKotale (DRC) | 2,000 | 33 | −23.9 ± 0.2 | 8.4 ± 0.2 | Oelze et al., 2011 |
| “Bonobos” P. paniscus | 90 | −24.2 ± 0.5 | 8.7 ± 0.5 |
Note
- All δ13Chair values presented here have been adjusted to account for the burning of fossil fuels.

Carbon isotope analyses of “savannah” chimpanzee communities have proven useful for understanding the behaviour and ecology of extinct hominins, and it is thought that “savannah” Pan and early hominins utilised similar biomes (Schoeninger, Moore, & Sept, 1999; Sponheimer et al., 2006). The stable carbon isotope compositions of these “savannah” communities are indistinguishable from those of Ardipithecus ramidus and Australopithecus anamensis (Loudon et al., 2016). In stark contrast, the δ13C values of the Iyema community resemble those of Gigantopithecus sp. (Nelson, 2014; Qu et al., 2014) which probably ate plants within a closed canopy and may have preferentially consumed THV which seems likely given its large body size.
Carbon isotope data for extinct and extant hominoids have revealed a continuum of habitat and dietary patterns. On one end of this continuum lie the modern-day bonobo communities that yield the lowest δ13C values and consume C3 plants growing in rainforests with continuous canopies. In contrast, “savannah” chimpanzees occupy the other end of the continuum whose values align with consumption of plants in open environs and resemble some species of Ardipithecus and Australopithecus (Sponheimer et al., 2013).
ACKNOWLEDGEMENTS
We thank Jef Dupain and the African Wildlife Foundation-Kinshasa for facilitating permits and logistical support. We are indebted to the Iyema field staff for their invaluable assistance. We thank Michaela and Pants France Howells. Research was funded by East Carolina University's Undergraduate Research and Creativity Award, Northern Kentucky University's Faculty Summer Fellowship and Faculty Project Grant, the Leakey Foundation and National Science Foundation.


