Classification of Prosopis juliflora invasion in the Lake Baringo basin and environmental correlations
Abstract
enThe spread of Prosopis juliflora in the Baringo basin, Kenya, has led to severe changes in the ecosystem with negative socio-economic impacts. The drivers that foster the invasiveness of Prosopis are not fully understood. Thus, a method to quantify the degree of infestation will support the determination of environmental preferences and the risk assessment of future Prosopis invasion. We developed a methodology for characterising and classifying degrees of Prosopis infestation in vegetation stands and propose its application in environmental correlation models. The relative cover was identified as the most suited attribute for assessing and monitoring the invasion of Prosopis. The distance of invaded stands from original plantations and environmental attributes related to water availability (ground water table, rainfall and soil water–holding capacity) have potential to predict potential or future invasion risks.
RÉSUMÉ
frL'invasion de Prosopis juliflora dans le bassin de Baringo, au Kenya, a entraîné de profonds changements dans l'écosystème, avec des impacts socio-économiques négatifs. Les facteurs qui favorisent l'invasion de Prosopis ne sont pas entièrement compris. Ainsi, une méthode permettant de quantifier le degré d'infestation aidera la détermination des préférences environnementales et l'évaluation des risques de la future invasion de Prosopis. Nous avons développé une méthodologie pour caractériser et classifier des degrés d'infestation de Prosopis dans les peuplements végétaux et proposer son application dans les modèles de corrélation environnementale. La couverture relative a été identifiée comme l'attribut le plus approprié pour évaluer et surveiller l'invasion de Prosopis. La distance des peuplements envahis des plantations d'origine et des attributs environnementaux liés à la disponibilité d'eau (nappe phréatique, précipitations et capacité de rétention d'eau du sol) ont le potentiel de prédire les risques d'invasion potentiels ou futurs.
1 INTRODUCTION
Non-native plants, with large dispersal capacity and causing negative ecological, economic and social impacts, are labelled as invasive species (Richardson et al., 2000; Wakie, Evangelista, Jarnevich, & Laituri, 2012). Several species of the genus Prosopis are considered among the most threatening invasive species worldwide (Shackleton, Le Maitre, Pasiecznik, & Richardson, 2014) and Prosopis juliflora (Sw.) DC. (henceforth called just Prosopis) is one prominent example. Prosopis is native to northern South America (Venezuela and Colombia), Central America and the Caribbean Islands (Burkart, 1976), but it is currently widespread throughout the tropics (Catalano, Vilardi, Tosto, & Saidman, 2008; Kaur et al., 2012). It has been spread globally and has become naturalised and invasive in many places (Rejmánek and Richardson, 1996), as reported for Brazil (Gonçalves, Alves de Andrade, Gonçalves, Bezerra de Oliveira, & Dias, 2013), Australia (Robinson, van Klinken, & Metternicht, 2008) or for India (Tewari et al., 2013).
Prosopis was introduced to Kenya in 1973 through a government initiative to restore quarries near Mombasa. Ten years later, it was brought to the Baringo County to increase the availability of fire wood and to restore soils affected by heavy erosion. The invasive spread started from the original plantation sites in the late 1990s, invading the local vegetation and increasingly restricting physical access to lake shores and river banks (Coppock, Aboud, & Kisoyan, 2005). This trend is consistent with other Prosopis introductions turning to invasions in Kenya as described by Kyuma, Wahome, Kinama, and Wasoga (2016) for Magadi County, Zeila (2011) for Garissa County and Muturi, Mohren, and Kimani (2010) for Turkwell County.
Several factors contribute to Prosopis species becoming successful invaders. Thus, seed dispersal by endozoochory has been claimed as one of the most important autecological drivers of invasive spread, especially due to its facilitation by abundant and widespread free-roaming livestock in the area (Alvarez, Leparmarai, Heller, & Becker, 2017; Becker et al., 2016). Another factor contributing the competitive ability of Prosopis is the release of allelochemicals, inhibiting growth of other species and resulting in low plant diversity under the canopy of Prosopis (Getachew, Demissew, & Woldemariam, 2012). Additionally, rapid growth rates and the ability to coppice after damage, pruning or fire (Shiferaw, Teketay, Nemomissa, & Assefa, 2004) can favour its invasive spread and make an eradication of Prosopis almost impossible. Being a phreatophyte, Prosopis develops two types of root systems, horizontal roots in the topsoil layer close to the surface and a taproot penetrating into deep soil layers for reaching the water table (Yoda, Elbasit, Hoshino, Nawata, & Yasuda, 2012). This is consistent with observations of Ayanu et al. (2015), who reported Prosopis invasion to occur mainly in floodplain wetlands with shallow groundwater tables. Such sites have initially been dominated by Vachellia tortilis (Forssk.) Galasso & Banfi woodlands (see also Muturi, Poorter, Mohren, & Kigomo, 2013).
Apart from the water table depth, the establishment of individuals and the invasion of Prosopis may also be related to other environmental variables, including climate, soil type, landscape forms and land uses. An important step to study causes and drivers of invasion at landscape scale is to define degrees of infestation in a way that can be objectively measured, repeatable and comparable and to relate the extent of the invasion to biophysical landscape or land management attributes. In this context, geographic information systems and modelling algorithms are increasingly being used to map both the current and the potential future distribution of invasive species (Wakie et al., 2012). Such approaches are currently hampered in the case of Propsis invasion by a lack of available methods to quantify the degree of infestation and the variability of invaded stands.
The aim of this work is thus to develop such a methodology for characterising and classifying degrees of infestation in vegetation and to apply this typology to derive environmental preferences of Prosopis in view of predicting and mapping the future invasion potential.
2 MATERIALS AND METHODS
2.1 Study site
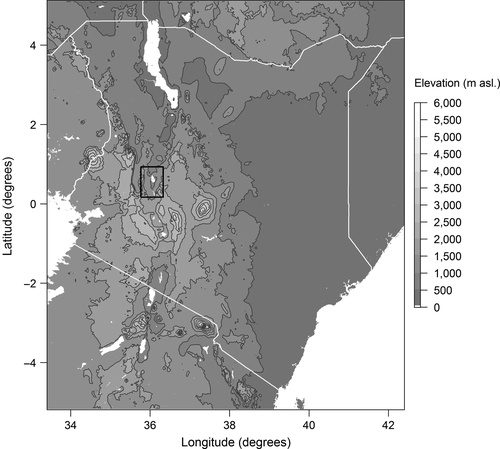
Data were collected and samples taken from the Eastern Rift Valley, in an area between the basins of Lake Baringo in the North and Lake Bogoria in the South (Figure 1). This area is characterised by an annual rainfall of 450–900 mm (Odada, Onyando, & Obudho, 2006) and a mean temperature of 24.6°C (Fick & Hijmans, 2017). The geological basement is composed by basalt plateaus, which are cracked and tilted due to tectonic movements, alternating with sedimentary deposits of clay and loam (Alvarez et al., 2017; Touber, 1989). The dominant vegetation in the area has been described as Acacia-Commiphora bushlands (Lillesø et al., 2011) and V. tortilis (formerly Acacia tortilis) woodlands (Alvarez et al., 2017). The main land use is pastoralism, dominated by goats and cattle. Crop cultivation is patchy and restricted to the short wet season, with exception of the irrigation schemes of Perkerra, Ng'ambo, Eldume and Sandai (see figure 5 in Andersson, 2005).
2.2 Samples collection
The sampling strategy followed the approach suggested by Beuel et al. (2016). The map of the study area was gridded into 250 m by 250 m tiles, and 57 tiles were preferentially selected for detailed mapping. The selection aimed at an even distribution of sampling tiles across the area, avoiding large gaps between selected tiles. Tiles reflected the observed variability in the degree of Prosopis infestation and dominating vegetation physiognomy. The selected tiles were differentiated into polygons of homogeneous physiognomy (“assessment units”) and were mapped using a GPS device (Garmin eTrex 30). Within each assessment unit, a 10 m by 10 m plot was established for detailed recording of vegetation structures. In total, 72 assessment units in 57 tiles were surveyed. All occurring vascular plants were listed, and their percentage cover was estimated. In those cases where multiple layers were recognised (e.g. herb, shrub and tree layers), the layers were used as sub-units in the vegetation records as suggested for “phyto-sociological relevés” (Braun-Blanquet, 1964). Since the focus of the study was the invasion with Prosopis, we estimated its total cover, its cover shares, density (individuals per m2) and maximum height (measured by TruPulse 200 device) in addition to the summed up cover of all vascular plants in the plot.
2.3 Classification of invasion
To quantify the degree of Prosopisinvasion, we applied the variables “maximum height,” “density,” “number of affected layers” and “cover.” The Prosopis cover was calculated both in relative and absolute terms, whereby the relative cover was calculated as the sum of Prosopis cover, divided by the cover sum of all plants occurring in the respective plot. The maximum height, the density, the number of affected layers, the relative cover and the absolute cover of Prosopis were used for a classification by hierarchical clustering. The dissimilarity between plots was quantified by Bray–Curtis index. A classification tree was generated using Ward's algorithm (Murtagh & Legendre, 2014). Variable values were re-scaled, setting mean values to 0 and the standard deviations to 1, and the relative and the absolute covers were weighted by a factor of 10. The relation between resulting classes and biophysical attributes of invaded stands (ordinal variables) was quantified by the Spearman rank correlation index (Dormann & Kühn, 2012).
2.4 Regression models
Simple regression related the relative cover of Prosopis to environmental attributes. Main factors considered comprised the macroclimate, the land form, groundwater depth, the soil type and the distance to the originally established Prosopis plantations. Macroclimatic variables such as annual mean temperature and rainfall, as well as their respective seasonality (referred to as BIO1, BIO4, BIO12, and BIO15 in the original data set) were extracted from the WorldClim 2 database (Fick & Hijmans, 2017). Land forms were inferred from a digital elevation model (DEM) with a resolution of 30 arcsec (SRTM version 3.0), calculating the topographic position index at a scale of 2,000 m (Weiss, 2001). The eastness was calculated by overlaying a circle of 300 m radius (10 pixels of the DEM) around each pixel. Circles were divided into an eastern and a western half, and the mean elevation in each half was extracted using “moving windows.” Eastness was calculated as “west elevation minus east elevation,” with strong positive differences indicating steep slopes with eastern exposition, and strong negative differences indicating steep slopes with western exposition. Since the escarpment in the study area has a dominant north–south orientation, the northness was not calculated.
Groundwater depth was extracted from Fan, Li, and Miguez-Macho (2013) and tended to be related to land form (slope inclination) and elevation. Soil parameters were based on the Baringo area soil map (Touber, 1989), comprising the water holding capacity and the soil erosion index. Finally, the location of the original Prosopis plantations was used to calculate their distance from the assessment units. All raster data sets were processed to an identical spatial reference and resolution and associated to the exact geographical position of the respective pixel nodes.
 (1)
(1) (2)
(2)All analysis were done in R version 3.4.1 (R Core Team, 2017), including the packages dismo, quantreg, raster, rgdal, rgeos, sp and vegan.
3 RESULTS AND DISCUSSION
3.1 Classification of invaded stands
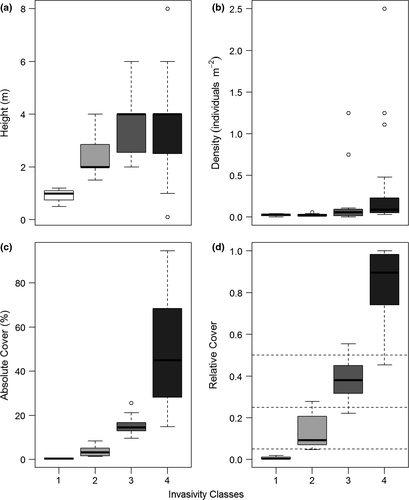
Four classes of vegetation stands invaded by Prosopis were defined by hierarchical clustering. Those classes can be categorised from nonsignificant, less concerning invasion (class 1) to strongly invaded stands (class 4). Invasion classes are associated with increasing maximum height, density of individuals, number of affected layers, and both, absolute and relative Prosopis cover (Table 1). This differentiation is visualised using boxplots of numerical variables (Figure 2). While most variables show overlaps between classes, the relative Prosopis cover does not, suggesting it as the best suited to discriminate between invasion classes. This overlap also highlights the variability of the measured attributes and variables. Thus the typical gradient from “stands of lower cover with small individuals” to “stands with high cover and tall individuals” is diversified by stands with “high cover but small individuals.” This latter category may refer to either young individuals with massive invasion or to high re-sprouting after logging activities as also reported by Shiferaw et al. (2004).
| Variable | Median | Spearman |
|---|---|---|
| Maximum height (m) | 4.00 | 0.31 |
| Density (individual m−2) | 0.07 | 0.44 |
| Affected layers | 2.00 | 0.24 |
| Absolute cover (%) | 27.57 | 0.79 |
| Relative cover | 0.70 | 0.86 |
While small patches cleared from formerly dense Prosopis stands reflect attempts to prepare land for crop cultivation, larger Prosopis-free areas reflect intense logging for charcoal production. The same explanation can be argued for the weak correlation between numbers of vegetation layers and the degree of Prosopis invasion.
Previous studies focussed mainly on the density of Prosopis individuals or on the distribution of breast height diameter (e.g. Muturi et al., 2010; Muturi et al., 2013). In the present work, we suggest that the relative cover of Prosopis may reflect more appropriately the complex structure of invaded stands. We consequently propose category boundaries of relative cover at 0.05, 0.25 and 0.5, resulting in four classes (see dashed lines in Figure 2d). This variable is also directly linked to stands' physiognomy and it is fast to record in the field. Additionally, the relative cover may be easier to detect by remote sensing than density or breast height stem diameters.
3.2 Environmental correlations
Eleven variables were used to predict potential invasion by Prosopis. In four cases, the relation to relative cover of Prosopis was best described by a logistic function, with soil water–holding capacity having a positive relation, while distance to plantation, soil erosion and rainfall seasonality show negative relations (Table 2). Seven variables (annual rainfall, temperature seasonality, groundwater table, eastness, mean temperature, elevation and topographic position index) show unimodal effects and were thus described by a Gaussian function (Table 2).
| Predictor | Units | RMSE | ME | Relation | Optimum |
|---|---|---|---|---|---|
| Logistic responses | |||||
| Distance to plantation | m | 4.34 | −1.18 | Negative | – |
| Soil erosion class | – | 5.16 | −2.35 | Negative | – |
| Soil water–holding capacity | – | 5.29 | −6.48 | Positive | – |
| Rainfall seasonality | – | 6.71 | −81.14 | Negative | – |
| Gaussian responses | |||||
| Annual rainfall | mm | 4.72 | −21.24 | – | 657.9 |
| Temperature seasonality | – | 4.82 | −11.80 | – | 112.1 |
| Ground water table | m | 5.16 | −0.64 | – | 1.8 |
| Eastness | m | 5.19 | −0.02 | – | 2.3 |
| Mean temperature | °C | 5.21 | −127.74 | – | 24.0 |
| Elevation | m a.s.l. | 5.24 | −15.46 | – | 1,008.6 |
| Topographic position index | – | 5.88 | 0.00 | – | −0.6 |
All modelling efficiency (ME) values but topographic position index were negative, indicating that the predicted invasion was generally higher than the observed one. This outcome is consistent with the quantile regression, which is estimating an optimum answer, thus most of the observations may generate negative residuals (Cade & Noon, 2003). While ME values are highly scale-dependent, the root mean square error (RMSE) appeared relatively robust (Table 2).
A negative relation of Prosopis invasion with the distance to original plantations was expected, as plantations were the starting points of invasive spread (Figure 3a). While this relation is useful for simulating future spread dynamic (see Wilson et al., 2007), a documentation of plantation sites may not be available at other invaded localities. The observation that soil erosion was negatively related to Prosopis invasion may surprise as the area has been early reported as heavily affected by erosion (Snelder & Bryan, 1995). Nevertheless, Touber (1989) estimated the erosion at the Njemps flats as lower than at the slopes of the surrounding escarpments, probably on the sole basis of the steep slopes. Likewise, the observed negative relation of invasion to rainfall seasonality and the positive relation to soil water–holding capacity highlight the preference of Prosopis to conditions of ample and constant water availability both between and within years, as frequently associated with floodplain and riverine wetlands (Ayanu et al., 2015; Muturi et al., 2013). A relatively high optimum of Prosopis in response to mean temperature and temperature seasonality is indicative of its preference for hot and arid environments with high seasonal temperature fluctuation, as they occur in areas where Prosopis is native (Burkart, 1976).
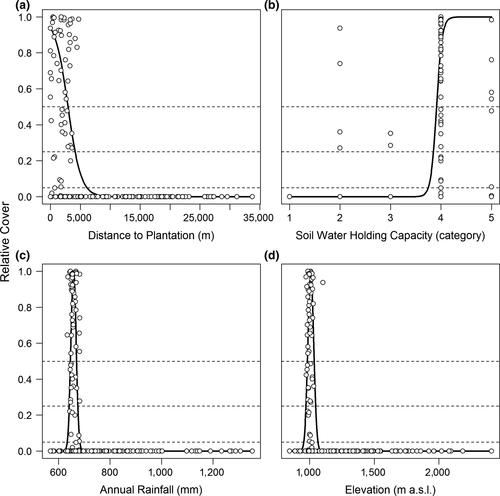
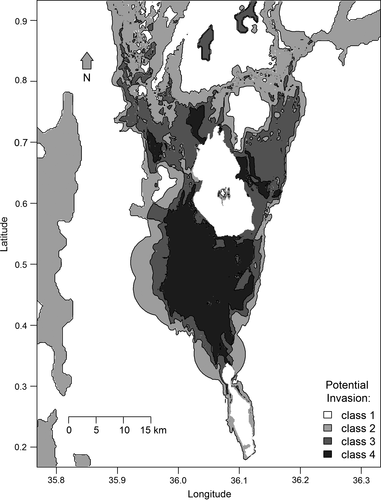
The relation between the observed and the predicted degrees of invasion is best described by logistic models for the attributes “distance to plantation” and “soil water–holding capacity” and by Gaussian models for “annual rainfall” and “elevation” (Figure 3). In these cases, quantile regression characterises well the upper limits of observed invasion in response to the respective environmental gradients. As a result, the areas with highest predicted future invasion risks (potential class 4) are concentrated in the area of the Njemps flats on the southern end of Lake Baringo and small areas at the north–western, northern and eastern sides of the same lake (Figure 4).
4 CONCLUSIONS, RECOMMENDATIONS AND OUTLOOK
The cost-efficiency of large-scale assessment of Prosopis invasion in Kenya and beyond will require remote sensing approaches. While the relative cover in vegetation stands has been shown to be the most suited attribute for assessing and monitoring the invasion with Prosopis, additional variables or stand attributes may improve and refine invasion classes at other sites. Also, the effects of Prosopis invasion on biodiversity will require further studies.


