A comparative analysis of sphenoid bone between domestic sheep (ovis aries) and goat (capra hircus) using geometric morphometrics
Abstract
The sphenoid bone forms the rostral part of the base of the neurocranium and is composed of two segments, the presphenoid [os praesphenoidale] and the basisphenoid [os basisphenoidale]. Rarely studied in osteology, we tested whether it can provide distinctive features between domestic sheep (Ovis aries L., 1758) and goat (Capra hircus L., 1758). For this goal, we studied a sample comprised by 53 dry modern skulls of adult sheep (n = 36) and goat (n = 17) subjects from a modern comparative collection by means of geometric morphometric techniques using a total of 26 anatomical points (2 saggital landmarks and 24 semilandmarks). Results showed that form (size + shape) differences appear between both species: sphenoid among sheep tends to be bigger, longer and wider than in goats, differences of width being mainly located on basisphenoid width.
1 INTRODUCTION
Cranial skeleton determination for domestic sheep (Ovis aries L., 1758) and goat (Capra hircus L., 1758) is perfectly addressed, but this can be conflictive when skull is incomplete or fragmented (Loreille et al., 1997). A clear example of this is the frequent presence in the osteoarchaeological faunal lists of the non-taxonomical ‘ovicaprine’ category (Loreille et al., 1997).
The sphenoid bone forms the rostral part of the base of the neurocranium and is composed of two segments, the presphenoid [os praesphenoidale], rostrally, and the basisphenoid [os basisphenoidale], caudally, which ossify in the adult (Barone, 1999) (König & Liebich, 2011). Hard palate has been relatively much investigated among domestic mammals (Halata et al., 1999) (Maala et al., 2007) (Encarnacion et al., 2015), but research on sphenoid bone is very scarce, at least at authors’ knowledge.
- Do shape and size for this bone interrelate?
- Can we differentiate sphenoid bone in sheep and goat?
- If yes, which are the most differentiated anatomical points of the bone between both species?
To authors’ knowledge, no morphometric analyses of this bone on sheep and goat have been carried out previously.
2 MATERIALS AND METHODS
The sample was comprised of 53 dry modern skulls of adult sheep (n = 36) and goat (n = 17) subjects. No skull presented craniofacial trauma. As the bones are separated by cartilage but ossifies with age, senile individuals were not sampled due to the difficulty to delimitate clearly sutures. Sex was not considered in this study as labelling of some of these specimens did not include this information, which are currently deposited in the Laboratory of Veterinary Anatomy, Department of Animal Science, University of Lleida, in Catalonia (Spain). No permits were required for this study, which moreover complied with sanitary regulations.
2.1 Imaging
Each skull was photographed on high resolution in standardised ventral view with a digital camera. Images were captured with a Nikon® D70 digital camera (image resolution of 2,240 × 1,488 pixels) equipped with a Nikon AF Nikkor® 28–200 mm telephoto lens. Scale was given for each photograph by placing a ruler. The images were then stored in JPG format.
2.2 Landmark selection
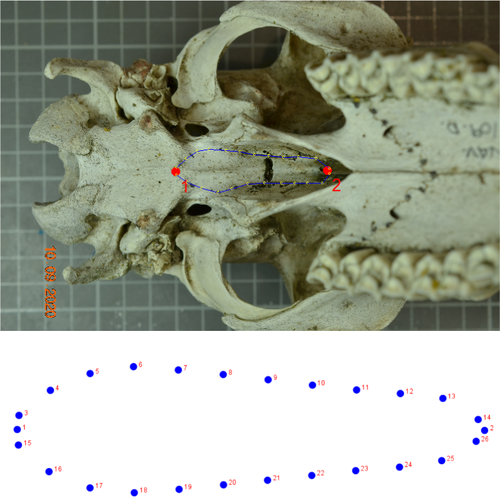
To analyse both segments of the sphenoid bone [corpus ossis (basi- et pre-)sphenoidalis], we used a set of 2 landmarks on the sagittal line and 24 paired semilandmarks for the contours (Figure 1). The x and y coordinates of chosen points were digitised using TpsDig 2.04 v. 1.40 (Rohlf, 2015). The file to determine the sliding direction of the semilandmarks was created in TpsUtil v. 1.70 (Rohlf, 2015). Since error can account for a significative fraction of between-side variance and alter the results, digitalisations were made twice by second author.

2.3 Statistical analysis
A Procrustes ANOVA with three factors (individual, side and interaction individual*side) was done to assess asymmetries and error. Comparison of sizes was done with a Mann–Whitney U test. Regressions of shape versus size, expressed as centroid size (log-transformed, and tested with 10,000 permutations), allowed the detection of allometries. Centroid size is defined as ‘the square root of the sum of the squared distances between each landmark and the centroid of the form’ (Webster & Sheets, 2010). A canonical variate analysis (CVA) determined whether both groups were statistically distinct for shape. A principal component analysis (PCA) was then run on the shape coordinate data for two groups to visualise the morphometric variation between them. Finally, thin plate spline deformation grids were obtained to visualise shape variation between both species.
Morphometric and statistical analyses were conducted using the MorphoJ v. 1.06c (Klingenberg, 2011) and PAST v. 2.17c (Hammer et al., 2001) packages. Confidence level was established at 95%.
3 RESULTS
3.1 Measurement error and asymmetries
In the Procrustes ANOVA, where three factors (individual, side and interaction individual*side) were analysed, error was very low, with a mere 7.2% (Table 1), for example it indicated a high degree of repeatability of the measurements. Side and the interaction of individuals and sides showed significant differences (p < .05), and Pillai's trace confirmed their presence (p < .0001). Ulterior analysis was then done using the symmetric component.
| Effect | SS | MS | Df | F | p |
|---|---|---|---|---|---|
| Centroid size | |||||
| Individual | 216.6308 | 4.165977 | 52 | 163.98 | <.0001 |
| Error | 1.346449 | 0.025405 | 53 | ||
| Shape | |||||
| Individual | 0.296675 | 0.000238 | 1,248 | 1.37 | <.0001 |
| Side | 0.006560 | 0.000273 | 24 | 1.57 | .0388 |
| Individual*side | 0.216841 | 0.000174 | 1,248 | 3.28 | <.0001 |
| Error | 0.134567 | 5.29E−05 | 2,544 |
3.2 Size differences
Mann–Whitney test reflected statistical differences between two species (U = 676, p = .0002106), being Ovis aries’ sphenoids clearly bigger.
3.3 Allometry
The multivariate regression of Procrustes coordinates of symmetric component (dependant variable) on size (log CS as independent variable) showed a significant influence of allometry for both species (17.0% and 18.4% for Ovis and Capra, respectively, p < .0001), so for the rest of analysis, residual regressions scores were used.
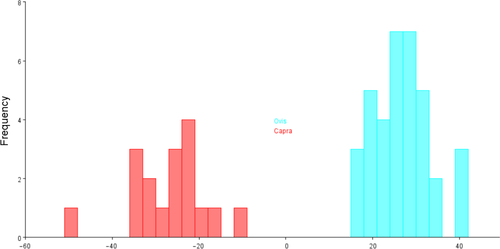
3.4 Canonical variate analysis
The separation achieved by the CVA is illustrated in Figure 2.

3.5 Principal component analysis
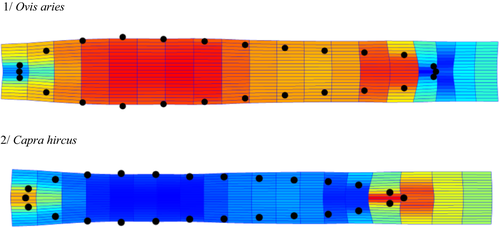
According to the results pf PCA, PC1 and PC2 represented a total of 60.24% (PC1 + PC2 = 41.20% + 19.04%) (Table 2). Changes were found greatest on length of rostral presphenoides [os praesphenoidale] (coordinates on horizontal axis x2, x14 and x26) and on width of medium part of basisphenoid [os basisphenoidale] (coordinates on vertical axis y6, y7, y18 and y19). Coordinates are shown in Table 3. The wider and shorter sphenoid bone of sheep compared to goats was finally corroborated visually by the thin plate splines (Figure 3).
| PC | Eigenvalues | % Variance | Cumulative % |
|---|---|---|---|
| 1 | 0.001101 | 41.201 | 41.201 |
| 2 | 0.000509 | 19.045 | 60.245 |
| 3 | 0.000299 | 11.210 | 71.456 |
| 4 | 0.000196 | 7.330 | 78.786 |
| 5 | 0.000121 | 4.527 | 83.313 |
| 6 | 9.98E−05 | 3.734 | 87.047 |
| 7 | 6.53E−05 | 2.445 | 89.492 |
| 8 | 3.97E−05 | 1.486 | 90.978 |
| 9 | 3.88E−05 | 1.452 | 92.430 |
| 10 | 3.45E−05 | 1.291 | 93.720 |
| 11 | 2.48E−05 | 0.926 | 94.646 |
| 12 | 1.92E−05 | 0.720 | 95.367 |
| 13 | 1.77E−05 | 0.662 | 96.028 |
| 14 | 1.56E−05 | 0.582 | 96.610 |
| 15 | 1.48E−05 | 0.553 | 97.163 |
| 16 | 1.23E−05 | 0.460 | 97.623 |
| 17 | 1.15E−05 | 0.432 | 98.055 |
| 18 | 1.06E−05 | 0.398 | 98.453 |
| 19 | 9.16E−06 | 0.343 | 98.796 |
| 20 | 8.37E−06 | 0.313 | 99.109 |
| 21 | 7.98E−06 | 0.299 | 99.408 |
| 22 | 6.3E−06 | 0.236 | 99.643 |
| 23 | 5.12E−06 | 0.192 | 99.835 |
| 24 | 4.4E−06 | 0.165 | 100 |
| PC1 | PC2 | |
|---|---|---|
| x1 | −0.17728 | 0.187535 |
| y1 | 0 | 0 |
| x2 | 0.118387 | 0.487141 |
| y2 | 0 | 0 |
| x3 | −0.14039 | 0.177553 |
| y3 | −0.00691 | 0.021318 |
| x4 | −0.07983 | 0.138166 |
| y4 | −0.07224 | 0.022012 |
| x5 | −0.00692 | 0.052071 |
| y5 | −0.16285 | −0.03609 |
| x6 | 0.038811 | −0.03670 |
| y6 | −0.31360 | −0.04691 |
| x7 | 0.043098 | −0.12987 |
| y7 | −0.33382 | −0.03364 |
| x8 | 0.037448 | −0.18090 |
| y8 | −0.26540 | −0.00592 |
| x9 | 0.016668 | −0.19338 |
| y9 | −0.21124 | 0.035679 |
| x10 | 0.018632 | −0.24213 |
| y10 | −0.18924 | 0.054375 |
| x11 | 0.009158 | −0.18984 |
| y11 | −0.16251 | 0.029488 |
| x12 | −0.00341 | −0.10645 |
| y12 | −0.11189 | −0.03788 |
| x13 | 0.007065 | 0.069039 |
| y13 | −0.07723 | −0.07820 |
| x14 | 0.089111 | 0.305093 |
| y14 | −0.01853 | −0.00142 |
| x15 | −0.14039 | 0.177553 |
| y15 | 0.006909 | −0.02132 |
| x16 | −0.07983 | 0.138166 |
| y16 | 0.07224 | −0.02201 |
| x17 | −0.00692 | 0.052071 |
| y17 | 0.162847 | 0.036088 |
| x18 | 0.038811 | −0.03670 |
| y18 | 0.313599 | 0.046909 |
| x19 | 0.043098 | −0.12987 |
| y19 | 0.333818 | 0.033636 |
| x20 | 0.037448 | −0.18090 |
| y20 | 0.265403 | 0.005922 |
| x21 | 0.016668 | −0.19338 |
| y21 | 0.21124 | −0.03568 |
| x22 | 0.018632 | −0.24213 |
| y22 | 0.189238 | −0.05438 |
| x23 | 0.009158 | −0.18984 |
| y23 | 0.162507 | −0.02949 |
| x24 | −0.00341 | −0.10645 |
| y24 | 0.111889 | 0.037877 |
| x25 | 0.007065 | 0.069039 |
| y25 | 0.077226 | 0.078201 |
| x26 | 0.089111 | 0.305093 |
| y26 | 0.018526 | 0.001424 |
Note
- Most discriminative coordinates (>[0.3]) appear in bold. Most variation was located on the basisphenoid [os basisphenoidale].

4 DISCUSSION
The central skull base is formed by the occipital and sphenoid bones (Shoghy & Saber, 2015), this latter being one of the most complex bones of the skull (Barone, 1999). Geometric morphometric analysis of the sphenoid bone size and shape reveals considerable phenotypic variability, but data points describing shapes tend to differentiate Ovis aries and Capra hircus. Form appeared different for both species, being that for sheep clearly bigger, wider and longer.
This information represents a novel step towards solving the sheep and goat identification issue in bone remnants, and it could be used to help the specific identification of specimens morphologically attributed to the non-taxonomic Ovis/Capra category. For further researches, it would be interesting to consider a wider age range and detect if there are differences between genders.
CONFLICT OF INTEREST
The authors declare no conflicts of interest to disclose related to this research.
AUTHORS CONTRIBUTION
PMPC conceived and designed the study and analysed the data. XD obtained and processed the images in two replicas. All authors interpreted the data, critically revised the manuscript for important intellectual contents and approved the final version.
SUPPORTING INFORMATION
The contents of all supporting data are the sole responsibility of the authors. Queries or any other issues regarding errors are requested to be addressed to first author.
Open Research
DATA AVAILABILITY STATEMENT
The data that support the findings of this study are available on request from the corresponding author, PMPC. The data are not publicly available.


