Is there an association between Vice-Chancellors’ compensation and external performance measures?
Abstract
We provide evidence on the pay for performance relation between Australian university Vice Chancellors’ compensation and independent measures of university teaching, research and other performance indicators provided by external ranking bodies. Our results show limited association between university rankings and Vice Chancellors’ compensation, but confirm that Vice Chancellors’ compensation is predominantly driven by size measures based on the different components of revenue. Further, we find that few universities offer performance-based bonus payments. Our results are robust with respect to a number of sensitivity tests.
1 Introduction
Over the last two decades, many countries have introduced performance-related compensation for senior executives of public-sector entities, using the principles of New Public Management (NPM).1 The underlying notion for this policy direction is that associating pay with performance leads to more efficient contracting and a better utilisation of public resources (Manning et al., 2012). Under NPM principles, Australian universities have become increasingly corporatised, and this has led researchers to examine different aspects of the compensation of Australian Vice-Chancellors (VCs). For example, Soh (2007) compares VCs’ compensation with the compensation of chief executive officers (CEOs) in the private sector and finds that during the late 1990s and early 2000s, VCs’ compensation approximates 50–60 percent of private sector CEOs’ compensation. Clements and Izan (2008) provide evidence on universities’ executive pay for the period 1999–2004 and indicate executive compensation has increased at double the rate of teaching and research academics and is largely based on university size measured by total revenue.
Our study builds on and extends these prior studies in a number of important ways. First, our sample period of 2005–2012 covers the time during which there were a number of important reforms of the university sector (Bradley et al., 2008). These reforms transformed universities from the traditional collegiate model into ‘corporate universities’ and led to an explosion of VCs’ compensation. Second, we address the association of VCs’ compensation with university performance as measured by external ranking agencies. External rankings provide an objective quantitative measure of university performance, particularly in regards to teaching and research performance which are often highlighted in VC performance assessments in remuneration disclosures (see Appendix II). It is our contention that university rankings are an appropriate measure of performance as they are: (i) utilised for advertisements promoting the university, (ii) incorporate performance measures used to justify the levels and changes in VCs’ compensation, and (iii) are highlighted in position descriptions and advertising for VC appointments.2 Whilst prior research has documented an association between VC compensation and university size, it has not examined whether VC compensation is linked with external measures of performance. Third, we control for a number of institutional and financial characteristics of universities to determine the key drivers of VCs’ compensation. For example, we separate total university revenue into different revenue streams and examine which components are more highly associated with VC remuneration.
Our motivation for this study is twofold. First, a number of prior studies address the determinants of CEO (including university presidents/VCs) compensation in different not-for-profit sectors (Baber et al., 2002; Brickley and Van Horn, 2002; Frumkin and Keating, 2010; Sedatole et al., 2013; Bai, 2014).3 These studies focus on the association between compensation and revenue growth and accounting ratios, and conclude that organisation size, as measured by revenue and its core components, is the main driver of compensation. A major limitation of prior research is that, due to the unavailability of an independent external measure of performance, these studies do not examine whether CEO compensation is linked to an organisation’s performance in meeting its key objectives which are non-financial. We overcome this limitation through the use of university rankings provided by external agencies. Importantly, these rankings assess university performance in meeting both their non-financial (i.e., teaching and research) and operational objectives (i.e., student–staff ratios).
We build on and extend this prior literature by focusing on the pay for performance relation in the Australian not-for-profit university sector. The university sector provides an ideal setting to examine the pay-for-performance link in the not-for-profit sector, because universities are homogeneous in that they are funded and regulated by the Commonwealth and State Governments respectively.4 Furthermore, all universities have the same objectives of delivering quality education and research. More importantly, university performance in relation to these two objectives is measured and reported on by independent Australian and international ranking agencies, which universities and their VCs recognise as one of their key performance measures (see Appendices I and II).
The government, as a matter of urgency, should be conducting a review of the salaries paid to our university vice-chancellors. This group of some 38 men and women are excessively paid. They are on average the highest paid vice-chancellors in the world, but their universities are not the highest performing in the world. Sydney University is ranked 60th in the world, but the vice-chancellor of Sydney University receives more than double the pay of the No. 1 university in the world, which is Oxford University. (Senator Pauline Hansen, Australian Senate, 17 August2017).
At present, there is limited empirical evidence to inform this public debate, as prior research (Soh, 2007; Clements and Izan, 2008) does not test whether VC compensation is linked with the research and teaching performance of universities. This study provides such evidence.
Our evidence is based on hand-collected data comprising 182 observations for 37 universities from 2005 to 2012. Our performance measures are based on rankings provided by three rankings agencies: (i) Hobsons, Good University Guide (GUG), (ii) Quacquarelli Symonds Limited (QS) World University Rankings, and (iii) Shanghai Ranking Consultancy Academic Ranking of World Universities (ARWU). Our descriptive results show VCs’ compensation has increased annually at a rate of 12.2 percent. Further, although there are only 23 VC bonus payments paid by eight universities, the explicit triggers for these bonus payments are not disclosed. (See Appendices II and IV).
Our multivariate results show that there is a limited association between VCs’ compensation and external rankings, with only the ARWU ranking being positive and significant. When we break down the ARWU rankings into its core components (see Appendix III), the main drivers of this result are (i) papers in Science Citation Index (PUB) and (ii) per capita academic performance (PCP). We also test the association between changes in VCs’ compensation with changes in rankings and document that only changes in the GUG and ARWU rankings are significant. Our final test provides evidence on the association between current year VCs’ compensation and the previous years’ rankings, and it highlights a significant positive association for the ARWU and the QS ranking but only for the ARWU sample. Nevertheless, in all cases, the significant results for university rankings are not robust to the inclusion of alternative size measures based on the components of university revenue. Overall, our findings are consistent with societal concerns that VC remuneration is not justified by the performance of universities in meeting their teaching and research objectives. In contrast, the results suggest that VCs are rewarded for maximising student numbers and increasing revenues which is at odds with universities being a not-for-profit entity. This result is potentially an unintended consequence of the deregulation of university student numbers.
Our results contribute to the pay-for-performance literature in the not-for-profit sector and provide guidance to policymakers. First, we contribute evidence on the applicability of principal/agency theory in the not-for-profit sector. A number of researchers outline the agency problems in the not-for-profit sector by identifying at least two agency issues: (i) the separation of the board and management and (ii) the separation of management and stakeholders (Caers et al., 2006; Van Puyvelde et al., 2012). We focus on and provide empirical evidence on the first agency problem, namely the interaction between the board (university council) and management (VCs), as well as the ability of the board to link pay with performance. A well-functioning university council should reduce agency problems because, as observed by Caers et al. (2006, p. 28) when discussing the agency problem in the not-for-profit sector, ‘outcome-based compensation would induce the agent to exert more than the minimum level of effort.’ Our evidence is consistent with the findings of Baber et al. (2002), and suggests that VCs’ compensation is mainly associated with the different components of revenue and not associated with a university’s teaching and research performance.
Second, our results contribute to the dilemma faced by policymakers on how to maximise the utilisation of public resources under NPM. Our findings indicate that quantifiable external performance measures aligned with university goals are not associated with VCs’ compensation. These performance measures which are incorporated in ranking outcomes include: research funding, research outcomes and operational performance indicators such as staff/student and international faculty ratios (see Appendix III). Importantly, these measures also represent advertised performance measures for new VC appointments as well as annual achievements stated in annual reports (see Appendix I). Our descriptive results also indicate that VC bonus compensation is relatively infrequent and, on average, represents approximately 20 percent of VCs’ total compensation. This result is inconsistent with the findings of Balsam and Harris (2018), where 45 percent of a total of 45,000 observations for non-profit organisations paid a bonus to their CEOs. Concern over VCs’ compensation in Australia has led to policy recommendations by minority parties in the Australian federal parliament. For example, Liberal Democrat Senator David Leyonhjelm recommends the formation of an independent remuneration tribunal (Lane, 2017; Graham, 2019). While our results of the limited association between VCs’ compensation and ranking performance measures do not directly address these policy recommendations; they suggest that there is an unresolved agency problem in the Australian university sector.
The rest of this paper is structured as follows. Section 2 presents the literature review, institutional setting and theory development. Section 3 describes the sample and data and outlines the research design. Section 4 reports results, while Section 5 details sensitivity and additional tests. Conclusions and suggestions for future research are detailed in Section 6.
2 Literature review, institutional setting and theory development
2.1 Literature review
A number of studies provide evidence on the relation between CEO compensation of not-for-profit entities and accounting-based performance measures. For example, Brickley and Van Horn (2002) examine hospitals, Frumkin and Keating (2010) study five different sectors including education, and Sedatole et al. (2013) use a large US sample of tax-exempt not-for-profit organisations in three sectors (education, medical and charities). Generally, these studies find that CEOs’ compensation is associated with size as measured by alternative revenue components.
Prior research investigating VCs’ and senior executives’ compensation in universities has been undertaken in Australia and internationally. Soh (2007) compares the remuneration practices of Australian VCs to CEOs in the private sector between 1995 and 2002 and find VCs’ compensation is approximately 56 percent less than their private sector counterparts after controlling for size. The study also reports that an increase in university size of 10 percent renders a 2.7 percent increase in VCs’ compensation. Clements and Izan (2008) investigate the remuneration of the top five academic executives between 1999 and 2004 at 33 Australian universities and document that size is the dominant factor in determining remuneration. Furthermore, they find that academic executive remuneration had increased at a rate ‘about twice the increase in the salaries of teaching and research academics’ (Clements and Izan, 2008, p. 28).
In the United Kingdom, the only unregulated salary in the university sector is that of VCs. Baimbridge and Simpson (1996) model the remuneration of VCs utilising 22 institutional and 18 personal explanatory variables for 64 universities between 1993 and 1994. They conclude that ‘many of the key managerial and performance indicators fail to offer any explanation for reward levels’ awarded to VCs (p. 637).
US studies find that high stature6 universities offer greater compensation to their VCs, although notably, the greater compensation is not supported by higher performance (Pfeffer and Ross, 1988; Banker et al., 2009). Parsons and Reitenga (2014) demonstrate that private university presidents are paid relatively more than their public university peers. Cheng (2014) finds that performance-related variables play a very limited role in determining public university presidents’ executive remuneration. Bai (2014) reports similar findings for US private universities. One of the inherent issues associated with these studies is that US private and public universities have different objectives and stakeholders resulting in different performance measures being appropriate. Our study overcomes this potential shortcoming by focusing on the Australian setting, where all universities are publicly funded and have homogeneous objectives; as such we can utilise homogeneous performance measures to analyse whether they impact VCs’ compensation.
2.2 Institutional setting of Australian universities
Hansmann (1980, p. 838) defines a non-profit organisation as ‘an organisation that is barred from distributing its net earnings, if any, to individuals who exercise control over it…’7 Within the not-for-profit sector, universities in Australia comprise 37 public universities geographically spread across the country. Australian universities are funded by the Commonwealth Government, but they are incorporated and regulated by state government legislation.8 Since the introduction of tuition fees in 1989, referred to as the Higher Education Contribution Scheme (HECS), universities have undergone a process of commercialisation of both operations and management structures.9
In 2008, the ‘Bradley Review’ (Bradley et al., 2008) recommended the discontinuation of the quota system and the deregulation of student fees for undergraduate places. These recommendations changed universities to become primarily student-demand-driven due to the sizable revenue streams associated with this action. With the Commonwealth Government’s share of funding progressively declining10 (Dodd, 2014b), universities have filled this gap with full-fee paying domestic students along with increasing numbers of full-fee paying international students. The increases in student numbers combined with increased competition between universities for students have led to the commercialisation of management practice and associated administrative structures (Withers, 2014).
These regulatory changes have transformed universities from the traditional collegiate model into commercial, academic enterprises, managed by ‘academic executives’ (Clements and Izan, 2008). As part of the academic enterprise changes, VCs’ compensation, along with other senior executives’ compensation, has been deregulated leading to significant increases in both levels and changes in VCs’ compensation. For example, the average VCs’ compensation between 2005 and 2012 was $670,000 with average annual growth of 12.2 percent (see Table 3). Whether the levels and increases in VCs’ compensation are associated with university performance in meeting their non-financial objectives is an empirical question on which we provide evidence.
| Mean | Median | SD | Minimum | Maximum | No. Obs. | |
|---|---|---|---|---|---|---|
| Dependent variables | ||||||
| VC Compensation | 6,70,000 | 6,30,000 | 2,10,000 | 2,50,000 | 16,00,000 | 182 |
| %ΔVCPay | 12.20% | 9.10% | 17.70% | −36.10% | 135.80% | 130 |
| Bonus Pay | 1,70,000 | 1,60,000 | 1,20,000 | 55,000 | 5,30,000 | 23 |
| %∆Bonus Pay | 16.70% | 13.60% | 39.60% | −37.90% | 116.00% | 11 |
| Performance measures | ||||||
| GUG Rank Score | 26 | 25 | 6 | 12 | 36 | 182 |
| ∆GUG Rank Score_iv | 43.30% | 0.00% | 49.70% | 0.00% | 100.00% | 164 |
| QS Rank Score | 51 | 47 | 19 | 14 | 92 | 131 |
| ∆QS Rank Score_iv | 50.90% | 100.00% | 50.20% | 0.00% | 100.00% | 108 |
| ARWU Rank Total | 16 | 14 | 7 | 8 | 31 | 103 |
| ∆ARWU Rank Score_iv | 60.30% | 100.00% | 49.30% | 0.00% | 100.00% | 78 |
| Alternative size measures | ||||||
| Total Endowments (000) | 6,515 | 1,581 | 12,000 | 28 | 85,000 | 182 |
| %∆Endowments | 69.60% | 1.60% | 222.00% | −96.30% | 1289.10% | 130 |
| Government Grants (000) | 3,40,000 | 2,80,000 | 2,20,000 | 38,000 | 10,00,000 | 182 |
| %∆GovFund | 9.00% | 8.40% | 7.90% | −19.90% | 33.30% | 130 |
| Research Income | 51,000 | 28,000 | 60,000 | 1,040 | 2,50,000 | 182 |
| %∆Research Income | 4.40% | 4.40% | 8.10% | −39.40% | 32.30% | 130 |
| Domestic Student Income (000) | 35,000 | 28,000 | 28,000 | 2,516 | 1,30,000 | 182 |
| %∆DomFFRev | 6.50% | 4.30% | 21.20% | −62.90% | 148.00% | 130 |
| International Student Revenue (000) | 94,000 | 64,000 | 78,000 | 6,232 | 3,30,000 | 182 |
| %∆IntStuRev | 9.80% | 9.30% | 10.70% | −24.50% | 42.60% | 130 |
| Institutional controls | ||||||
| TCouncil | 18.79 | 19.00 | 2.78 | 8.00 | 27.00 | 182 |
| ChancellorExp | 61.50% | 1.00 | 48.80% | 0.00% | 100.00% | 182 |
| TCampus | 4.91 | 4.50 | 2.78 | 1.00 | 16.00 | 182 |
| TFaculties | 6.49 | 6.00 | 3.37 | 2.00 | 17.00 | 182 |
| Financial controls | ||||||
| OpExp_R | 92.00% | 92.60% | 4.90% | 74.10% | 109.80% | 182 |
| Debt/Equity | 32.80% | 29.40% | 18.80% | 6.80% | 110.00% | 182 |
| ROE | 4.90% | 4.50% | 3.40% | −9.40% | 14.90% | 182 |
- All variables are defined in Table 2.
2.3 Theory development
The two dominant theoretical frameworks used in the private sector to explain the pay for performance relation are (i) efficient contracting and (ii) capture theory. Efficient contracting draws on agency theory (Jensen and Meckling, 1976), which suggests that on average, CEO contracts are efficient in the reduction of agency costs associated with the separation of ownership and control. In contrast, capture theory, proposed by Bebchuk and Fried (2003, 2005), suggest that the board is captured by the CEO, and hence her/his compensation is not necessarily associated with firm performance.
Researchers have explored the agency problems associated with not-for-profit entities based on the above private sector theories. Further, they have incorporated stakeholder and stewardship theories (Caers et al., 2006; Van Puyvelde et al., 2012; Sedatole et al., 2013). While there is still some theoretical debate amongst these researchers as to what is the best way to explore the agency problem in not-for-profit entities, we adopt the approach of Caers et al. (2006), who divide the principal–agent relationship into board–manager and manager–employee (stakeholders) interactions.
Our paper focuses on the board (university council)–manager (Vice Chancellor) relationship, as university councils approve the compensation of VCs and they are the ‘prime defender of the mission statement and as a champion of its achievement’ (Caers et al., 2006, p. 32). Hence, it is the council’s role to link university performance to VC compensation consistent with efficient contracting theory. In the university setting, council membership typically comprises: the Chancellor, Vice-Chancellor, chair of the academic board, government-appointed members, council appointed members, as well as elected members representing the academic, administrative and student bodies of the university. It is arguable whether the council is in a position or has the expertise to develop effective compensation strategies which tie VCs’ compensation to university performance. This situation may be due to the difficulties associated with the measurement of performance, which includes the evaluation of efficiency and effectiveness in the transformation of inputs to output (Free et al., 2009). In addition, as council members are typically unpaid, prior research (Adams and Ferreira, 2008) suggests that this reduces the effort that members devote to their role. Finally, the council only meets a limited number of times per year and, based on its composition, it typically includes members with limited or no prior business experience.
The existence of external rankings provides university councils with the opportunity to link VC compensation with external measures of performance which align to university teaching and research objectives. VCs themselves, for example, often quote rankings and or ranking components to highlight their university’s performance (see Appendix I). Moreover, universities often mention performance in teaching and/or research when justifying VC compensation (see Appendix II). All ranking measures have components related to research and teaching quality, faculty members’ international reputation, student/staff ratios, international faculty and international student demand (see Appendix III). Different universities may have dissimilar objectives which are aligned to one or more of the measures produced by external ranking agencies. Hence, councils may use aggregate rankings and/or ranking components as performance targets when setting VC compensation. Alternatively, councils may link pay with good research or teaching performance, which are reflected in the external rankings. Whether university councils utilise these rankings to measure performance in determining VCs’ compensation or rely more on qualitative as opposed to quantitative performance measures remains an empirical question. We provide evidence on the association between ranking performance measures and VCs’ compensation.11
3 Research design and data
3.1 Sample
The Higher Education Support Act (HESA) (Australian Federal Government, 2003) reports that there are 43 accredited Higher Education providers in Australia. Data on Australian universities are hand collected from annual reports for the years 2005 to 2012 inclusive. Annual report data are then matched with university financial statements obtained from the Australian Federal Government’s Department of Education, who provide the ‘Financial Reports of Higher Education Providers’ annually. External rankings data are also hand collected from three separate ranking agencies: (i) GUG, (ii) QS and (iii) ARWU. Table 1 describes the sample selection process.
| Good University Guide Ranking | Universities | VC pay observations |
|---|---|---|
| 1. Accredited Higher Education Providers | 43 | 344 |
| 2. Exclude International, Indigenous, Religious Higher Education Providers and non-publication of annual reports | −6 | −48 |
| 4. 37 Universities covering an 8-year period | 37 | 296 |
| 5. Add years with two or more VCs in the same year | 11 | |
| Subtotal | 37 | 307 |
| 6. Exclude years that did not provide VC Compensation details | −12 | |
| 7. Exclude years if departing VC during the year | −37 | |
| 8. Exclude years if VC is appointed during the year | −36 | |
| 9. Years missing GUG Rankings Observations | −40 | |
| Final GUG Sample size after exclusions | 37 | 182 |
| 10. Less Universities/ Observations not Included in QS Rankings | −12 | −51 |
| Final QS Sample size after exclusions | 25 | 131 |
| 11. Less Universities/ Observations not Included in ARWU Rankings | −4 | −28 |
| Final ARWU Sample size after exclusions | 21 | 103 |
After excluding local specialist, international and private accredited universities, as well as universities that did not publish annual reports, the final sample comprises 37 universities using the GUG rankings, 25 universities using the QS rankings, and 21 universities using the ARWU rankings. The number of observations is inconsistent across the different ranking metrics, as not all universities participate in all three rankings. The GUG rankings apply only to Australian universities, whereas the ARWU and QS rankings include leading Australian and international universities.
The reporting of VC compensation is inconsistent, with disclosures varying between universities and in many cases on a year-to-year basis for the same university. We assume that VCs receive the highest compensation and exclude observations where VCs’ compensation is not reported or is not determinable from remuneration report disclosures. Finally, for universities that changed their VCs, the outgoing VC in their final year and the incoming VC in their first year are excluded due to the non-disclosure of termination payments and sign-on bonuses (Baber et al., 2002; Coulton and Taylor, 2002).12 After these deletions and excluding missing rankings, the final sample utilising the GUG rankings comprises 182 observations, 131 observations using the QS sample, and 103 observations using the ARWU sample.13
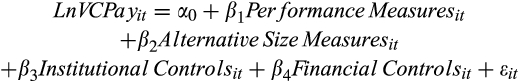
3.2 Model specification
The research design employed to investigate the relation between VCs’ compensation and university rankings controls for alternative size measures using revenue components. The model also controls for governance characteristics, institutional complexity and financial measures. Variables are defined in Table 2.
| Variable | Definition |
|---|---|
| Dependent variable | |
| LnVCPay | Natural log of total VC compensation |
| %∆VCPay | % change in total VC compensation |
| LnBonus | Natural log of bonus pay |
| %∆Bonus | % change in bonus pay |
| Performance measures | |
| LnGUG Rank Score | Natural log of sum of ‘selected’ Good University Guide Rankings |
| ∆GUG Rank Score_iv | Instrumental variable for change in GUG rank score: 1 = Increase, 0 = Otherwise |
| LnQS Rank Score | Natural log of sum of QS rankings |
| ∆QS Rank Score_iv | Instrumental variable for change in QS rank score: 1 = Increase, 0 = Otherwise |
| LnARWU Rank Score | Natural log of sum of ARWU rankings |
| ∆ARWU Rank Score_iv | Instrumental variable for change in ARWU rank score: 1 = Increase, 0 = Otherwise |
| Alternative size measures | |
| LnEndow | Natural log of endowments received comprising donations and bequests |
| %∆Endow | % change in endowments |
| LnGovFund | Natural log of government funding revenue |
| %∆GovFund | % change in government funding revenue |
| LnResearch Income | DEST research funding and Australian Research Council grants |
| %∆Research Income | % change in research income |
| LnDomFFRev | Natural log of domestic full fee paying students revenue |
| %∆DomFFRev | % change in domestic full fee paying students revenue |
| LnIntStuRev | Natural log of international student revenue |
| %∆IntStuRev | % change in international student revenue |
| Institutional controls | |
| TCouncil | Number of council members |
| ChancellorExp | Indicator variable if Chancellor is ex-government employee or lawyer = 1, 0 = Otherwise |
| TCampus | Number of campuses |
| TFaculties | Number of faculties |
| Financial controls | |
| OpExp_R | Operating expenses as a percentage of total revenues |
| Debt/Equity | Debt to equity ratio |
| ROE | Net operating profit after tax/Total equity |
External performance measures are sourced from three independent university ranking agencies, namely (i) GUG (LnGUG Rank Score), (ii) QS (LnQS Rank Score), and (iii) ARWU (LnARWU Rank Score). Following Sedatole et al. (2013), we include the following unique revenue streams of universities as alternative size measures: (i) donations and bequests (LnEndowments), (ii) government funding, (LnGovFund), (iii) research income and grants (LnResearchIncome), (iv) domestic full-fee paying student revenue (LnDomFFRev) and (v) international student revenue (LnIntStuRev). Using disaggregated revenue streams as alternative size measures facilitates the evaluation of the main drivers of VC compensation (Frumkin and Keating, 2010; Sedatole et al., 2013) and extends prior research (Soh, 2007; Clements and Izan, 2008).
We also include a number of control variables in our models. First, the number of council members (TCouncil) is included as an institutional governance control. Second, we control for complexity using (i) the number of campuses (TCampus), (ii) the number of faculties (TFaculties) and (iii) the qualifications and experience of the Chancellor (ChancellorExp). Finally, financial performance controls are included comprising (i) the ratio of operating expenses to total revenue (OpExp_R), (ii) debt to equity (Debt/Equity) and (iii) return on equity (ROE) as a relative measure of financial performance. These measures are included despite universities being classified as not-for-profit entities because, in some instances, VCs are compensated for achieving financial objectives (see Appendix II – Macquarie University).
 (1)
(1)3.3 Descriptive statistics
Descriptive statistics are reported in Table 3.
The mean VCs’ compensation (VCPay) is $670,000 and this result is more than double the mean for 1994–2004 reported by Clements and Izan (2008), thereby suggesting abnormal growth in Australian VCs’ compensation. The highest paid VC had a one-off annual salary of $1,600,000, and the average annual compensation growth (∆%VCPay) is 12.2 percent per annum. Additionally, the mean VC bonus compensation (Bonus Pay) is $170,000. It is noteworthy that only a limited number of universities pay a bonus. In Appendix II, we include examples of VCs’ compensation descriptions extracted from annual reports. In all cases, the disclosures suggest that bonus payments are based on unspecified financial and non-financial targets.
The external performance measures include rankings published by the Good University Guide (GUG Rank Score) with a possible maximum score of 40 (QS Rank Score 100, ARWU Rank Score 100). The GUG rank score has a mean of 26 (QS 51, ARWU 16) with a maximum of 36 (QS 92, ARWU 31) and a minimum of 12 (QS 14, ARWU 8). The change in the rank scores is reported using an indicator variable (with increases denoted as one and decreases and no movements denoted as 0). Using the GUG sample, the ranking score (∆Gug Rank Score_iv), increases in 43.3 percent of the observations (QS 50.9 percent (∆QS Rank Score_iv), ARWU 60.3 percent (∆ARWU Rank Score_iv)). Appendix IV provides additional summary information classified by each university for average VC compensation, VC compensation growth and participation in the individual ranking measures.
A visual representation of the average changes in VCs’ compensation and average change in the three ranking performance measures are shown in Figure 1. Examination of Figure 1 suggests that the level of changes in VCs’ compensation is independent of changes in the rankings. We provide further statistical evidence on this contention in Section 4.

Alternate size measures include five distinct university revenue streams. The five revenue streams comprise: (i) total endowments with a mean of $6.52 million and average growth of (%∆Endow) 69.61 percent; (ii) the largest source of revenue is government grants with an average of $340 million and a growth rate (%∆GovFund) of 9 percent; (iii) research income is on average the third highest source of revenue and averages $51 million and a growth rate (%∆Research Income) of 4.4 percent; (iv) domestic full-fee paying students revenue averages $35 million with a growth rate (%∆DomFFRev) of 6.5 percent; and finally (v) revenue from international students averages $94 million with a growth rate (%∆IntStuRev) of 9.8 percent per annum.
The size of the university council (TCouncil), ranges from eight to 27 members with a mean of 18.79 members. The chancellor in 69.6 percent of our observations (ChancellorExp) is either from an ex-government, ex-public servant and/or ex-legal background.14 University complexity is proxied using the number of campuses (TCampus), which ranges from one to 16 with a mean of 4.9 campuses. Of note is that the average number of campuses for the Group of Eight (G8) universities (5.38) exceed that of the non-G8 universities (5.07). The number of faculties (TFaculties) ranges from two to 17 with an average of 6.49. G8 universities have the highest number of faculties averaging 9.38, with the University of Sydney reporting on average 17 faculties. Amongst the financial controls, operating expenses average 92 percent of total revenues (OpExp_R). Debt levels average at 33 percent of equity and the average return on equity (ROE) is 4.9 percent.
Pearson and Spearman correlations for the variables used in the regression equations are reported in Table 4.
| LnVCPay | LnGUG Rank | LnQS Rank Score | LnARWU Rank | LnEndow | LnGovFund | LnResearch Income | LnDomFFRev | LnIntStuRev | TCouncil | TCampus | TFaculties | OpExp_R | Debt/Equity | ROE | |
|---|---|---|---|---|---|---|---|---|---|---|---|---|---|---|---|
| LnVCPay | 1 | 0.479* | 0.379 | 0.519** | 0.251 | 0.258 | 0.318 | 0.450* | 0.449* | −0.115 | −0.130 | 0.052 | −0.492** | 0.0785 | 0.303 |
| LnGUG Rank Score | 0.404 | 1 | 0.905*** | 0.724*** | 0.778*** | 0.813*** | 0.812*** | 0.612*** | 0.559** | −0.056 | 0.383 | 0.632*** | 0.054 | 0.180 | −0.209 |
| LnQS Rank Score | 0.268 | 0.881*** | 1 | 0.816*** | 0.797*** | 0.890*** | 0.880*** | 0.666*** | 0.571** | −0.024 | 0.544** | 0.650*** | 0.067 | 0.251 | −0.143 |
| LnARWU Rank Score | 0.430* | 0.819*** | 0.889*** | 1 | 0.533** | 0.704*** | 0.851*** | 0.431* | 0.294 | 0.091 | 0.596** | 0.324 | −0.216 | −0.109 | 0.172 |
| LnEndowments | 0.161 | 0.757*** | 0.791*** | 0.668*** | 1 | 0.866*** | 0.724*** | 0.758*** | 0.775*** | 0.325 | 0.349 | 0.885*** | 0.435* | 0.336 | −0.590** |
| LnGovFund | 0.162 | 0.801*** | 0.917*** | 0.813*** | 0.871*** | 1 | 0.845*** | 0.624*** | 0.590** | 0.154 | 0.614*** | 0.860*** | 0.329 | 0.239 | −0.339 |
| LnResearch Income | 0.186 | 0.840*** | 0.930*** | 0.888*** | 0.859*** | 0.961*** | 1 | 0.515** | 0.433* | 0.133 | 0.772*** | 0.552** | 0.129 | 0.097 | −0.155 |
| LnDomFFRev | 0.476* | 0.628*** | 0.667*** | 0.554** | 0.789*** | 0.716*** | 0.681*** | 1 | 0.967*** | 0.034 | 0.064 | 0.551** | 0.131 | 0.697*** | −0.303 |
| LnIntStuRev | 0.469* | 0.572** | 0.558** | 0.393 | 0.756*** | 0.645*** | 0.566** | 0.962*** | 1 | 0.095 | −0.013 | 0.613*** | 0.262 | 0.672*** | −0.419* |
| TCouncil | −0.254 | −0.091 | −0.039 | −0.002 | 0.419* | 0.157 | 0.174 | 0.108 | 0.121 | 1 | 0.254 | 0.377 | 0.375 | −0.375 | −0.540** |
| TCampus | −0.131 | 0.414* | 0.600** | 0.600** | 0.610*** | 0.723*** | 0.760*** | 0.393 | 0.248 | 0.414* | 1 | 0.375 | 0.213 | −0.183 | −0.077 |
| TFaculties | 0.042 | 0.616*** | 0.704*** | 0.588** | 0.912*** | 0.858*** | 0.784*** | 0.686*** | 0.665*** | 0.521** | 0.711*** | 1 | 0.624*** | 0.230 | −0.699*** |
| OpExp_R | −0.530** | 0.061 | 0.059 | −0.159 | 0.394 | 0.254 | 0.232 | 0.067 | 0.184 | 0.558** | 0.245 | 0.399 | 1 | 0.075 | −0.846*** |
| Debt/Equity | 0.163 | 0.131 | 0.160 | −0.061 | 0.237 | 0.198 | 0.095 | 0.619*** | 0.647*** | −0.357 | −0.114 | 0.130 | −0.038 | 1 | −0.175 |
| ROE | 0.375 | −0.171 | −0.078 | 0.121 | −0.532** | −0.248 | −0.225 | −0.240 | −0.355 | −0.630*** | −0.225 | −0.539** | −0.888*** | −0.089 | 1 |
- Correlation matrix between variables included in the regression models. Spearman correlations are reported above the diagonal. All variables are defined in Table 2.
The Pearson correlation coefficients indicate that VCs’ compensation (LnVCPay) is only significantly positively correlated with the ARWU rank score (at the 10 percent level). The Spearman correlations for VC compensation report that two of the three ranking measures – the GUG (at the 10 percent level) and the ARWU (at the 5 percent level) – are significant. Of the alternative size measures, VCs’ compensation is significantly correlated with domestic full-fee paying students (LnDomFFRev) and international student revenue (LnIntStuRev) both at the 10 percent level. Further, the three ranking measures are highly correlated with each other as well as four of the five alternative revenue size measures.
4 Results
4.1 Main results
Table 5 reports the results testing the association between VC compensation and external rankings. The results are reported using only (i) external performance measures (columns 1–3); (ii) utilising the ARWU rank sample applied to the GUG and QS rankings to test whether the reduced sample generates a different result (columns 4–5); (iii) the alternative size measures only (column 6), and (iv) utilising simultaneously the alternative ranking and size measures (columns 7–9). The dependent variable in each case is the log of VCs’ compensation (LnVCPay). In all cases, we employ university and year fixed effects (FE) regressions.15
|
||||||||||
| Dependent variable | LnVCPayit (1) | LnVCPayit (2) | LnVCPayit (3) | LnVCPayit (4) | LnVCPayit (5) | LnVCPayit (6) | LnVCPayit (7) | LnVCPayit (8) | LnVCPayit (9) | |
|---|---|---|---|---|---|---|---|---|---|---|
| Sample based on | GUG Obs | QS Obs | ARWU Obs | ARWU Obs | ARWU Obs | Total Sample | GUG Obs | QS Obs | ARWU Obs | |
| Performance measures | ||||||||||
| LnGUG Rank Scoreit | + | 0.089 | 0.168 | 0.041 | ||||||
| 0.270 | 0.844 | 0.209 | ||||||||
| LnQS Rank Scoreit | + | 0.176 | 0.349*** | 0.033 | ||||||
| 1.617 | 3.606 | 0.390 | ||||||||
| LnARWU Rank Scoreit | + | 1.135*** | 0.163 | |||||||
| 5.631 | 0.556 | |||||||||
| Alternative size measures | ||||||||||
| LnEndowmentsit | + | −0.024 | −0.024 | −0.006 | −0.041 | |||||
| (−1.386) | (−1.363) | (−0.203) | (−1.307) | |||||||
| LnGovFundit | + | 0.448*** | 0.448*** | 0.295 | 0.214 | |||||
| 3.068 | 3.046 | 1.144 | 0.665 | |||||||
| LnResearch Income | + | −0.033 | −0.033 | −0.206 | −0.173 | |||||
| (−0.238) | (−0.235) | (−0.856) | (−0.777) | |||||||
| LnDomFFRevit | + | 0.112* | 0.107* | 0.500*** | 0.333* | |||||
| 1.904 | 1.842 | 3.127 | 1.762 | |||||||
| LnIntStuRevit | + | 0.355*** | 0.356*** | 0.267 | 0.323 | |||||
| 3.037 | 3.079 | 1.703 | 1.705 | |||||||
| Institutional controls | ||||||||||
| TCouncilit | +/− | −0.025** | −0.009 | 0.002 | −0.015 | −0.002 | −0.006 | −0.006 | −0.005 | 0.012 |
| (−2.094) | (−0.783) | 0.200 | (−1.084) | (−0.168) | (−0.825) | (−0.801) | (−0.570) | 1.029 | ||
| ChancellorExpit | 0.005 | −0.011 | 0.108 | 0.093 | 0.098 | 0.025 | 0.026 | −0.006 | 0.084 | |
| 0.060 | (−0.105) | 1.575 | 1.048 | 1.275 | 0.466 | 0.467 | (−0.073) | 1.114 | ||
| TCampusit | + | −0.092* | −0.027 | −0.009 | −0.017 | 0.002 | −0.023 | −0.022 | −0.011 | −0.004 |
| (−1.949) | (−0.689) | (−0.163) | (−0.293) | 0.054 | (−1.678) | (−1.590) | (−0.550) | (−0.140) | ||
| TFacultiesit | + | −0.016 | −0.036 | −0.032 | −0.049** | −0.042 | 0.000 | 0.000 | −0.031 | −0.035 |
| (−0.636) | (−1.571) | (−1.511) | (−2.428) | (−1.600) | (−0.010) | (−0.016) | (−1.498) | (−1.681) | ||
| Financial controls | ||||||||||
| OpExp_Rit | − | 0.242 | 0.34 | −0.204 | −0.164 | 0.054 | −0.329 | −0.328 | −0.408 | −0.552 |
| 0.589 | 0.739 | (−0.510) | (−0.344) | 0.106 | (−1.005) | (−0.997) | (−0.965) | (−1.415) | ||
| Debt/Equityit | − | 0.342 | 1.168 | 3.545 | 4.003* | 2.691 | −0.506 | −0.511 | −1.144 | 0.534 |
| 0.166 | 0.511 | 1.586 | 1.768 | 1.232 | (−0.506) | (−0.507) | (−0.646) | 0.256 | ||
| ROEit | + | 0.342 | 1.168 | 3.545 | 4.003* | 2.691 | −0.506 | −0.511 | −1.144 | 0.534 |
| 0.166 | 0.511 | 1.586 | 1.768 | 1.232 | (−0.506) | (−0.507) | (−0.646) | 0.256 | ||
| Constant | 14.830*** | 12.576*** | 8.662*** | 11.385*** | 10.912*** | 3.252*** | 3.135** | 4.142** | 4.825 | |
| 6.936 | 9.874 | 7.072 | 6.473 | 10.165 | 2.926 | 2.557 | 2.379 | 1.697 | ||
| Observations | 182 | 131 | 103 | 103 | 97 | 182 | 182 | 131 | 103 | |
| Adj. R2 | 0.076 | 0.075 | 0.202 | 0.024 | 0.197 | 0.609 | 0.606 | 0.442 | 0.434 | |
| F-statistic | 2.060 | 2.102 | 12.880 | 3.221 | 5.622 | 29.977 | 28.392 | 34.155 | 14.623 | |
| Fixed effects (Uni & Year) | Yes | Yes | Yes | Yes | Yes | Yes | Yes | Yes | Yes | |
- Standard errors are given in italics. t-statistics *p < 0.10, **p < 0.05, ***p < 0.010.
The results in Table 5 show that the ARWU ranking (column 3) is positive and significantly (1 percent level) associated with VCs’ compensation. Additionally, using the universities with QS rankings within the ARWU sample also returns a significant positive result (column 5). However, these performance measures become insignificant once the alternative size measures are introduced (columns 7, 8 and 9). Therefore, these results do not provide statistically reliable evidence that external performance measures are associated with VCs’ compensation. As a sensitivity test (results available on request) when we look at the individual components for each external ranking, we find that, for both the ARWU and QS sample, publications and academic reputation respectively, are positively associated with VCs’ compensation. However, once again these results are not robust to the inclusion of the alternative size measures.
Amongst the size measures, government funding (LnGovFund), domestic full-fee paying students (LnDomFFRev) and international student revenues (LnIntStuRev) are the main drivers of VCs’ compensation. The domestic full-fee paying student revenue (LnDomFFRev) measure is significant in all models (columns 6–9), while international student revenues (LnIntStuRev) are not significant for the QS and ARWU samples (columns 8 and 9). The insignificance of endowment revenue (LnEndowments) is a departure from US findings (Sedatole et al., 2013; Parsons and Reitenga, 2014) and is likely driven by lower endowment and alumni revenues in Australia compared with the US.
The results for the institutional and financial control variables are inconsistent across models. University council size (TCouncil) and the number of campuses (TCampus) show some evidence of a negative association with VC compensation. As discussed above, since G8 universities have more campuses than non-G8 universities, the negative coefficient on the number of campuses is not driven by university status.
Overall, the significant positive results for the alternative size measures confirm the Australian findings in both Soh (2007) and Clements and Izan (2008) that larger universities pay their VCs more. However, our study differs in that it includes both external performance measures and different revenue sources enabling a more detailed insight into the determinants of VCs’ compensation (Frumkin and Keating, 2010; Sedatole et al., 2013). Our results indicate that the individual revenue component measures, particularly student fee revenue, and not the external performance measures, are the main drivers of VC compensation. Hence, despite the focus of many universities on external rankings (see Appendix I), we cannot find statistically reliable evidence that VCs’ compensation is linked to external rankings.
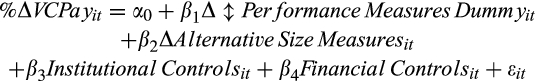
In Table 6, we test the association between changes in VCs’ compensation and changes in the external performance measures utilising an indicator variable denoting upward movement in the ranking. The model also includes controls for changes in the individual revenue components. The institutional and financial control variables are identical to those utilised in Table 5. The dependent variable is the percentage change in VC compensation (%∆VCPay). In all cases, we use university and year fixed effects (FE) regressions with robust standard errors clustered by university and year.
|
|||||||||
| Dependent variable | %∆VCPayit (1) | %∆VCPayit (2) | %∆VCPayit (3) | %∆VCPayit (4) | %∆VCPayit (5) | %∆VCPayit (6) | %∆VCPayit (7) | %∆VCPayit (8) | |
|---|---|---|---|---|---|---|---|---|---|
| Sample based on | GUG Obs | QS Obs | ARWU Obs | ARWU Obs | ARWU Obs | GUG Obs | QS Obs | ARWU Obs | |
| ∆Performance measures (1 = Up 0 = Otherwise) | |||||||||
| ∆GUG Rank Score Dummyit | + | 0.062** | 0.128*** | 0.015 | |||||
| 2.101 | 2.871 | 0.508 | |||||||
| ∆QS Rank Score Dummyit | + | −0.004 | 0.000 | −0.040 | |||||
| (−0.111) | (−0.002) | (−0.990) | |||||||
| ∆ARWU Rank Score Dummyit | + | 0.026 | 0.065 | ||||||
| 0.503 | 1.306 | ||||||||
| ∆ Alternative size measures | |||||||||
| %∆Endowmentsit | + | −0.012** | −0.003 | −0.022** | |||||
| (−2.490) | (−0.379) | (−2.436) | |||||||
| %∆GovFundit | + | −0.919 | −0.609 | −0.838 | |||||
| (−1.270) | (−0.856) | (−1.027) | |||||||
| %∆Research Incomeit | + | −0.104 | −0.453 | −0.745 | |||||
| (−0.596) | (−1.167) | (−1.430) | |||||||
| %∆DomFFRevit | + | 0.191*** | 0.154 | 0.128 | |||||
| 2.831 | 1.229 | 0.651 | |||||||
| %∆IntStuRevit | + | −0.058 | −0.238 | −0.048 | |||||
| (−0.255) | (−0.718) | (−0.113) | |||||||
| Institutional controls | |||||||||
| TCouncilit | +/− | −0.012** | −0.012 | −0.001 | 0.003 | −0.003 | −0.004 | −0.007 | 0.013 |
| (−2.036) | (−1.562) | (−0.095) | 0.177 | (−0.213) | (−0.410) | (−0.529) | 0.548 | ||
| ChancellorExp | − | −0.039 | −0.043 | −0.104 | −0.156* | −0.108 | 0.012 | −0.026 | −0.048 |
| (−0.706) | (−0.889) | (−1.455) | (−1.914) | (−1.600) | 0.241 | (−0.600) | (−0.669) | ||
| TCampusit | + | 0.003 | −0.026 | −0.042 | −0.05 | −0.034 | 0.025 | −0.034 | −0.084 |
| 0.089 | (−0.685) | (−0.811) | (−0.938) | (−0.737) | 0.520 | (−0.635) | (−1.422) | ||
| TFacultiesit | + | 0.003 | 0.025*** | 0.026** | 0.033*** | 0.027** | 0.000 | 0.037** | 0.039** |
| 0.350 | 2.955 | 2.238 | 3.806 | 2.219 | (−0.006) | 2.274 | 2.308 | ||
| Financial controls | |||||||||
| OpExp_Rit | − | −0.179 | −0.707 | −0.103 | 0.249 | −0.247 | −2.031 | −0.754 | 0.354 |
| (−0.172) | (−0.320) | (−0.042) | 0.110 | (−0.108) | (−1.559) | (−0.318) | 0.140 | ||
| Debt/Equityit | − | −0.399 | −0.471 | −0.539 | −0.608 | −0.563 | −0.259 | −0.242 | −0.005 |
| (−1.318) | (−1.012) | (−0.804) | (−0.959) | (−0.892) | (−1.358) | (−0.790) | (−0.012) | ||
| ROEit | + | 0.504 | −0.162 | 0.773 | 0.992 | 0.504 | −1.143 | 0.213 | 2.556 |
| 0.301 | (−0.046) | 0.188 | 0.271 | 0.133 | (−0.750) | 0.066 | 0.751 | ||
| Constant | 0.561 | 1.133 | 0.425 | 0.017 | 0.584 | 2.142 | 1.028 | −0.356 | |
| 0.500 | 0.528 | 0.174 | 0.007 | 0.271 | 1.650 | 0.465 | (−0.152) | ||
| Observations | 130 | 108 | 78 | 78 | 78 | 130 | 108 | 78 | |
| Adj. R2 | 0.004 | 0.016 | −0.011 | 0.059 | −0.014 | 0.120 | 0.053 | 0.078 | |
| F-statistic | 1.969 | 6.516 | 27.068 | 49.879 | 37.370 | 4.893 | 32.841 | 242.671 | |
| Fixed effects (Uni & Year) | Yes | Yes | Yes | Yes | Yes | Yes | Yes | Yes | |
- t-statistics *p < 0.10, **p < 0.05, ***p < 0.010.
The findings show that only the GUG indicator variable is significant on two occasions, using the full sample and the sub-sample of observations with ARWU rankings (columns 1 and 4). However, upon including the changes in the alternative size measures (columns 6, 7 and 8), the external performance measures lose their significance. Of the alternative size measures, the change in endowments is negatively associated with changes in VC compensation. This result is consistent with Frumkin and Keating (2010) that donors perhaps look adversely on high levels of VC compensation. An alternative interpretation is that VCs are not rewarded with higher pay for obtaining endowments, as these revenue sources are beyond their control. The results also indicate that a 1 per cent increase in domestic full-fee paying students (%∆DomFFRev) results in a 0.19 percent increase in VC compensation (column 6). Amongst the controls, the number of faculties (TFaculties) using the QS and ARWU rankings data (columns 2, 3, 4, 5, 7 and 8) is positive and statistically significant. This is consistent with increased complexity resulting in higher VC compensation. Overall, neither the changes in the external rankings nor the changes in the alternative size measures provide statistically reliable evidence supporting changes in VCs’ compensation. A possible explanation is that VC compensation levels are based on qualitative factors, which in many instances are not disclosed.
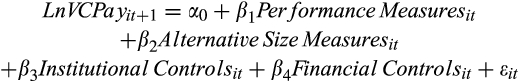
In Table 7, we provide evidence on the association between the current year VCs’ compensation and the ranking performance in the prior year. This test allows us to assess whether rankings are linked to the subsequent year’s compensation. Control variables remain the same, and all models employ university and year fixed effects (FE) regressions with robust standard errors clustered by university and year.
|
||||||||||
| Dependent variable | VCPayt+1 (1) | VCPayt+1 (2) | VCPayt+1 (3) | VCPayt+1 (4) | VCPayt+1 (5) | VCPayt+1 (6) | VCPayt+1 (7) | VCPayt+1 (8) | VCPayt+1 (9) | |
|---|---|---|---|---|---|---|---|---|---|---|
| Sample based on | GUG Obs | QS Obs | ARWU Obs | ARWU Obs | ARWU Obs | Total sample | GUG Obs | QS Obs | ARWU Obs | |
| Performance measures | ||||||||||
| LnGUG Rank Scoreit | + | 0.075 | 0.112 | −0.310 | ||||||
| 0.219 | 0.462 | (−0.777) | ||||||||
| LnQS Rank Scoreit | + | 0.154 | 0.256*** | 0.055 | ||||||
| 1.519 | 2.998 | 0.376 | ||||||||
| LnARWU Rank Scoreit | + | 1.154*** | 0.337 | |||||||
| 7.049 | 1.455 | |||||||||
| Alternative size measures | ||||||||||
| LnEndowmentsit | + | −0.005 | −0.005 | −0.009 | −0.011 | |||||
| (−0.691) | (−0.593) | (−1.351) | (−1.648) | |||||||
| LnGovFundit | + | −0.383 | −0.421 | 0.100 | 0.690*** | |||||
| (−1.017) | (−1.137) | 0.296 | 4.188 | |||||||
| LnResearch Income | + | −0.178 | −0.104 | −0.288 | −0.844* | |||||
| (−0.900) | (−0.552) | (−0.765) | (−1.941) | |||||||
| LnDomFFRevit | + | 0.019 | 0.041 | 0.075 | 0.331** | |||||
| 0.175 | 0.365 | 0.459 | 2.151 | |||||||
| LnIntStuRevit | + | −0.444* | −0.436 | −0.165 | −0.489** | |||||
| (−1.730) | (−1.653) | (−0.605) | (−2.471) | |||||||
| Institutional controls | ||||||||||
| TCouncilit | +/− | −0.017* | −0.009 | −0.009 | −0.022 | −0.005 | 0.020 | 0.027 | 0.018 | −0.058*** |
| (−1.798) | (−0.673) | (−0.601) | (−1.488) | (−0.309) | 0.515 | 0.649 | 0.392 | (−3.034) | ||
| ChancellorExpit | 0.032 | 0.041 | 0.114*** | 0.105*** | 0.109** | −0.085 | −0.092 | 0.003 | 0.277*** | |
| 0.313 | 0.365 | 3.470 | 4.321 | 2.888 | (−0.659) | (−0.821) | 0.018 | 4.391 | ||
| TCampusit | + | −0.063* | −0.015 | 0.000 | −0.012 | 0.012 | 0.057 | 0.062 | 0.017 | 0.098** |
| (−2.026) | (−0.530) | 0.000 | (−0.341) | 0.433 | 0.587 | 0.600 | 0.225 | 2.221 | ||
| TFacultiesit | + | −0.040* | −0.044*** | −0.031*** | −0.046*** | −0.037** | −0.027 | −0.025 | −0.026 | −0.037* |
| (−1.783) | (−3.482) | (−2.988) | (−4.908) | (−2.702) | (−1.664) | (−1.599) | (−1.117) | (−1.846) | ||
| Financial controls | ||||||||||
| OpExp_R | − | −2.084 | −0.928 | −0.242 | 0.599 | −0.314 | −3.088** | −3.102** | −0.824 | −0.254 |
| (−1.444) | (−0.969) | (−0.319) | 0.634 | (−0.337) | (−2.293) | (−2.389) | (−1.018) | (−0.328) | ||
| Debt/Equityit | − | −0.124 | 0.448* | 0.059 | 0.163 | 0.483 | 0.585 | 0.460 | 0.865** | 0.557* |
| (−0.500) | 1.804 | 0.355 | 0.477 | 1.431 | 1.388 | 1.328 | 2.776 | 1.755 | ||
| ROEit | + | −0.047 | −0.352 | 0.547 | 2.378 | 1.12 | −1.642 | −1.463 | 0.425 | 1.037 |
| (−0.026) | (−0.235) | 0.402 | 1.394 | 0.789 | (−0.858) | (−0.777) | 0.281 | 0.664 | ||
| Constant | 16.027*** | 14.201*** | 10.948*** | 13.246*** | 12.887*** | 15.911*** | 16.805*** | 13.576*** | 13.424*** | |
| 7.968 | 12.422 | 12.577 | 7.394 | 13.134 | 10.363 | 7.926 | 10.052 | 11.574 | ||
| Observations | 131 | 99 | 75 | 75 | 70 | 90 | 90 | 80 | 55 | |
| Adj. R2 | 0.188 | 0.144 | 0.359 | 0.129 | 0.277 | 0.158 | 0.162 | 0.100 | 0.510 | |
| F-statistic | 4.765 | 6.403 | 15.347 | 15.806 | 6.665 | 3.293 | 3.651 | 8.936 | 33.007 | |
| Fixed effects (Uni & Year) | Yes | Yes | Yes | Yes | Yes | Yes | Yes | Yes | Yes | |
- t statistics *p < 0.10, **p < 0.05, ***p < 0.010.
The results are consistent with the results reported in Table 5 and indicate that only the ARWU (column 3) and QS (columns 5) external performance measures are significant (at the 1 percent level, but only for the ARWU sub-sample) and positively associated with next years’ VCs’ compensation. However, in line with our previous tests, the external performance measures are no longer significant once we introduce the alternative size measures.
Of the alternative size measures, the results indicate a significant positive association between VC compensation and revenue from government funding as well as domestic full-fee revenue but only for the ARWU sample (column 9). However, VCs’ compensation is negatively associated with prior year international student revenue (columns 6 and 9). Overall, there is only weak evidence that the alternative size measures explain the VCs’ compensation for the subsequent year.
Of the institutional control variables, total council members (TCouncil), the Chancellor experience indicator variable (ChancellorExp) and total faculties (TFaculties) are statistically significant. Total faculties on six occasions are negatively associated with next years’ VCs’ compensation (columns 1–5, 9). Total council members (TCouncil) on two occasions (columns 1 and 9) are negatively associated with next years’ VCs’ compensation. The Chancellor experience indicator variable on four occasions has a significant positive association with next years’ VCs’ compensation; however, this only applies to universities included in the ARWU sample. One plausible explanation for this finding is that Chancellors with governmental or legal background have limited experience in determining VCs’ compensation and consequently they are more likely to utilise external consultants to benchmark VCs compensation (Nugent, 2015).
The financial control variables do not provide statistically consistent results. On two occasions (columns 6 and 7) the operating expense ratio (OpExp_R) is negative and significant, which is to be expected. The debt/equity ratio on three occasions (columns 2, 8 and 9) are positive and significant, indicating that the current year’s debt funding is associated with next years’ VCs’ compensation.
In summary, our key findings are as follows. We do not find statistically reliable evidence that VCs’ compensation is associated with university performance as measured by external rankings. While some of our tests indicate a positive association between levels and changes in VCs’ compensation and university rankings, these results are sensitive to controlling for the alternative size measures.
4.2 Discussion of findings
Under NPM, the intention is to link senior executive compensation to performance in not-for-profit entities. Our evidence tests this expected pay-for-performance relation within the Australian university setting utilising rankings as an external performance measure. We utilise rankings as a performance measure as they provide an independent quantitative measure of the university’s performance in its core business operations comprising teaching and research. Our results indicate that the levels and changes in VCs’ compensation are not statistically associated with external rankings. Recent descriptive evidence also supports these main findings. For example, Monash University’s ARWU country position in the ARWU rankings went from 78 in 2017 to 91 in 2018, yet the VC’s compensation increased from $995,000 in 2017 to $1,105,000 in 2018. Similarly, the QS ranking for the University of Sydney went down from 46 to 50, yet the VC’s compensation increased from $1,477,500 in 2017 to $1,522,500 in 2018. There are at least three plausible explanations for the findings in this study: (i) rankings are a poor measure of universities’ performance, or (ii) university councils lack the motivation, expertise and experience to link VCs’ compensation to external quantifiable measures, or (iii) VC’s can ‘capture’ their councils and receive compensation which is not tied to performance. Based on our evidence, we cannot discriminate between these three alternative explanations.
5 Sensitivity and additional analysis
In this section, we undertake a number of sensitivity and additional tests. Specifically, we test: (i) the sensitivity of the results to alternative size measures, (ii) the association between VC compensation and the individual components of the GUG, QS and ARWU rankings, (iii) if bonus payments to VCs are associated with university rankings, (iv) the association between next year’s VC compensation and the current year’s movement in ranking position within Australia, and (v) the association between next year’s change in rank position and current years VCs’ compensation.
5.1 Alternative size measures, namely total revenue, EFTSL and total staff
Three additional alternative size measures are independently used to assess if the results are robust to alternative size proxies. The three measures used are respectively (i) total revenue, (ii) effective full-time student load, and (iii) total academic and non-academic staff. The findings using these alternative size measures (results not tabulated) mirror the main test results in that the size measure is the only consistently statistically significant variable associated with the levels and growth in VCs’ compensation.
5.2 GUG, QS and ARWU individual ranking measures
The GUG rankings comprises eight individual ranking scores, while the QS and ARWU rankings comprise six individual rank scores (see Appendix III). The results (not tabulated) do not support any statistically significant results between the GUG individual rankings and VCs’ compensation. The QS individual measures are significant on three from six components, QS-Academic Reputation, QS-Employer Reputation and QS-International Faculty. The ARWU individual rank measures are significant for two of six components, namely publications (PUB) and the weighted research score per full-time academic (PCP). However, just as in the main tests, once the alternative size measures are introduced, all individual external ranking measures become statistically insignificant.
5.3 Bonus payments
Frumkin and Keating (2010) assert that the presence of surplus cash in the education sector may encourage bonuses and increases in compensation.16 We provide preliminary evidence on the association between bonus payments and external rankings using the GUG rankings data. This analysis needs to be interpreted with caution, as we only have 23 observations for bonus payments to VCs. Our results indicate that external rankings are not associated with bonus payments. Of the alternative size measures, only domestic full-fee paying students have a significant positive association with VC bonus compensation. Of note is that despite international students providing more than double the revenue of domestic students, there is a negative and statistically significant coefficient for international student revenues. These findings suggest that bonuses for VCs are predominantly based on metrics not included in the regression model (see Appendix I).
5.4 Changes in next years’ VC compensation and current year’s movement in ranking position within Australia
We also test the association between next year’s VC compensation and the current year’s movements in the university’s ranking position amongst Australian universities. Only the QS rank measure is statistically significant, with the change in rank position having a negative influence on next years’ VC compensation. Of the alternative size measures, government funding and international student revenue are significant, having a positive and negative influence on next years’ VC compensation, respectively.
5.5 Changes in next years’ rank position and current years’ VC compensation
We also test the association between next year’s rankings (change in rank position) with current year’s VC compensation (change in VC compensation). We find that there is very little support for rankings and changes in ranking position being associated with current levels or changes in VC compensation. On two occasions, we find a significant negative association between next years’ ranking score and current VC compensation for the ARWU sample. For the changes model, we find no significant statistical association between changes in the rank position and VC compensation.
6 Conclusions, policy recommendations and future research
This study provides evidence on the pay-for-performance relation between VCs’ compensation and external university rankings. There is only limited statistical support that external rankings are associated with the levels and changes in VCs’ compensation. On the other hand, the alternative size measures comprising the components of revenue, particularly domestic student revenue, are consistently positively associated with the levels and increases in VCs’ compensation.
Our results have a number of important policy implications. First, our results indicate that VCs have an incentive to maximise student numbers and associated revenue streams as this results in higher compensation. Universities’ overriding objectives ought to be improving teaching and research outcomes as clearly stated in the Independent Commission Against Corruption (ICAC) Report, 2015; hence, VCs’ compensation should be explicitly aligned to these objectives for which metrics are provided by independent external ranking agencies. Given the homogeneous environment in which Australian universities operate, an independent tribunal could be formed to determine VCs’ compensation not unlike the determination of politicians’ compensation by the Remuneration Tribunal (Australian Government, 1973, 1990). Furthermore, the Tribunal could benchmark Australian VCs’ compensation against the compensation of VCs of international universities like the University of Oxford or The University of Auckland. Second, VCs’ compensation could have two explicit components comprising a base salary and bonus payments. The bonus payments should be tied to external, independent and quantifiable targets based on teaching, research, student employability, and endowments, amongst others. Third, universities’ annual reports ought to include clear reporting of VCs and Deputy VCs with respect to pecuniary and non-pecuniary benefits and provide information on the financial and non-financial performance targets used to determine the levels and growth in VC compensation. This reporting requirement could be consistent with that of the compensation disclosures of publicly listed companies. Our contention is that the above policy recommendations would align universities’ objectives and performance better with VCs’ compensation. Finally, our research could potentially contribute to the ‘new review of performance-based funding’ (Dodd, 2019) of universities by the Federal Government.
Future research may extend this study in a number of respects. First, researchers could survey universities to obtain more information on explicit financial and non-financial performance indicators that are utilised by the remuneration committee to determine VCs’ compensation. Currently, quantitative performance indicators are not disclosed in the annual reports for either levels or changes in VCs’ compensation. Second, researchers can analyse the pay-for-performance link for executive compensation in other settings in the not-for-profit sector, including trade unions, professional associations and charities.
| ¶University Groupings | Count |
|---|---|
| GO8 − Australian University Group of Eight | 8 |
| ATN − Australian University Technology Network | 5 |
| IRU − Innovative Research Universities | 6 |
| Regional − Regional Universities Network | 6 |
| Other − No grouping | 12 |
| Total | 37 |
Appendix I
- Examples of annual performance achievements based on rankings included in Annual Reports.
Monash University Annual Report 2011 – “The overall indicators were positive with Monash rising 12 places in the Shanghai Jiao Tong (ARWU) rankings and an estimated 61 places in the Times Higher Education rankings scale.
Professor Ed Byrne, AO Vice-Chancellor and President
University of Melbourne Annual Report 2014 – “This is the first time an Australian institution has been ranked in the Top 50 of the best research universities in the world. Ranked 44th in the Academic Rankings of World Universities, the University of Melbourne was ranked 44th in the Academic Rankings of World Universities (ARWU) from Shanghai Jiao Tong University, the first time an Australian institution has been ranked in the top 50 on the ARWU list of best research universities in the world.”
Professor Glyn Davis AC Vice-Chancellor.
University of Technology Sydney, Annual Report 2016 - For the first time we ranked in the top 200 universities globally by the QS World University Rankings. We also ranked as the top young university in Australia by the Times Higher Education 150 Under 50 Rankings 2016 and the QS Top 50 Under 50 2016–2017. Our rankings success is reflected in our research funding outcomes where we saw improved success rates in almost every Australian Research Council scheme.
- Advertisements for the selection and appointment of Vice Chancellors
Australian National University recruitment of Vice Chancellor 2015
Position Description and Selection Criteria
Role of the Vice Chancellor
ANU is a research-intensive educational institution of international distinction, one of the top 100 – and, in some rankings, in the top 25 – universities in the world, and one of the top two in Australia.
The Vice-Chancellor, as President and Chief Executive Officer, is responsible for leading and managing the University’s academic, operational and external affairs – shaping, articulating and implementing the University’s strategic objectives in research, education and contribution to public policy development.
The Vice-Chancellor is appointed by the University Council, is responsible to it through the Chancellor for the leadership and management of the University, and works closely with the Council in the exercise of its governance roles of strategic oversight, ensuring effective overall management and ensuring responsible financial management.
Extract from ‘Appointment of Vice-Chancellor and President – Information for candidates’, Australian National University, p. 36
Appendix II


Appendix III
Individual Ranking measures used to determine the total rank score
| ST_DemG | Student demand for the university |
|---|---|
| Components of GUG ranking measures | |
| Res_Grants | Ability to attract research funding |
| Research Intensity | Research publications |
| Prop> 25G | Proportion of students aged greater than 25 |
| International Students | Proportion of international students |
| Grad_Start_SalG | Graduate starting salary |
| Get_Job | Ability to get a job |
| Pos_Grad_OutG | Positive graduate outcomes |
| Components of QS ranking measures | |
| Alumniarwu | Alumni of an institution winning Nobel Prizes and Fields Medals |
| Awardarwu | Staff of an institution winning Nobel Prizes and Fields Medals |
| HICIarwu | Highly cited researchers in 21 broad subject categories |
| NSarwu | Papers published in Nature and Science |
| PUBarwu | Papers in Science Citation Index-expanded & Social Science Citation Index |
| PCParwu | Per capita academic performance of an institution |
| Components of ARWU ranking measures | |
| Acad_Repqs | Academic reputation – teaching and research quality |
| Emp_Repqs | Employer reputation |
| Fac_Stud_Ratioqs | Faculty student ratio |
| Cits_per_facultyqs | Citations per faculty |
| Int_Faculty_Ratioqs | International faculty ratio |
| Int_Stud_Ratioqs | International student ratio |
Appendix IV
University listing, ranking participation, classification and compensation data
| University | GUG† | QS‡ | ARWU§ | University grouping¶ | VC bonus obs. | Average salary 2005−2012 | Average growth in VC pay 2005−2012 | |
|---|---|---|---|---|---|---|---|---|
| 1 | Australian Catholic University (ACU) | * | Other | 6,93,333 | 12.01% | |||
| 2 | Australian National University (ANU) | * | * | * | GO8 | 1 | 9,49,396 | 21.78% |
| 3 | Central Queensland University (CQU) | * | Regional | 5,50,833 | 12.95% | |||
| 4 | Charles Darwin University (CDU) | * | IRU | 6,12,666 | 12.42% | |||
| 5 | Charles Sturt University (CSU) | * | Other | 5,00,000 | ||||
| 6 | Curtin University of Technology (CUT) | * | * | * | ATN | 6,46,667 | 11.69% | |
| 7 | Deakin University (DEAK) | * | * | Other | 6,48,333 | 13.95% | ||
| 8 | Edith Cowan University (ECU) | * | Other | 5,86,667 | 9.35% | |||
| 9 | Flinders University (FLU) | * | * | * | IRU | 2 | 5,60,666 | 19.32% |
| 10 | Griffith University (GRU) | * | * | * | IRU | 6,09,375 | 7.56% | |
| 11 | James Cook University (JCU) | * | * | * | IRU | 5,44,500 | 12.87% | |
| 12 | La Trobe University (LAT) | * | * | * | IRU | 6,77,500 | 15.51% | |
| 13 | Macquarie University (MACQ) | * | * | * | Other | 2 | 9,07,577 | 23.52% |
| 14 | Monash University (MON) | * | * | * | GO8 | 7 | 8,07,785 | 8.84% |
| 15 | Murdoch University (MURD) | * | * | * | IRU | 7,52,572 | 10.69% | |
| 16 | Queensland University of Technology (QUT) | * | * | ATN | 5,93,554 | 11.40% | ||
| 17 | Royal Melbourne Institute of Technology (RMIT) | * | * | ATN | 7,02,312 | 9.29% | ||
| 18 | Southern Cross University (SCU) | * | Regional | 6,58,750 | 11.30% | |||
| 19 | Swinburne University of Technology (SWN) | * | * | * | Other | 5,03,333 | 11.11% | |
| 20 | The University of Adelaide (UADEL) | * | * | * | GO8 | 5,68,333 | 34.70% | |
| 21 | The University of Melbourne (UMEL) | * | * | * | GO8 | 7,28,750 | 6.91% | |
| 22 | The University of New South Wales (UNSW) | * | * | * | GO8 | 5,95,000 | 7.98% | |
| 23 | The University of Newcastle (NEWC) | * | * | * | Other | 2 | 5,46,666 | 20.73% |
| 24 | The University of Queensland (UQ) | * | * | * | GO8 | 8,67,500 | 4.14% | |
| 25 | The University of Sydney (USYD) | * | * | * | GO8 | 3 | 5,21,411 | 12.27% |
| 26 | The University of Western Australia (UWA) | * | * | * | GO8 | 8,93,785 | −6.05% | |
| 27 | University of Ballarat (UB) | * | * | Regional | 6,01,666 | 10.54% | ||
| 28 | University of Canberra (UCAN) | * | * | Other | 10,12,500 | 8.77% | ||
| 29 | University of New England (UNE) | * | * | Regional | 2 | 6,20,000 | 17.64% | |
| 30 | University of South Australia (USA) | * | * | ATN | 4,51,833 | 16.94% | ||
| 31 | University of Southern Queensland (USQ) | * | Regional | 1 | 4,97,857 | 15.72% | ||
| 32 | University of Tasmania (UTAS) | * | * | * | Other | 8,84,918 | −3.17% | |
| 33 | University of Technology Sydney (UTS) | * | * | * | ATN | 3 | 4,59,916 | 8.48% |
| 34 | University of the Sunshine Coast (USC) | * | Regional | 6,68,193 | 7.43% | |||
| 35 | University of Western Sydney (UWS) | * | * | Other | 6,68,333 | 17.49% | ||
| 36 | University of Wollongong (UOW) | * | * | * | Other | 6,81,375 | 7.73% | |
| 37 | Victoria University (VU) | * | Other | 5,45,000 | 7.25% | |||
| Number of universities in sample | 37 | 27 | 21 | 23 | 6,57,266 | 11.97% | ||
| Rankings |
- † GUG − Good University Guide Ranking Observations.
- ‡ QS − Quacquarelli Symonds − QS World University Rankings.
- §
ARWU − Shanghai Rankings − Academic Ranking of World Universities.
¶University Groupings Count GO8 − Australian University Group of Eight 8 ATN − Australian University Technology Network 5 IRU − Innovative Research Universities 6 Regional − Regional Universities Network 6 Other − No grouping 12 Total 37
References
- 1 ‘New Public Management’ (NPM) resulted in the corporatisation and commercialisation of public sector entities with the objective of enhancing the economic efficiency and effectiveness of the public sector (Hood, 1989).
- 2 Although it is acknowledged that external rankings are an imperfect measure of university performance, rankings are nevertheless used by universities for promotional activities on their website and annual reports, providing university councils a benchmark for advertising and subsequent appointment of VCs, as well as justification for the payment of VC bonuses (see Appendices I and II).
- 3 For consistency, we use the term CEO in this study to identify the most senior executive in an organisation. We acknowledge that the actual title is likely to differ across not-for-profit sectors and specific entities. These sectors comprise educational, charitable institutions, hospitals/medical and law enforcement, etc.
- 4 The Australian university setting is distinctly different from the US setting, where there are both public and private universities. Accordingly, we have excluded three small private universities from our sample.
- 5 The commercialisation of the university sector based on a user pay student funding system was introduced by the Australian Government in the Dawkins Report (Dawkins 1988), with further commercialisation of the university sector introduced by the Bradley Review (Bradley et al., 2008). These reviews are aimed at increasing the size of the tertiary education sector whilst reducing government funding.
- 6 University stature is based on four measures being the quality of enrolled students, the average salary of professors, tuition fees and the size of endowments.
- 7 Individuals comprise members, officers, directors or trustees.
- 8 Under the Australian Constitution, each state has the legislative jurisdiction over all tiers of education. For example, the University of Sydney Act 1989, is legislation governing all aspects of university operations introduced and amended by the New South Wales Government.
- 9 Australian Federal Government (1988) Higher Education Funding Act.
- 10 Government funding as a percentage of university income has reduced from 90 percent in 1981 to approximately 41 percent in 2012 (Dodd, 2014a).
- 11 Free et al. (2009) highlight the limitations of rankings arising from the lack of auditability of the information provided to ranking agencies.
- 12 It would be inappropriate to include a new VC’s compensation in our analysis as new appointments have not been in the position long enough to impact on performance. Furthermore, retiring VCs usually receive a payout that includes accumulated leave and superannuation entitlements coupled with a termination bonus, which would distort the pay/performance relation.
- 13 Not all universities in the analysis have the same number of annual observations. For example, the sample includes two contiguous ranges for the University of Sydney, being the years 2005–2006 and 2009–2012 with 2007 and 2008 excluded due to a departing VC in 2007 and an incoming VC in 2008. Due to this variation in the number of annual observations, the sample comprises an unbalanced panel data set.
- 14 We also define the ChancellorExp variable as one if the chancellor has prior business experience. The results (not tabulated) are insignificant in all of the analyses.
- 15 The Hausman test is used to determine whether to apply fixed or random effects.
- 16 Sample data reports the mean cash balance of universities is >A$70 million.