The joint information role of analysts’ cash flow and earnings forecasts
Abstract
We study whether the relative magnitudes of analysts’ cash flow and earnings forecasts convey information about the persistence and value relevance of reported earnings. We find that reported earnings are likely to be more (less) persistent and value relevant when analysts forecast relatively moderate (extreme) levels of operating cash flows, relative to earnings. We also find that the market’s response to a given earnings surprise is the strongest for moderate levels of cash flow forecasts relative to earnings. The joint information role of analysts’ cash flow and earnings forecasts persists even after controlling for the absolute accruals in the model.
1 Introduction
A growing body of research examines questions relating to analysts’ cash flow (CPS) forecasts (DeFond and Hung, 2003; Givoly et al., 2009; McInnis and Collins, 2011; Call et al., 2013). Although recent studies suggest that these forecasts provide information about expected accruals, they have not directly examined the extent to which CPS and earnings (EPS) forecasts jointly provide information about the properties of a firm’s reported earnings. We answer this important question in this study. Specifically, we examine whether the relative magnitude of expected operating cash flow in earnings, as implied by the ratio of CPS and EPS forecasts, conveys information about the persistence and value relevance of a firm’s reported earnings. We also test whether these forecasts jointly affect the market’s response to the earnings surprise.
We argue that the information jointly provided by analysts’ CPS and earnings forecasts is likely to be more useful than that provided by the individual forecasts. Our argument is based on standard-setters’ view that financial statements complement each other in providing decision-useful information to users. Specifically, the Financial Accounting Standards Board (FASB) argues that the Statement of Cash Flow provides information not reflected in earnings or comprehensive income. Practitioners also echo this view. As Dichev et al.(2013) note, Chief Financial Officers (CFOs) consider earnings to be of good quality, if it is backed by cash flows.
Yet, as the FASB notes, the Statement of Cash Flows by itself provides an incomplete basis for assessing future cash flows, as it does not capture inter-period relationships (FASB Concept Statement 5, para. 24b). Therefore, analysing cash flows and earnings jointly provides a better basis for assessing performance than analysing any one performance metric.
The FASB’s view is supported by research evidence (Yee, 2007) that earnings and cash flows play a complementary role in providing information about firm value. Extrapolating these ideas to forecasts, we argue that CPS and EPS forecasts are likely to provide complementary information about earnings quality. Prior studies (McInnis and Collins, 2011 and Mohanram, 2014) show that CPS forecasts provide information about the accrual component of earnings. These studies, however, do not explicitly test whether relative magnitude of CPS forecasts can predict the quality and decision usefulness of reported earnings. This is an important question, as it speaks to both the analysts’ ability to identify the extent of accruals in future reported earnings, and to the usefulness of their forecasts.
Our premise, that the information content of future earnings is conditional on the information conveyed by EPS and CPS forecasts jointly, is based on prior research that finds that prior information conditions investors’ response to new information. For example, Freeman and Tse (1989) show how investors use prior quarters’ earnings to evaluate current quarterly earnings; Banker et al.(1993) present evidence that shareholders use information about capital expenditures and cash constraints to interpret stock dividend announcements; and Conrad et al.(2002) show that the price response to bad news and good news earnings is a function of the relative level of the changes in market conditions. More recently, Erickson et al.(2016) show that investors become suspicious of earnings management when managers report smooth earnings, when they have prior information about managers’ opportunity and incentives to manage earnings.
We also argue that EPS and CPS forecasts (especially) individually cannot provide complete information to evaluate earnings quality and firm performance. This is exemplified by some past CPS forecast literature that finds that these forecasts have limited usefulness. For instance, Givoly et al.(2009) find that CPS forecast errors are weakly associated with abnormal earnings and Brown and Christensen (2014) find that the quality of street cash flow from operations is strictly inferior to GAAP cash flow from operations and the market also perceives them as such.
Dechow et al.(1998) and Dechow and Dichev (2002) show that there is a negative (positive) correlation between current cash flows and current (past/future) accruals. Accordingly, we argue that if analysts forecast a relatively low level of cash flow (with respect to earnings) for the current period, then it is likely that they expect more of the current reported earnings to be driven by accruals. If the CPS forecast is relatively high, it would suggest that analysts expect the firm to have realised past accruals, or received advance payments in the current period. Neither of these cases suggests that contemporaneous reported earnings are expected to be supported by cash flow. Accordingly, we expect that when analysts forecast more extreme levels of cash flow, relative to earnings, they also likely forecast extreme levels of accruals implicitly. This would suggest that future earnings would be less persistent.
In contrast, moderate CPS forecasts would indicate a more ‘optimal’ expected correspondence between current reported earnings and cash flow. Therefore, comparing the relative magnitudes of the CPS and EPS forecasts can provide insights into the extent to which expected cash flow and earnings correspond with each other. In our study, we adopt this simple strategy and compare the relative magnitudes of the CPS and EPS forecasts by analysing the ratio of these forecasts. As cash flows are more persistent than accruals (Sloan, 1996), earnings backed by cash flow would be more persistent.
We thus begin our analysis by examining how the relative magnitudes of the EPS and CPS forecasts are associated with earnings persistence. We create quintiles (hereafter, rank), based on the magnitude of the ratio of CPS and EPS forecasts and find that the persistence of reported earnings improves monotonically from the lowest quintile of rank to the 3rd quintile, before declining again.
We next examine the joint information role of the EPS and CPS forecasts further, by studying whether they provide any information about the value relevance of reported earnings. We focus on value relevance, because providing decision-useful financial statements is the objective of financial reporting (see FASB Statement of Accounting Concepts Number 8). Consistent with our argument above, if the correspondence between CPS and EPS forecasts, is good, it would likely indicate higher value relevance of reported earnings. That is, we would expect the value relevance of reported earnings to increase from the lowest quintiles of rank to the middle quintiles and then decline again. Using both price and return specifications to capture value relevance, we find that the value relevance of reported earnings increases from the lowest quintile of rank to the second quintile and declines as we approach the highest quintile of rank.
We next study how equity market participants use this information. Specifically, is the market response to an earnings surprise influenced by the joint information content of the EPS and CPS forecast? We argue that when there is an optimal mapping between current period expected earnings and cash flow, there would be a stronger market response to the earnings surprise, if investors understand the implications of the mapping for the properties of earnings.
Articles in the business press underscore the importance of CPS forecasts. For example, the market responded positively to LinkedIn’s second-quarter financial performance in 2013 on account of the company beating Wall Street’s expectations of revenues, earnings and cash flow. In contrast, Moody’s Japan downgraded Nippon Yusen Kabushiki Kaisha's (NYK) issuer rating to Baa3 from Baa2 in 2016, with a negative outlook, owing to weak expected future earnings and cash flow. These examples clearly suggest that the market views CPS forecasts as complementing the information conveyed by the EPS forecasts and revenue forecasts.
Using the three-day abnormal return around the earnings announcement, we show that the market’s response to the earnings surprise increases from the lowest quintile of rank, to the middle quintile, and, thereafter, decreases. This suggests that investors understand the implications of the mapping between current cash flow and earnings, for the quality of the earnings surprise. We also find a similar market response to the cash flow surprise, suggesting that the market’s response to the cash flow surprise is also a function of the extent of map between the current level of expected cash flow and earnings.
We perform some important additional analyses. First, we examine whether the EPS (or CPS) forecast can individually provide information about the persistence and value relevance of reported earnings. Our results show that there is no systematic association between the EPS (and CPS) quintiles and earnings persistence and value relevance. This is an important result. It points to the importance of analysing both the EPS and CPS forecasts when available, for a more accurate picture of firm performance.
We also study whether EPS and CPS forecasts jointly affect stock return volatility. Prior research (Rajgopal and Venkatachalam, 2011) shows that high accounting quality reduces investors’ uncertainty about a firm’s prospects. To the extent that CPS and EPS forecasts jointly provide information about earnings quality, they would likely affect investors’ risk perception. Specifically, good (poor) expected mapping between reported cash flow and earnings would likely reduce (increase) investors’ uncertainty about a firm, resulting in lower (higher) return volatility. We find results consistent with this expectation.
We make important contributions to the literature. First, to the best of our knowledge, ours is the first study to investigate the joint information role of analysts’ earnings and cash flow forecasts. By providing evidence on how the relative magnitudes of the EPS and CPS forecasts provide information about earnings persistence and the value relevance of earnings, we show that these two forecasts provide more information than each individual forecast can. We also show that market participants appear to use the information contained in both forecasts to evaluate the quality of the earnings surprise.
We also contribute to the literature by showing that the magnitude of analysts’ CPS forecast (relative to the earnings forecast) provides incremental evidence to help investors assess earnings quality. Our result clarifies the role of CPS forecasts and helps reconcile the (seemingly) contradictory results in Call et al.(2013) and Givoly et al.(2009) on the usefulness of these forecasts. Specifically, Givoly et al.(2009) argue that analysts’ CPS forecasts are unsophisticated and do not reflect market expectations of cash flow or provide information about accruals – they find a weak market response to the CPS forecast error, controlling for the EPS forecast error. In contrast, Call et al.(2013) argue that analysts do make sophisticated adjustments for working capital and show that there is a significant market response to CPS forecast revisions, controlling for EPS forecast revisions. However, neither Call et al.(2013) nor Givoly et al.(2009) consider the joint information role of EPS and CPS forecasts – the focus of our study. We show that CPS forecasts are important when used in conjunction with EPS forecasts and not as standalone performance measures. These results clarify the role of CPS forecasts and help us explain what they are (not) useful for.
The paper is organised as follows. We build our hypotheses in Section 2; Section 3 describes the data and the results of the empirical estimation. Section 4 concludes.
2 Hypotheses and research methodology
2.1 Hypotheses
Since the pioneering study by DeFond and Hung (2003), several studies have examined questions relating to the usefulness of analysts’ CPS forecasts. One of the early studies, by Givoly et al.(2009), analysed the market response to cash flow and earnings forecast errors and found that, controlling for the earnings forecast error, there is no incremental market response to the cash flow forecast error. Givoly et al.(2009) dismiss the information role of CPS forecasts, arguing that they are naïve extensions of EPS forecasts – analysts seem to only adjust for depreciation. Givoly et al’s (2009) findings were criticised by Call et al.(2013), who presented evidence that analysts appear to make adjustments for working capital (i.e., analysts’ CPS forecasts are not naïve extensions of EPS forecasts) and showed that the market responds to CPS forecast revisions, even after controlling for EPS forecast revisions. In a more recent study, Yoo and Pae (2016) find that the market responds to (positive) CPS forecast revisions when analysts concurrently issue (negative) earnings forecast revisions. They also find that the market responds to the sign (and not the magnitude) of the CPS forecast revision, when analysts revise EPS forecasts in the opposite direction. These results suggest that CPS forecasts do convey incremental information to market participants. Similarly, Jung (2015) shows that analysts who issue CPS forecasts predict long-term earnings more accurately than analysts who do not and that the provision of CPS forecasts is associated with a lower cost of equity capital, since these forecasts reduce information asymmetry. These studies are important because they highlight the importance of CPS forecasts. However, they do not consider the joint information role of earnings and CPS forecasts.
Some prior studies suggest that EPS and CPS forecasts play a complementary role. DeFond and Hung (2003) argue that analysts provide CPS forecasts in response to investor demand for such forecasts. Specifically, analysts provide cash flow forecasts when it becomes difficult to rely on earnings forecasts solely for assessing firm performance. Indeed, Tan and Sidhu (2012) show that analysts have limited ability to incorporate variability into their forecasts. Specifically, they are much more likely to be able to incorporate variability when income smoothing is high and operating performance less variable. These results further support the argument that earnings forecasts may not, by themselves, suffice as performance benchmarks. In a recent study, Konstantinidi et al.(2016) show that the accrual anomaly persists only for good news earnings. Their results suggest that investors (at least partially) recognise the differential persistence of accruals and cash flows. More closely related to our study, Mohanram (2014) and Radhakrishnan and Wu (2014) suggest that CPS forecasts help investors assess the accrual component of earnings and show that the presence of CPS forecasts helps mitigate the accrual anomaly. However, neither Mohanram (2014) nor Radhakrishnan and Wu (2014) consider the relative magnitudes of the EPS and CPS forecasts in their study. We build on their arguments and argue that if investors recognise the greater persistence of cash flow, they would react more strongly to the earnings surprise, when there is a better expected mapping between current cash flow and earnings, as suggested by analysts’ forecasts.
2.1.1 EPS and CPS forecasts and earnings persistence
 ()
() ()
()In other words, the current cash flow can relate to past earnings, current earnings and future earnings. Based on the above discussion, we could argue that at one extreme, if the CPS forecast is low relative to the EPS forecasts, analysts likely expect more of the current reported earnings to be driven by accruals. As accruals tend to be less persistent than cash flow (Sloan, 1996), the reported earnings corresponding to such cases, would likely be less persistent. At the other extreme, when the CPS forecast is high relative to the earnings forecast, it could be that analysts expect the firm to successfully realise past accruals in the current period, or have advance cash receipts for future accruals. Thus, there would be little association between current period earnings and cash flow. This would also imply that current period reported earnings would have lower persistence in such cases.
In contrast, if analysts forecast moderate levels of cash flow relative to earnings, however, it would suggest that analysts expect more balanced levels of cash flow and accruals in earnings. These cases would likely be associated with more persistent reported earnings.
H1. The relationship between earnings persistence and the ratio of the cash flow forecast to the earnings forecast is non-linear; it increases and then decreases after the mid-point of the distribution.
2.1.2 EPS and CPS forecasts and the value relevance of earnings
We next study whether EPS and CPS forecasts jointly inform investors about the value relevance of earnings. We focus on value relevance because decision usefulness is the stated objective of financial statements, according to the accounting standard-setters. The underlying idea is that financial statements should convey information that enables a range of users to make economic decisions.
H2. The extent to which earnings affects firm value is a function of the ratio of the cash flow forecast to the earnings forecast; it increases and then decreases after the mid-point of the distribution.
We next study how the market uses the information jointly conveyed by the EPS and CPS forecasts.
2.1.3 EPS and CPS forecasts and the market reaction to the earnings surprise
Barth et al.(2001) argue that cash flow conveys incremental information over earnings, which aids in valuation. This is because cash flow is more persistent than accruals (Sloan, 1996). Therefore, if earnings are supported by cash flow, it indicates that the earnings are likely to be more persistent and, therefore, of higher quality. Consistent with this reasoning, Brown et al.(2013) find that firms that meet or beat both analysts' CPS forecasts and EPS forecasts are likely to have superior future performance than firms that just beat the EPS forecasts. We argue that if investors recognise the greater persistence of cash flow, they would react more strongly to the earnings surprise when there is a better expected mapping between current cash flow and earnings, as suggested by analysts’ forecasts.
H3. The extent to which the current earnings surprise elicits an abnormal stock return depends upon the ratio of the cash flow forecast to the earnings forecast; it increases and then decreases after the mid-point of the distribution.
2.2 Research methodology
2.2.1 Measuring the joint information content of analysts’ CPS and EPS forecasts
We adopt a simple approach to characterise the joint information content of analysts’ CPS and EPS forecasts. As mentioned above, we first take the ratio of the CPS and EPS forecasts. We construct the ratio of the consensus CPS and EPS forecast each quarter. This ratio measures the extent to which analysts expect forecasted earnings to be supported by cash flow. We then isolate cases where analysts forecast negative EPS. Focusing only on the positive EPS and CPS forecasts, we form quintiles by quarter, which we call rank. Thus, lower (higher) values of rank include observations where analysts expect lower (higher) operating cash flow, relative to earnings. Once we have formed quintiles, we assign observations with negative EPS forecasts to quintile 1.
2.2.2 The association between the relative magnitudes of the EPS and CPS forecasts and earnings persistence
 ()
() is the earnings per share of the current quarter and
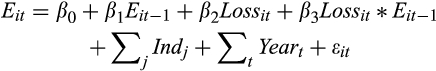
 is a dummy variable equal to 1 if the firm reports a loss in the current quarter; zero otherwise. Equation (3) captures earnings persistence in terms of the persistence of gains (
 and the incremental persistence of losses (
 . Prior research (Basu, 1997) argues that gains tend to be more persistent than losses. Accordingly, we expect that
 will be positive, and
 negative. H1 predicts that earnings persistence increases from the lowest values of rank to the middle of the distribution and then declines again. That is, H1 predicts that
 would increase from the lowest value of rank, to the middle of the distribution, and then decline again. Conversely, we expect
 to become more negative as we move from the lowest values of ratio to the middle of the distribution, and then become less negative again. In order to test H1, we compare the coefficients
 and
and
 across quintiles.
2.2.3 The association between the relative magnitudes of the EPS and CPS forecasts and the value relevance of earnings
 ()
() ()
() is the closing stock price at the end of the quarter;
 and
and
 are the unscaled realised earnings per share and cash flow per share respectively; and
 is the book value per share. In Equation (5),
 is the quarterly stock return and
 and
and
 respectively measure the realised earnings and cash flow per share, scaled by the closing stock price of the previous quarter; and
 is the book value per share, scaled by the closing stock price of the previous quarter. To test H2, we estimate Equations (4) and (5) separately for individual quintiles of rank and compare the coefficients on unscaled (scaled) EPS across quintiles. For both Equations (4) and (5), H2 predicts that
 would increase from quintile 1 of rank to quintiles 2 and 3, and then decrease.
 (and
(and
 respectively). The significance of the incremental R2can be tested using an F-test as follows:
 ()
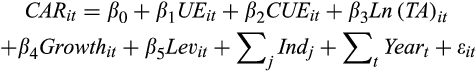
()2.2.4 The association between the relative magnitudes of the EPS and CPS forecasts and the market response to the earnings surprise
 ()
() is the three-day size-adjusted cumulative abnormal returns around the earnings announcement date, and
 is the earnings surprise, defined as the difference between the reported quarterly EPS and the consensus EPS forecast, calculated as the median of the last forecast issued by each analyst for the quarter, scaled by the closing price of the previous quarter. The other control variables included in the model are the cash flow surprise (
 , measured as the difference between the actual cash flow from operations and the median cash flow forecast calculated in a similar manner to the median earnings forecast), size (measured by the natural logarithm of total assets –
 ), growth (measured by the closing market-to-book ratio), and leverage (measured as the ratio of long-term and short-term debt to the current market value of equity). We estimate Equation (6) for each quintile of rank. H3 predicts that the market’s response to the earnings surprise will be stronger when the value of rank lies in the middle of the distribution. Thus, we expect that the coefficient
 will increase from the lowest quintile of rank to the middle quintiles, and then decrease.
3 Data and empirical tests
3.1 Description of the data
We draw the data on analysts' forecasts of EPS and CPS and actual EPS and CPS from the Quarterly Actuals and Quarterly Detail files of the Thomson Reuters’s I/B/E/S database. We obtain data for the control variables used in this paper from Standard & Poor’s Compustat Fundamentals Quarterly database. Finally, we obtain daily stock returns and trading volume from the Center for Research in Security Prices (CRSP) Daily Stock File. Our sample covers the 16-year period from 1998 to 2017. We start our analysis in 1998 because the CPS forecast data on I/B/E/S is sparse before 1998. We end our sample in 2017, as it is the latest year for which data are available on I/B/E/S for our study. The initial sample in the intersection of I/B/E/S and Compustat consisted of 60,394 firm-quarter observations. We constructed this initial sample by removing observations with missing data on both analysts' EPS forecasts and CPS forecasts, and missing data on actual EPS and CPS. We further restricted the initial sample to only those forecasts issued on or before the close of the fiscal quarter. From the initial sample, 3,509 firm-quarters were lost because they could not be matched to CRSP or had missing company identifiers. We lost a further 3,051 observations because they had missing values for other key variables. Finally, we removed outliers with respect to the key variables used in the analysis. This resulted in our final sample of 53,043 firm-quarter observations. Table 1 shows the sample selection process.
| Firm Quarters | |
|---|---|
| Initial sample in the intersection of Compustat and I/B/E/S | 60,394 |
| Less: | |
| Observations with missing company identifiers and not in CRSP | (3,509) |
| Observations with missing values for key variables | (3,051) |
| Outliers | (791) |
| Final sample | 53,043 |
- The sample is based on the intersection of quarterly cash flow per share (CPS) forecasts and quarterly earnings per share (EPS) forecasts obtained from Thomson Reuter’s I/B/E/S Detail and Actuals data, Standard and Poor’s Compustat Fundamentals Quarterly data and the daily stock returns file from the Center for Research in Security Prices (CRSP) for the period 1998–2017. We have constructed the consensus analyst forecast by taking the median of the last forecast issued by a particular analyst per firm. We have only considered forecasts issued before the fiscal quarter end. Of the 60,394 firm-quarter observations in the initial sample, 3,509 observations could not be matched with CRSP or did not have company identifiers and 3,051 observations had missing values for other key variables. Potential outliers (identified as observations lying above or below the 99th and 1st percentiles of the respective distributions) with respect to returns, cash flow forecast errors, earnings forecast errors and control variables have been deleted from the final sample.
Table 2 presents some descriptive statistics for our sample. Panel A of Table 2 shows that the mean scaled EPS surprise is smaller than the mean scaled CPS surprise. The difference is particularly noticeable in the case of the mean surprises (the mean EPS surprise is −0.001, whereas the mean CPS surprise is 0.001. Note also that the standard deviation of the CPS surprise is 0.053, higher than that of the EPS surprise, which is 0.027). This suggests that on average, EPS forecasts tend to be less volatile and optimistically biased than CPS forecasts. This is not surprising because cash flow is inherently more difficult to predict than earnings. The descriptive statistics above are consistent with DeFond and Hung (2003), who also find that CPS forecasts tend to be less accurate (and more variable) than EPS forecasts. The mean (median) three-day size-adjusted cumulative abnormal return (CAR) around the earnings announcement date is 0.1 percent (0.1 percent), similar in magnitude to those reported in prior research. The descriptive statistics for the other variables are similar to those reported in prior studies.
| Panel A: Full sample | |||||
|---|---|---|---|---|---|
| 25th Pctl | Mean | Median | 75th Pctl | SD | |
| UE | −0.001 | −0.001 | 0.000 | 0.002 | 0.027 |
| CUE | −0.008 | 0.001 | 0.000 | 0.009 | 0.053 |
| CAR | −0.038 | 0.001 | 0.001 | 0.041 | 0.077 |
| Total Assets | 1,004.922 | 19,491.280 | 2,983.656 | 9,630.598 | 109,793.800 |
| Sales | 146.656 | 2,370.528 | 518.100 | 1,773.700 | 6,907.134 |
| MTB | 1.525 | 3.832 | 2.475 | 4.167 | 4.553 |
| Lev | 0.062 | 0.469 | 0.217 | 0.500 | 0.821 |
| Panel B: Descriptive statistics for different quintiles of the ratio of cash flow and earnings forecasts | ||||||||||
|---|---|---|---|---|---|---|---|---|---|---|
| Rank 1 | Rank 2 | Rank 3 | Rank 4 | Rank 5 | ||||||
| Mean | SD | Mean | SD | Mean | SD | Mean | SD | Mean | SD | |
| Ratio | −1.484 | 4.474 | 1.144 | 0.166 | 1.493 | 0.203 | 2.076 | 0.400 | 5.951 | 4.918 |
| UE | −0.004 | 0.043 | 0.000 | 0.012 | 0.000 | 0.013 | −0.001 | 0.020 | −0.002 | 0.030 |
| CUE | 0.006 | 0.074 | 0.002 | 0.036 | 0.001 | 0.033 | 0.001 | 0.041 | −0.007 | 0.065 |
| CAR | −0.001 | 0.092 | 0.000 | 0.068 | 0.002 | 0.067 | 0.002 | 0.071 | 0.000 | 0.082 |
| Total assets | 10,269.010 | 80,670.010 | 23,902.990 | 109,532.300 | 32,752.400 | 159,241.900 | 18,926.350 | 98,152.110 | 12,465.420 | 81,171.130 |
| Sales | 1,060.254 | 3,434.384 | 2,994.509 | 7,201.670 | 3,731.409 | 9,289.459 | 2,720.338 | 8,001.751 | 1,470.877 | 4,633.926 |
| MTB | 4.032 | 5.203 | 4.789 | 5.057 | 3.995 | 4.294 | 3.382 | 3.747 | 3.040 | 4.112 |
| Lev | 0.649 | 1.157 | 0.258 | 0.453 | 0.316 | 0.532 | 0.419 | 0.638 | 0.674 | 0.951 |
| Panel C: Distribution of CPS and EPS forecasts by year | ||||||
|---|---|---|---|---|---|---|
| Year | Analysts issuing earnings forecasts | Number of earnings forecasts | Analysts issuing cash flow forecasts | Number of cash flow forecasts | Analyst issuing both earnings and cash flow forecast | Number of earnings forecasts when analysts issue both earnings and cash flow forecasts |
| 1998 | 4 | 5 | 2 | 3 | 9 | 13 |
| 1999 | 4 | 5 | 3 | 4 | 9 | 13 |
| 2000 | 5 | 6 | 3 | 4 | 9 | 12 |
| 2001 | 5 | 7 | 4 | 6 | 9 | 14 |
| 2002 | 5 | 7 | 3 | 4 | 10 | 14 |
| 2003 | 6 | 7 | 2 | 3 | 11 | 14 |
| 2004 | 6 | 7 | 2 | 3 | 11 | 15 |
| 2005 | 6 | 7 | 2 | 3 | 11 | 14 |
| 2006 | 6 | 8 | 2 | 3 | 11 | 14 |
| 2007 | 6 | 7 | 2 | 3 | 10 | 13 |
| 2008 | 7 | 8 | 2 | 3 | 11 | 14 |
| 2009 | 7 | 8 | 2 | 3 | 11 | 14 |
| 2010 | 7 | 9 | 2 | 3 | 12 | 14 |
| 2011 | 8 | 9 | 3 | 3 | 12 | 15 |
| 2012 | 8 | 9 | 3 | 3 | 12 | 15 |
| 2013 | 8 | 9 | 3 | 3 | 13 | 15 |
| 2014 | 8 | 9 | 3 | 4 | 12 | 14 |
| 2015 | 8 | 9 | 3 | 4 | 12 | 15 |
| 2016 | 8 | 9 | 3 | 3 | 12 | 14 |
| 2017 | 8 | 9 | 3 | 4 | 12 | 14 |
| Panel D: Proportion of firms with EPS and CPS forecasts by year | ||
|---|---|---|
| Year | % of Firms with EPS forecasts | % of Firms with CPS forecasts |
| 1998 | 48 | 0 |
| 1999 | 46 | 2 |
| 2000 | 43 | 2 |
| 2001 | 37 | 2 |
| 2002 | 35 | 2 |
| 2003 | 34 | 6 |
| 2004 | 37 | 8 |
| 2005 | 38 | 10 |
| 2006 | 37 | 11 |
| 2007 | 38 | 12 |
| 2008 | 35 | 12 |
| 2009 | 34 | 12 |
| 2010 | 34 | 15 |
| 2011 | 33 | 15 |
| 2012 | 32 | 14 |
| 2013 | 33 | 14 |
| 2014 | 34 | 17 |
| 2015 | 34 | 17 |
| 2016 | 32 | 16 |
| 2017 | 30 | 15 |
- The sample in Panels A and B is based on the intersection of quarterly cash flow per share (CPS) forecasts and quarterly earnings per share (EPS) forecasts obtained from Thomson Reuter’s I/B/E/S Detail and Actuals data, Standard and Poor’s Compustat Fundamentals Quarterly data and the daily stock returns file from the Center for Research in Security Prices (CRSP) for the period 1998–2017. The variables are defined as follows: UE is the difference between the actual EPS realised during the quarter (obtained from I/B/E/S) and the last consensus EPS forecast (as defined in Table 1) issued by analysts (in $US) for that quarter, scaled by the closing stock price of the previous quarter; CUE is the difference between the actual CPS realised during the quarter (obtained from I/B/E/S) and the last consensus CPS forecast issued by analysts (in $US) for that quarter, scaled by the closing stock price of the previous quarter; CAR is the 3-day size-adjusted cumulative abnormal returns surrounding the quarterly earnings announcement dates; Total Assets is total assets (in $US million) for the quarter; Sales is net sales (in $US million) for the quarter; Growth is the market-to-book ratio, calculated by dividing the closing market value of equity by the book value of equity; Lev is leverage, defined as the ratio of short-term and long-term debt to the market value of equity; and Ratio is defined as the ratio of the last consensus cash flow and earnings forecast for the quarter.
- Panel C presents the mean number of analysts (and forecasts) for each firm for each year in our sample. The first two columns provide descriptive statistics for the full sample of earnings forecasts, the next two for the full sample of cash flow forecasts. The final two columns provide descriptive statistics for the number of analyst (earnings forecasts) when analysts provide both cash flow and earnings forecasts. The sample period is 1998–2017. Panel D presents the proportion of firms with earnings and cash flow forecasts in each year of our sample. The sample period is 1998–2017.
Panel B of Table 2 presents descriptive statistics of observations in the five quintiles of the ratio of CPS and EPS forecasts. We first note that the ratio of the CPS and EPS forecasts increases monotonically from the lowest quintile of ratio to the highest – the mean ratio increases from −1.484 in quintile 1 to 5.951 in quintile 5. This is by construction. We also see that the standard deviation of the ratio decreases from 4.474 in quintile 1 to 0.166 in quintile 2, before increasing again to 4.918 in quintile 5. This shows that there seems to be significant disagreement among analysts on the expected future cash flows and earnings at the extreme ends of the distribution of the ratio. In contrast, the standard deviation of ratio is relatively low in quintiles 2 and 3 (0.166 and 0.203 respectively), suggesting that analysts seem to have a better consensus opinion of future cash flows and earnings in the middle quintiles.
We also note that firms in quintiles 1 and 5 tend to be the smaller firms – the mean total assets for these firms are respectively $10,269.010 million and $12,465.420 million. In contrast, firms in the middle quintiles (in particular, quintiles 2 and 3) have higher total assets. We see a similar distribution of sales. We present these distributions in Figure 1.

The market-to-book ratio (MTB) is lower in the extreme quintiles – the mean MTB for quintiles 1 and 5 are respectively 4.032 and 3.040. In contrast, we note that firms in quintiles 1 and 5 tend to have higher leverage – the mean and median leverage is, respectively, 0.649 and 0.674. We present these distributions in Figure 2. These statistics show that firms in the middle quintiles appear to have higher valuations and are less risky.

We present descriptive statistics of the number of analysts providing EPS and CPS forecasts for the average firm per year in Panel C of Table 2. Prior research (for example, DeFond and Hung, 2003) shows that there are fewer CPS forecasts than EPS forecasts. This pattern is also borne out in our sample. In the first two columns of Panel C, we present the mean number of analysts providing EPS forecasts per firm per year and the mean number of forecasts for a firm per year. Columns 3 and 4 present similar descriptive statistics for analysts providing CPS forecasts. From these statistics, we see that the mean number of analysts covering the average firm has increased from 1998 to 2017. However, while the number of analysts providing EPS forecasts (and the number of EPS forecasts) has increased from 4 to 8 (5 to 9), the number of analysts providing CPS forecasts (and the number of CPS forecasts) has increased from 2 to 3 (3 to 4). This suggests that more analysts tend to provide EPS forecasts than CPS forecasts. We note from columns 5 and 6, however, that when analysts provide CPS forecasts, the mean number of analysts also reporting EPS forecasts (and the number of EPS forecast) is significantly higher.
Finally, in Panel D of Table 2, we present descriptive statistics of the proportion of firms with EPS and CPS forecasts. The table shows that the proportion of firms with EPS forecasts has declined from 48 percent in 1998 to 30 percent in 2017. We note from the table that, while the number of firms with CPS forecasts is strictly lower than that with EPS forecasts in every year, the number of firms with CPS forecasts has increased steadily over this period (from 0 percent in 1998 to 15 percent in 2017). This increasing trend is also documented in prior research (for example, Bilinski, 2014).
3.2 Empirical tests
3.2.1 The relative magnitudes of cash flow and earnings forecasts and earnings persistence
We present results for H1 in Table 3. H1 predicts that earnings persistence increases from the lowest values of ratio to the middle of the distribution, and then decreases. We estimate Equation (3) separately for each quintile of ratio to test H1. We present these results in the five columns of Table 3, starting with the lowest quintile (Rank 1). We see from the table, that the coefficient on
 is positive for all quintiles of rank, consistent with the idea that gains tend to be persistent (coefficient = 0.390, 0.729, 0.719, 0.687 and 0.647, respectively; p-value = 0.000 for all columns). A comparison across quintiles shows that the coefficient increases significantly from quintile 1 to quintile 2 (p-value = 0.000). The coefficient on
 is not significantly different between quintiles 2 and 3 (p-value = 0.732), quintiles 3 and 4 (p-value = 0.279) and quintiles 4 and 5 (p-value = 0.631). However, the coefficient in quintile 5 is smaller than that in quintile 2 (p-value = 0.000). These results suggest that the persistence of gains increases as the ratio of CPS to EPS forecasts increases. In other words, as the proportion of forecasted cash flow increases, relative to forecasted earnings, the persistence of gains of next quarter’s reported earnings also increases. This suggests that analysts correctly estimate the persistence of earnings. Our results are thus consistent with H1, and show that gains are more persistent when there is a more optimal match between current earnings and cash flow, as indicated by analyst forecasts.
|
|||||
| Rank 1 | Rank 2 | Rank 3 | Rank 4 | Rank 5 | |
|---|---|---|---|---|---|
| Eit −1 | 0.390*** | 0.729*** | 0.719*** | 0.687*** | 0.647*** |
| (0.000) | (0.000) | (0.000) | (0.000) | (0.000) | |
| Loss | −0.007*** | 0.003 | 0.005 | 0.002 | 0.000 |
| (0.000) | (0.258) | (0.140) | (0.431) | (0.947) | |
| Loss*Eit −1 | 0.347*** | −0.108 | −0.334* | −0.337* | −0.301** |
| (0.000) | (0.430) | (0.085) | (0.053) | (0.005) | |
| Constant | 0.001 | −0.007*** | −0.049*** | −0.024*** | 0.035*** |
| (0.932) | (0.000) | (0.000) | (0.000) | (0.000) | |
| Industry fixed effects | Included | Included | Included | Included | Included |
| Year fixed effects | Included | Included | Included | Included | Included |
| Observations | 11,677 | 9,848 | 10,622 | 10,616 | 10,280 |
| Adjusted R2 | 0.523 | 0.463 | 0.483 | 0.365 | 0.229 |
| p-values for differences in the coefficient on Eit−1 | 0.000*** | 0.732 | 0.279 | 0.631 | |
| p-values for differences in the coefficient on Loss*Eit−1 | 0.004*** | 0.338 | 0.843 | 0.846 | |
- This table is based on the sample of analysts’ forecasts defined in Table 1. The sample period covered is 1998–2017. Eit−1 is the earnings per share of the last quarter, scaled by the beginning of period stock price. Loss is a dummy variable equal to 1 if the company reported a loss in the current quarter; zero otherwise. The numbers in parentheses are p-values based on standard errors clustered at the firm and year-levels. ***, ** and * represent statistical significance at the 1, 5 and 10 percent levels, respectively.
We next turn to the persistence of losses. We see from Table 3 that the coefficient on
 is generally negative (with the exception of quintile 1, where it is significantly positive (coefficient = 0.347, p-value = 0.000), consistent with prior research that shows that losses tend to be less persistent than gains. It is significantly negative for quintiles 3, 4 and 5 (coefficient = −0.334, −0.337 and −0.301, respectively; p-value = 0.085, 0.053 and 0.005, respectively), suggesting that losses are incrementally less persistent. We also note that the difference in loss persistence is significant between quintiles 1 and 2 (p-value = 0.004). These results show that loss persistence becomes less when we move from the lowest quintile of rank to the middle quintiles. Taken together, these results support H1.
3.2.2 The relative magnitudes of cash flow and earnings forecasts and the value relevance of earnings
Table 4 presents the results for H2, which tests whether EPS and CPS forecasts jointly provide information about the value relevance of earnings. Panel A of Table 4 presents results from the price model (Eqn (4)) and Panel B presents results from the returns model (Eqn (5)). As in Table 3, we estimate Equations (4) and (5) separately for each quintile of rank. From Panel A, we see that the coefficient on EPS is positive and significant for all quintiles (coefficient = 13.250, 27.140, 31.410, 23.480 and 11.910, respectively, p-values = 0.000 for all quintiles). This result is consistent with extant research that documents a positive association between contemporaneous price and earnings. We further find that the coefficient on price is significantly greater for quintile 2 than quintile 1 (p-value = 0.000), and that the coefficient in quintile 2 is significantly greater than that in quintile 3 (p-value = 0.089). We note that the difference in the coefficients on price in quintiles 3 and 4 is not significant. However, the coefficient on price in quintile 5 is significantly smaller than that in quintile 4 (p-value = 0.000), consistent with our expectations. In other words, our results suggest that the market responds more positively to the earnings surprise for the middle quintiles of the ratio of CPS to EPS forecasts. Since these quintiles represent a more balanced mix of cash flows and accruals in expected earnings, the result is consistent with the market recognising this, and pricing the earnings appropriately. We also note that the coefficient on cash flow is generally not significant – in fact, it is negative for quintiles 3 and 4 (coefficient = −0.951 and −1.441, respectively; p-value = 0.071 and 0.013). This brings into question the incremental value relevance of cash flow from operations. This result is consistent with the view of standard-setters that cash flow from operations is not an independent performance metric. We also note that the coefficient on BVPS is positive (coefficient = 1.069, 0.673, 0.402, 0.845 and 0.785, respectively; p-value = 0.000 for all quintiles), consistent with prior research.
| Panel A: Price model | |||||
|---|---|---|---|---|---|

|
|||||
| Rank 1 | Rank 2 | Rank 3 | Rank 4 | Rank 5 | |
| EPS | 13.250*** | 27.140*** | 31.410*** | 23.480*** | 11.910*** |
| (0.000) | (0.000) | (0.000) | (0.000) | (0.000) | |
| CPS | −0.327 | −0.160 | −0.951* | −1.441** | 0.566 |
| (0.482) | (0.802) | (0.071) | (0.013) | (0.205) | |
| BVPS | 1.069*** | 0.673*** | 0.402** | 0.845*** | 0.785*** |
| (0.000) | (0.000) | (0.006) | (0.000) | (0.000) | |
| Constant | 14.440*** | 18.590*** | 18.990*** | 14.250*** | 13.660*** |
| (0.000) | (0.000) | (0.000) | (0.000) | (0.000) | |
| Observations | 9,348 | 7,772 | 8,883 | 8,946 | 8,692 |
| Adjusted R2 | 0.358 | 0.422 | 0.437 | 0.433 | 0.362 |
| p-values for differences in the coefficient on EPS | 0.000*** | 0.089 | 0.109 | 0.000*** | |
| Adjusted R2 of restricted model (Only BVPS) | 0.277 | 0.248 | 0.204 | 0.297 | 0.310 |
| Change in R2 | 0.081 | 0.174 | 0.233 | 0.136 | 0.052 |
| (0.000) | (0.000) | (0.000) | (0.000) | (0.000) | |
| Panel B: Returns model | |||||
|---|---|---|---|---|---|

|
|||||
| Rank 1 | Rank 2 | Rank 3 | Rank 4 | Rank 5 | |
| EPS/P | 0.594*** | 0.787** | 1.027*** | 0.778*** | 0.779*** |
| (0.000) | (0.003) | (0.000) | (0.000) | (0.000) | |
| CPS/P | 0.000 | 0.074* | −0.019*** | −0.014 | 0.053 |
| (0.574) | (0.084) | (0.000) | (0.811) | (0.405) | |
| BVPS/P | 0.0265 | 0.032 | 0.032 | 0.037* | 0.035** |
| (0.171) | (0.219) | (0.109) | (0.092) | (0.027) | |
| Constant | 0.028** | 0.034** | 0.030** | 0.026* | 0.017 |
| (0.028) | (0.007) | (0.002) | (0.067) | (0.196) | |
| Observations | 9,045 | 7,973 | 8,956 | 8,921 | 8,494 |
| Adjusted R2 | 0.010 | 0.009 | 0.013 | 0.010 | 0.012 |
| p-values for differences in the coefficient on EPS/P | 0.278 | 0.384 | 0.165 | 0.663 | |
| Adjusted R2 of restricted model (Only BVPS) | 0.001 | 0.003 | 0.005 | 0.006 | 0.002 |
| Change in R2 | 0.009 | 0.006 | 0.008 | 0.004 | 0.010 |
| (0.000) | (0.000) | (0.000) | (0.000) | (0.000) | |
- This table is based on the sample of analysts’ forecasts defined in Table 1. The sample period covered is 1998–2017. In Panel A (Panel B) EPS (EPS/P) and CPS (CPS/P) is the unscaled earnings (cash flow) per share (scaled earnings (cash flow) of the last quarter, scaled by the beginning of period stock price). In Panel A (Panel B), P(R) is the closing stock price (stock return) for the quarter. The numbers in parentheses are standard errors clustered at the firm and year-levels. ***, ** and * represent statistical significance at the 1, 5 and 10 percent levels, respectively.
We also see from the table that all the incremental R2 are significant, suggesting that the inclusion of EPS and CPS significantly increases the explanatory power of Equation (4). A comparison of the incremental R2 reveals that it is significantly greater for quintile 3 (p-value = 0.000) than for quintiles 1 and 5. This further strengthens our main result above.
From Panel B, we note that the coefficient on EPS/P is positive and significant for all quintiles (coefficient = 0.594, 0.787, 1.027, 0.778 and 0.779, respectively, p-values = 0.000, 0.003, 0.000, 0.000 and 0.000, respectively). This result is, again, consistent with prior research. Although the coefficient on EPS/P is not significantly greater for quintile 2 than quintile 1 (p-value = 0.278) and quintile 3 than quintile 2 (p-value = 0.384), the coefficient on EPS/P is significantly greater for quintile 3 than quintile 1 (p-value = 0.000). These results therefore show that EPS and CPS forecasts jointly provide information about the value relevance of earnings, consistent with the prediction of H2. We find that the coefficient on CPS/P is positive only for quintile 2 (coefficient = 0.074; p-value = 0.084), suggesting again that cash flow per share is not value relevant independently. The results in Table 4 show that earnings are most value relevant in the middle quintiles of the ratio of CPS and EPS forecasts, consistent with our expectations.
The table shows that all the incremental R2 are significant, suggesting that the inclusion of the scaled EPS and CPS significantly increases the explanatory power of Equation (5). However, the incremental R2 is not significantly greater for quintile 3 than that for quintiles 1 and 5. While this result is not consistent with our expectation, collectively, our results are consistent with the prediction of H2.
3.2.3 The relative magnitudes of cash flow and earnings forecasts and abnormal return in response to the earnings surprise
We present tests of H3 in Table 5. H3 predicts that the earnings response coefficient (ERC) will increase from the lowest values of rank to the middle of the distribution, and then decline again. We test H3 by estimating Equation (6) separately for each quintile of ratio, and comparing the ERC across quintiles. These results are presented in columns 1–5 of Table 5, starting with quintile 1 in column 1. The coefficient on
 (the ERC) is positive (coefficient = 1.395, 2.240, 2.179, 1.861 and 1.734, respectively; p-value = 0.000 for all columns), consistent with prior research. Further, the ERC increases from quintile 1 to quintile 3 and then decreases to quintile 5 – the p-value for the difference in ERC from quintile 1 to quintile 2 is 0.000. We further find that the coefficient on UE in quintile 5 is smaller than that in quintile 2 (p-value = 0.000). This suggests that the market response to the earnings surprise increases from the lowest quintile of the ratio of CPS forecast to EPS forecast to the middle quintiles, before declining again. This result is consistent with H3 and suggests that the market’s response to the earnings surprise is affected by the proportion of cash flow in the current earnings implied by analysts. Specifically, the market views low and high relative magnitudes of cash flow as indicating poor correspondence between current earnings and cash flow, and thus reacts less strongly to the earnings surprise.
|
|||||
| Rank 1 | Rank 2 | Rank 3 | Rank 4 | Rank 5 | |
|---|---|---|---|---|---|
| UE | 1.395*** | 2.240*** | 2.179*** | 1.861*** | 1.734*** |
| (0.000) | (0.000) | (0.000) | (0.000) | (0.000) | |
| CUE | 0.071*** | 0.113*** | 0.152** | 0.167*** | 0.114*** |
| (0.000) | (0.000) | (0.002) | (0.000) | (0.000) | |
| Ln(TA) | −0.000 | −0.000 | −0.000 | −0.000 | −0.000 |
| (0.995) | (0.377) | (0.685) | (0.242) | (0.450) | |
| Growth | −0.000 | −0.000 | −0.000** | −0.000** | −0.000 |
| (0.959) | (0.152) | (0.020) | (0.046) | (0.442) | |
| Lev | 0.005** | −0.001 | 0.003 | 0.003** | 0.003* |
| (0.002) | (0.391) | (0.131) | (0.012) | (0.059) | |
| Constant | −0.042*** | −0.001 | −0.069*** | 0.036** | 0.041*** |
| (0.000) | (0.886) | (0.000) | (0.006) | (0.000) | |
| Industry fixed effects | Included | Included | Included | Included | Included |
| Year fixed effects | Included | Included | Included | Included | Included |
| Observations | 9,101 | 7,801 | 8,674 | 8,661 | 8,388 |
| Adjusted R2 | 0.047 | 0.040 | 0.043 | 0.053 | 0.059 |
| p-values for differences in the coefficient on UE | 0.000*** | 0.780 | 0.284 | 0.661 | |
| p-values for differences in the coefficient on CUE | 0.009*** | 0.345 | 0.875 | 0.121 | |
- This table is based on the sample of analysts’ forecasts defined in Table 1. The sample period covered is 1998–2017. UE is the difference between the actual EPS and the last consensus analyst forecast of EPS for the quarter, scaled by the closing share price. CUE is the difference between the actual cash flow per share and the last consensus analyst forecast of CPS for the quarter, scaled by the closing share price. The other variables are defined in Table 2. The numbers in parentheses are standard errors clustered at the firm and year-levels. ***, ** and * represent statistical significance at the 1, 5 and 10 percent levels, respectively.
We also note that the coefficient on the cash flow surprise (
 ) is positive (coefficient = 0.072, 0.113, 0.152, 0.167 and 0.114, respectively; p-value = 0.000, 0.000, 0.002, 0.000 and 0.000, respectively). This suggests that, controlling for the earnings surprise, there is also a market response to the cash flow surprise. This result contrasts with Givoly et al.(2009), and suggests that the market also responds to the CPS surprise. In fact, the pattern of the coefficients is similar to that of the earnings response coefficient described above.
The next section describes some important additional tests.
3.3 Additional analyses
We perform some additional analyses to gain further insight into the joint information role of EPS and CPS forecasts. We describe these below.
3.3.1 Analysing whether the EPS and CPS forecast can individually provide accurate information about earnings persistence and value relevance
 ()
()Unlike in Equation (3) where we estimate the persistence of gains and losses separately, in Equation (7), we do not allow for differential persistence of gains and losses. This is because, by construction, all the losses are concentrated in quintile 1 for the earnings quintile analysis. Panel A of Table 6 shows the results for the earnings quintiles. We first note that the coefficients on
 are positive and significant (coefficient = 0.426, 0.431, 0.417, 0.525 and 0.709, respectively; p-value = 0.000 for all). This shows that there is a positive association between prior period earnings and current earnings, consistent with prior studies. The results in Panel A show that the coefficient on
 generally remains stable for the first three quintiles of the EPS forecast, before increasing steadily to quintile 5. This result is not consistent with Table 3.

|
|||||
| Panel A: Earnings persistence across quintiles of analyst EPS forecasts | |||||
|---|---|---|---|---|---|
| Rank 1 | Rank 2 | Rank 3 | Rank 4 | Rank 5 | |
| Eit −1 | 0.426*** | 0.431*** | 0.417*** | 0.525*** | 0.709*** |
| (0.000) | (0.000) | (0.001) | (0.000) | (0.000) | |
| Constant | 0.029** | 0.020*** | −0.100*** | 0.011** | −0.004* |
| (0.009) | (0.000) | (0.000) | (0.002) | (0.053) | |
| Industry fixed effects | Included | Included | Included | Included | Included |
| Year fixed effects | Included | Included | Included | Included | Included |
| Observations | 8,186 | 8,321 | 8,542 | 8,805 | 8,862 |
| Adjusted R2 | 0.521 | 0.107 | 0.138 | 0.184 | 0.415 |
| Panel B: Earnings persistence across quintiles of analyst CPS forecasts | |||||
|---|---|---|---|---|---|
| Rank 1 | Rank 2 | Rank 3 | Rank 4 | Rank 5 | |
| Eit −1 | 0.264** | 0.418*** | 0.404*** | 0.464*** | 0.725*** |
| (0.004) | (0.000) | (0.000) | (0.000) | (0.000) | |
| Constant | 0.005 | 0.024*** | −0.024*** | −0.013*** | 0.028*** |
| (0.521) | (0.000) | (0.000) | (0.000) | (0.000) | |
| Industry fixed effects | Included | Included | Included | Included | Included |
| Year fixed effects | Included | Included | Included | Included | Included |
| Observations | 10,521 | 10,840 | 10,853 | 10,911 | 10,843 |
| Adjusted R2 | 0.607 | 0.284 | 0.279 | 0.320 | 0.384 |
- This table is based on the sample of analysts’ forecasts defined in Table 1. The sample period covered is 1998–2017. Eit−1 is the earnings per share of the last quarter, scaled by the beginning of period stock price. Loss is a dummy variable equal to 1 if the company reported a loss in the current quarter; zero otherwise. The other variables are defined in Table 2. The numbers in parentheses are standard errors clustered at the firm and year-levels. ***, ** and * represent statistical significance at the 1, 5 and 10 percent levels, respectively.
From Panel B of Table 6, we first note that the coefficients on
 are positive and significant (coefficient = 0.264, 0.418, 0.404, 0.464 and 0.725, respectively; p-value = 0.000 for all quintiles), consistent with expectations. However, we note that the coefficients do not vary monotonically across quintiles. Indeed, they tend to increase and then decrease in successive quintiles of the CPS forecast. Thus, based on the magnitude CPS forecast alone, we cannot make any inferences about earnings persistence.
Panel A of Table 7 shows the results from the estimation of Equation (4) across the earnings quintiles. Consistent with Table 4, we find that the coefficient on EPS is positive and significant in earnings quintiles 2–5 (coefficient = 10.310, 16.750, 28.000 and 21.980, respectively; p-value = 0.000 for all quintiles). Untabulated results also show that the coefficient on EPS increases from the lowest earnings quintile to quintile 4 and decreases thereafter. These results are similar to those in Panel A of Table 4, suggesting that analysts’ EPS forecasts can reasonably provide information about the value relevance of earnings in a price model. As in Table 4, we do not find any evidence that cash flow per share is value relevant – the coefficient on CPS is actually negative in quintiles 3–5 (coefficient = −1.059, −1.536 and −2.535, respectively; p-value = 0.004, 0.000 and 0.000, respectively). We also find that the coefficient on BVPS is positive and significant in all quintiles (coefficient = 0.984, 1.020, 0.885, 0.597 and 0.449, respectively; p-value = 0.000 in all quintiles), consistent with our results above.

|
|||||
| Panel A: Value relevance of earnings across quintiles of analyst EPS forecasts (price model) | |||||
|---|---|---|---|---|---|
| Rank 1 | Rank 2 | Rank 3 | Rank 4 | Rank 5 | |
| EPS | −0.652 | 10.310*** | 16.750*** | 28.000*** | 21.980*** |
| (0.735) | (0.000) | (0.000) | (0.000) | (0.000) | |
| CPS | −0.666 | −0.164 | −1.059** | −1.536*** | −2.535*** |
| (0.252) | (0.753) | (0.004) | (0.000) | (0.000) | |
| BVPS | 0.984*** | 1.020*** | 0.885*** | 0.597*** | 0.449*** |
| (0.000) | (0.000) | (0.000) | (0.000) | (0.000) | |
| Constant | 10.150*** | 12.090*** | 16.590*** | 19.770*** | 34.300*** |
| (0.000) | (0.000) | (0.000) | (0.000) | (0.000) | |
| Observations | 9,162 | 9,018 | 9,132 | 9,104 | 8,218 |
| Adjusted R2 | 0.180 | 0.181 | 0.149 | 0.163 | 0.214 |
| Panel B: Value relevance of earnings across quintiles of analyst CPS forecasts (price model) | |||||
|---|---|---|---|---|---|
| Rank 1 | Rank 2 | Rank 3 | Rank 4 | Rank 5 | |
| EPS | 7.830*** | 19.170*** | 25.250*** | 29.300*** | 21.860*** |
| (0.000) | (0.000) | (0.000) | (0.000) | (0.000) | |
| CPS | −0.756 | 0.333 | −0.386 | −0.439 | −2.312*** |
| (0.283) | (0.610) | (0.431) | (0.252) | (0.000) | |
| BVPS | 1.351*** | 1.137*** | 0.708*** | 0.625*** | 0.540*** |
| (0.000) | (0.000) | (0.000) | (0.000) | (0.001) | |
| Constant | 11.240*** | 10.860*** | 15.650*** | 17.340*** | 29.220*** |
| (0.000) | (0.000) | (0.000) | (0.000) | (0.000) | |
| Observations | 9,057 | 9,157 | 9,147 | 9,099 | 8,174 |
| Adjusted R2 | 0.273 | 0.233 | 0.244 | 0.311 | 0.320 |
- This table is based on the sample of analysts’ forecasts defined in Table 1. The sample period covered is 1998–2017. The variables are as defined in Table 4. The numbers in parentheses are standard errors clustered at the firm and year-levels. ***, ** and * represent statistical significance at the 1, 5 and 10 percent levels, respectively.
Panel B of Table 7 presents results from the estimation of Equation (4) across the cash flow quintiles. Consistent with Panel A, we find that the coefficient on EPS is positive and significant across the cash flow quintiles (coefficient = 7.830, 19.170, 25.250, 29.300 and 21.860, respectively; p-value = 0.000 for all quintiles). The coefficient on EPS increases monotonically up to quintile 4, before declining in quintile 5. These results are not consistent with Table 4, suggesting that CPS forecasts do not provide enough information about the value relevance of earnings independently. Untabulated results reveal a similar pattern for the return model.
3.3.2 Controlling for the level of absolute accruals
In our next set of additional analyses, we replicate the results for H1 and H2 above by explicitly controlling for the level of accruals contained in reported earnings. This is an important additional test. An alternate explanation for our results above that middle quintiles of the ratio of analysts’ CPS to EPS forecasts are associated with more persistent and value-relevant reported earnings is that the ratio really proxies for the level of reported accruals only. Thus, the results only suggest that lower absolute accruals are associated with higher earnings quality, results that have been established in prior research (Sloan, 1996; Chan et al., 2006).
While it is true that relatively lower absolute accruals are associated with higher earnings quality, we argue that forming portfolios based on the ratio of the CPS and EPS forecasts is not identical to a sorting on accruals for a number of reasons. First, we form quintiles based on expected cash flow and earnings. While expected cash flow and earnings jointly provide information about expected accruals, the actual accruals at the end of the period could differ from expectation. Second, accruals are prone to manipulation. Consistent with this notion, Bhattacharya et al.(2013) argue that managers might use their discretion to manipulate accruals to improve their mapping with cash flow. For these reasons, it is not necessarily true that forming quintiles based on expected cash flow and earnings is equivalent to a similar sorting based on actual accruals.
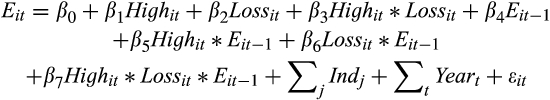
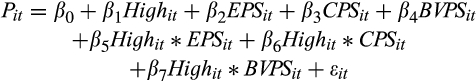
 ()
() ()
() is a dummy variable equal to one, if the level of absolute accruals is greater than the median for the sample; zero otherwise. We define
 for each quintile of ratio. If the ratio of the CPS and EPS forecasts has incremental information over reported accruals, we expect to find similar patterns in the behaviour of gains and loss persistence (Eqn (8)) and the value relevance of reported earnings (Eqns (9) and(10)) for both high and low accruals samples. These results are presented in Table 8.
| Panel A: Earnings persistence | |||||
|---|---|---|---|---|---|
|
|||||
| Rank 1 | Rank 2 | Rank 3 | Rank 4 | Rank 5 | |
| High | 0.006*** | 0.004 | 0.005** | 0.003** | 0.003** |
| (0.000) | (0.111) | (0.027) | (0.004) | (0.037) | |
| Loss | −0.001 | 0.005 | 0.015*** | 0.006** | 0.005* |
| (0.600) | (0.161) | (0.000) | (0.045) | (0.070) | |
| High*Loss | −0.007** | 0.000 | −0.017*** | −0.002 | −0.010** |
| (0.026) | (0.956) | (0.000) | (0.552) | (0.001) | |
| Eit −1 | 0.678*** | 0.789*** | 0.777*** | 0.731*** | 0.684*** |
| (0.000) | (0.000) | (0.000) | (0.000) | (0.000) | |
| High*Eit−1 | −0.349** | −0.226 | −0.334** | −0.192** | −0.346** |
| (0.040) | (0.164) | (0.027) | (0.007) | (0.002) | |
| Loss*Eit−1 | 0.052 | −0.205 | −0.677** | −0.501** | −0.329** |
| (0.522) | (0.250) | (0.002) | (0.001) | (0.010) | |
| High*Loss*Eit−1 | 0.376** | 0.081 | 0.717*** | 0.066 | 0.164 |
| (0.035) | (0.868) | (0.000) | (0.838) | (0.531) | |
| Constant | 0.023** | −0.004*** | 0.011*** | −0.101*** | 0.024*** |
| (0.014) | (0.000) | (0.000) | (0.000) | (0.000) | |
| Industry fixed effects | Included | Included | Included | Included | Included |
| Year fixed effects | Included | Included | Included | Included | Included |
| Observations | 9,125 | 7,807 | 8,808 | 8,845 | 8,575 |
| Adjusted R2 | 0.542 | 0.452 | 0.478 | 0.377 | 0.228 |
| p-values for differences in the coefficient on Eit−1 | (0.000) | (0.728) | (0.809) | (0.694) | |
| p-values for differences in the coefficient on Loss*Eit−1 | (0.005) | (0.283) | (0.916) | (0.851) | |
| p-values for differences in the sum of coefficient on Eit−1 and High*Eit−1 | (0.000) | (0.000) | (0.000) | (0.000) | |
| p-values for differences in the sum of coefficient on Loss*Eit−1 and High*Loss*Eit−1 | (0.188) | (0.000) | (0.000) | (0.000) | |
| Panel B: Value relevance (price model) | |||||
|---|---|---|---|---|---|
|
|||||
| Rank 1 | Rank 2 | Rank 3 | Rank 4 | Rank 5 | |
| High | −11.580*** | −8.772*** | −4.203*** | −6.595*** | −4.523 |
| (0.000) | (0.000) | (0.000) | (0.000) | (0.128) | |
| EPS | 10.850** | 25.600*** | 26.590*** | 13.510** | 4.429 |
| (0.001) | (0.000) | (0.000) | (0.036) | (0.251) | |
| CPS | 2.045 | 7.705* | 14.060*** | 18.010*** | 16.930*** |
| (0.533) | (0.070) | (0.000) | (0.000) | (0.000) | |
| BVPS | 1.251*** | 0.689*** | 0.282 | 0.626*** | 0.697*** |
| (0.000) | (0.000) | (0.110) | (0.000) | (0.000) | |
| High*EPS | −2.531 | −2.500 | −6.001** | 0.772 | 1.385 |
| (0.439) | (0.648) | (0.019) | (0.846) | (0.729) | |
| High*CPS | −1.473 | −7.076* | −12.410*** | −16.890*** | −14.320*** |
| (0.667) | (0.094) | (0.000) | (0.000) | (0.000) | |
| High*BVPS | −0.300** | −0.015 | 0.199* | 0.218** | −0.124 |
| (0.032) | (0.917) | (0.073) | (0.004) | (0.566) | |
| Constant | 19.860*** | 21.850*** | 19.180*** | 15.510*** | 13.510*** |
| (0.000) | (0.000) | (0.000) | (0.000) | (0.000) | |
| Observations | 9,135 | 7,784 | 8,815 | 8,857 | 8,597 |
| Adjusted R2 | 0.446 | 0.491 | 0.515 | 0.543 | 0.509 |
| p-values for differences in the coefficient on EPS | (0.027) | (0.879) | (0.003) | (0.108) | |
| p-values for differences in the sum of coefficient on EPS and High*EPS | (0.000) | (0.000) | (0.000) | (0.000) | |
- This table is based on the sample of analysts’ forecasts defined in Table 1. The sample period covered is 1998–2017. The variables are as defined in Table 4. High is defined as a dummy variable equal to 1 if the total absolute accruals (defined as the difference between reported earnings and cash flow per share) is greater than the median for the sample; zero otherwise. We define High separately for each value of Rank. The numbers in parentheses are standard errors clustered at the firm and year-levels. ***, ** and * represent statistical significance at the 1, 5 and 10 percent levels, respectively.
Panel A of Table 8 presents results for earnings persistence. We note that
 , the estimated coefficient on
 , which measures the gain persistence of low accrual firms, increases from 0.678 (p-value = 0.000) in quintile 1, to 0.789 (p-value = 0.000) in quintile 2.
 is positive in quintile 3 (coefficient = 0.777; p-value = 0.000) and quintile 4 (coefficient = 0.731; p-value = 0.000). The interquartile differences between quintiles 3, 4 and 5 are not significant (p-value = 0.728, 0.809 and 0.694, respectively). However, the coefficient in quintile 5 is significantly smaller than that in quintile 2 (p-value = 0.000). We see that the coefficient on loss persistence (
 is not significant in quintiles 1 and 2 (p-value = 0.522 and 0.250, respectively). However, it is significantly negative in quintiles 3–5 (coefficient = −0.677, −0.501 and −0.329, respectively; p-value = 0.002, 0.001 and 0.010, respectively), although the difference between quintiles 3 and 4 is not significant (p-value = 0.283).
We note from Panel A that the marginal gain persistence coefficient
 is generally negative, the total gain persistence of the high accrual firms generally behaves in a manner consistent with Table 3. Specifically, the coefficient on gain persistence for the high accrual firms (
 +
+
 increases from 0.329 (p-value = 0.000) in quintile 1 to 0.563 (p-value = 0.000) in quintile 2, before declining to 0.338 (p-value = 0.000) in quintile 5. Similarly, although we find that the marginal loss persistence is generally not significant for the high accruals firms, the total loss persistence does not change monotonically for the high accrual firms. Although this is not consistent with our expectations, the results in Panel A of Table 8 present some evidence that our results are robust to controlling for accruals.
Panel B of Table 8 presents results for Equation (9). From the table, we see that the estimated coefficient,
 , which captures the value relevance of reported earnings for the low accruals sample changes from 10.850 (p-value = 0.001) in quintile 1 to 25.600 (p-value = 0.000) in quintile 2. This difference is significant (p-value of 0.027). The coefficient then increases to 26.590 (p-value = 0.000) in quintile 3 before declining monotonically thereafter to 4.429 (p-value = 0.251) in quintile 5. We also see that the coefficient
 , which measures the marginal value relevance of high accruals firms, is generally not significant. However, the total value relevance of earnings for the high accruals firms increases from the lowest quintile to the middle quintile, before declining again. Specifically, the coefficient on EPS for the high accruals firms (
 +
+
 increases from 8.319 (p-value = 0.000) in the lowest quintile to 23.100 in quintile 2 (p-value = 0.000), before declining to 5.814 (p-value = 0.000) in quintile 5. We find that all the interquartile differences are significant.
3.3.3 EPS and CPS forecasts and stock return volatility
 ()
() measures return volatility (the standard deviation of the firm’s stock returns over the quarter) and
 are indicator variables set equal to 1 if the firm’s ratio of CPS to EPS forecast is in quintile j. Following Bushee and Noe (2000), we include the following control variables in Equation (10):
 (quarterly market-adjusted returns),
 (abnormal trading volume for the quarter),
 ,
,
 ,
,
 and
and
 (natural logarithm of sales for the quarter). We expect that if CPS and EPS forecasts jointly convey useful information about firm performance, the coefficient on Rank2 and Rank3 will be lower than that on Rank1, Rank4 and Rank5. Table 9 presents the results of the estimation of Equation (10). From the table, we see that the coefficients on Rank2, Rank3 and Rank4 are negative and significant (coefficient = −0.003, −0.003 and −0.002, respectively, p-value = 0.000, 0.000 and 0.000, respectively). We also note that the coefficient on the intercept (which measures the coefficient on Rank1) is positive (coefficient = 0.034, p-value = 0.000). Further, the coefficient on Rank2 is significantly smaller than that on Rank1 (p-value = 0.000) and that on Rank3 is significantly smaller than that on Rank4 (p-value = 0.011). These results show that the information jointly conveyed by analysts’ CPS and EPS forecasts significantly affects stock return volatility, thereby providing more evidence on the importance of the joint information role of these forecasts.
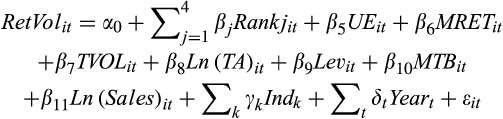
|
|
| RetVol | |
|---|---|
| Rank 2 | −0.003*** |
| (0.000) | |
| Rank 3 | −0.003*** |
| (0.000) | |
| Rank 4 | −0.003*** |
| (0.000) | |
| Rank 5 | −0.002*** |
| (0.000) | |
| UE | −0.000* |
| (0.080) | |
| Mret | −0.233 |
| (0.814) | |
| Tvol | 0.000*** |
| (0.000) | |
| Ln(TA) | −0.001*** |
| (0.000) | |
| Lev | 0.003*** |
| (0.000) | |
| MTB | −0.000* |
| (0.057) | |
| Lev | 0.003*** |
| (0.000) | |
| Ln(Sales) | −0.000*** |
| (0.000) | |
| Constant | 0.034*** |
| (0.000) | |
| Observations | 23,897 |
| Industry and year effects | Included |
| Adjusted R2 | 0.610 |
| p-values for the test of the equality of the coefficients on: | |
| Rank 2 and Rank 3 | 0.002 |
| Rank 3 and Rank 4 | 0.011 |
| Rank 4 and Rank 5 | 0.000 |
- This table is based on the sample of analysts’ forecasts defined in Table 1. The sample period covered is 1998–2017. The dependent variable (RetVol) in the above model is the standard deviation of the firm’s quarterly stock return. Rankj is a dummy variable equal to 1 if the firm’s ratio of CPS to EPS forecast lies in quintiles j and 3; zero otherwise. MRET measures the quarterly market-adjusted return; TVOL is the abnormal quarterly trading volume; Ln(Sales) is the natural logarithm of the firm’s quarterly sales. The other variables are as defined in Table 2. The numbers in parentheses are standard errors clustered at the firm and year-levels. ***, ** and * represent statistical significance at the 1, 5 and 10 percent levels, respectively.
3.4 Robustness tests
3.4.1 Using the prior period realised cash flows and earnings instead of forecasts
Recall that H1 and H2 test whether a more optimal mapping between operating cash flow and earnings, as expected by analysts, is associated with higher earnings persistence and greater value relevance of earnings. Our analysis essentially assumes that analysts can infer earnings quality accurately and build that information into their forecasts. However, given that analyst forecast accuracy is sometimes debatable, we test the reasonableness of this assumption by using last quarter’s reported earnings and cash flow per share as an expectation of future earnings and cash flow.
We present the results of the estimation of Equation (3) using quintiles of realised cash flow and earnings (in the previous quarter) in Table 10. As the table shows, the ratio of past realised cash flow and earnings is predictably associated with gains persistence (coefficient on Eit−1 increases from 0.346 in the lowest quintile of the ratio to 0.704 in quintile 3, before decreasing to 0.644 in quintile 5). However, it is not predictably associated with loss persistence. Specifically, we find an almost monotonic decline in loss persistence from the lowest quintile to the highest quintile of the ratio of last quarter’s realised cash flow and earnings (coefficient decreases from 0.374 in quintile 1 to −0.256 in quintile 5).
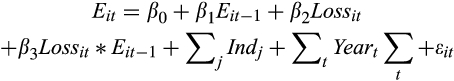
|
|||||
| Rank 1 | Rank 2 | Rank 3 | Rank 4 | Rank 5 | |
|---|---|---|---|---|---|
| EPSt −1 | 0.346*** | 0.596*** | 0.704*** | 0.692*** | 0.644*** |
| (0.000) | (0.000) | (0.000) | (0.000) | (0.000) | |
| Loss | −0.006*** | −0.002 | −0.000 | 0.002 | 0.000 |
| (0.001) | (0.279) | (0.855) | (0.156) | (0.632) | |
| EPSt −1 *Loss | 0.374*** | 0.004 | −0.066 | −0.325** | −0.256*** |
| (0.000) | (0.963) | (0.802) | (0.039) | (0.000) | |
| Constant | 0.026*** | −0.001 | 0.129*** | −0.005** | 0.006** |
| (0.000) | (0.151) | (0.000) | (0.006) | (0.033) | |
| Observations | 9,825 | 7,185 | 7,945 | 8,011 | 7,713 |
| Industry and year effects | Included | Included | Included | Included | Included |
| Adjusted R2 | 0.498 | 0.363 | 0.411 | 0.329 | 0.230 |
- This table is based on the sample of analysts’ forecasts defined in Table 1. The sample period covered is 1998–2017. Eit−1 is the earnings per share of the last quarter, scaled by the beginning of period stock price. Loss is a dummy variable equal to 1 if the company reported a loss in the current quarter; zero otherwise. The other variables are defined in Table 2. The numbers in parentheses are standard errors clustered at the firm and year-levels. ***, ** and * represent statistical significance at the 1, 5 and 10 percent levels, respectively.
We present results for the estimation of Equations (4) and (5) using quintiles of the ratio of last quarter’s ratio of realised cash flow and earnings in Table 11. Panel A of Table 11 shows that the results for value relevance are similar to those reported in Table 4 for the price model. Specifically, the coefficient on EPSit increases from 10.980 (p-value = 0.000) to 33.280 (p-value = 0.000) in quintile 3, before decreasing to 14.720 (p-value = 0.000) in quintile 5. However, we find that the coefficient on EPSit/Pit increases from 0.361 (p-value = 0.000) in the lowest quintile to 0.957 (p-value = 0.000) in quintile 2, before decreasing to 0.485 (p-value = 0.000) in quintile 4. Thereafter, the coefficient increases to 1.134 (p-value = 0.000) in quintile 5. These results show that a forecast that uses only past realised values of cash flow and earnings does not accurately capture expectations of future performance and that analyst forecasts are superior to time-series-based forecasts. These results are consistent with much early research on analyst forecasts (Fried and Givoly, 1982; Brown et al., 1987).
| Panel A: Price model | |||||
|---|---|---|---|---|---|

|
|||||
| Rank 1 | Rank 2 | Rank 3 | Rank 4 | Rank 5 | |
| EPS | 10.980*** | 30.190*** | 33.280*** | 28.240*** | 14.720*** |
| (0.000) | (0.000) | (0.000) | (0.000) | (0.000) | |
| CPS | 0.504 | −1.221* | −1.447** | −2.529*** | −0.905** |
| (0.122) | (0.090) | (0.042) | (0.000) | (0.049) | |
| BVPS | 1.052*** | 0.665*** | 0.605*** | 0.595*** | 0.938*** |
| (0.000) | (0.000) | (0.000) | (0.000) | (0.000) | |
| Constant | 13.140*** | 17.630*** | 17.600*** | 19.230*** | 13.170*** |
| (0.000) | (0.000) | (0.000) | (0.000) | (0.000) | |
| Observations | 8,385 | 6,266 | 6,956 | 7,122 | 6,785 |
| Adjusted R2 | 0.388 | 0.454 | 0.477 | 0.417 | 0.376 |
| Panel B: Return model | ||||||
|---|---|---|---|---|---|---|

|
||||||
| Rank 1 | Rank 2 | Rank 3 | Rank 4 | Rank 5 | ||
| EPS/P | 0.361*** | 0.957*** | 0.792** | 0.485** | 1.134*** | |
| (0.000) | (0.000) | (0.005) | (0.023) | (0.000) | ||
| CPS/P | 0.000** | −0.000 | −0.001 | −0.020*** | −0.083*** | |
| (0.017) | (0.834) | (0.989) | (0.000) | (0.000) | ||
| BVPS/P | 0.009 | 0.040 | 0.038 | 0.021 | 0.034 | |
| (0.290) | (0.178) | (0.159) | (0.329) | (0.112) | ||
| Constant | 0.024 | 0.027* | 0.036** | 0.047*** | 0.028** | |
| (0.154) | (0.058) | (0.006) | (0.001) | (0.031) | ||
| Observations | 8,371 | 6,374 | 7,068 | 7,143 | 6,730 | |
| Adjusted R2 | 0.007 | 0.013 | 0.009 | 0.004 | 0.016 | |
- This table is based on the sample of analysts’ forecasts defined in Table 1. The sample period covered is 1998–2017. The variables are as defined in Table 4. The numbers in parentheses are standard errors clustered at the firm and year-levels. ***, ** and * represent statistical significance at the 1, 5 and 10 percent levels, respectively.
3.4.2 Is the joint information content of analysts’ EPS and CPS forecasts affected by analyst forecast accuracy?
 ()
() , which measures the gains persistence of firms with less accurate analysts is positive (coefficient = 0.467, 0.730, 0.844 and 0.593; p-value = 0.000 for all) for quintiles 1–4. It is not significant for quintile 5 (p-value = 0.858). These results are consistent with Table 3. We note that the incremental gains persistence of firms with more accurate analysts – the coefficient on
 – is not significant, except for quintile 5. This suggests that less accurate analyst are as adept at identifying earnings persistence as more accurate analysts, suggesting that forecast accuracy does not definitively identify analyst quality. This is consistent with some accounting and finance research (Clement and Tse, 2003; Hilary and Hsu, 2013).
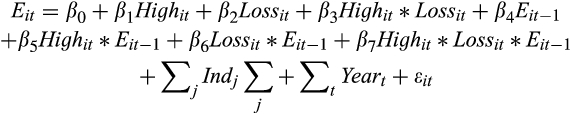
|
|||||
| Rank 1 | Rank 2 | Rank 3 | Rank 4 | Rank 5 | |
|---|---|---|---|---|---|
| High | −0.004 | −0.000 | 0.001 | −0.002 | −0.009** |
| (0.108) | (0.581) | (0.517) | (0.181) | (0.010) | |
| EPS | 0.467** | 0.730*** | 0.844*** | 0.593*** | −0.067 |
| (0.002) | (0.000) | (0.000) | (0.000) | (0.858) | |
| High*EPS | −0.058 | 0.008 | −0.136 | 0.114 | 0.776** |
| (0.746) | (0.921) | (0.109) | (0.366) | (0.033) | |
| Loss | −0.005** | 0.000 | 0.001 | −0.006** | −0.010** |
| (0.013) | (0.983) | (0.624) | (0.006) | (0.004) | |
| High*Loss | −0.000 | 0.003 | 0.005 | 0.009** | 0.011** |
| (0.917) | (0.341) | (0.404) | (0.046) | (0.006) | |
| EPS*Loss | 0.295* | 0.084 | −0.082 | 0.510** | 1.000** |
| (0.088) | (0.488) | (0.586) | (0.019) | (0.006) | |
| High*EPS*Loss | 0.035 | −0.205 | −0.245 | −0.879** | −1.370*** |
| (0.863) | (0.228) | (0.329) | (0.011) | (0.000) | |
| Constant | −0.002 | −0.004** | −0.051*** | −0.022*** | 0.047*** |
| (0.756) | (0.039) | (0.000) | (0.001) | (0.000) | |
| Observations | 11,431 | 9,869 | 10,533 | 10,509 | 10,171 |
| Industry and year effects | Included | Included | Included | Included | Included |
| Adjusted R2 | 0.539 | 0.469 | 0.489 | 0.367 | 0.248 |
- This table is based on the sample of analysts’ forecasts defined in Table 1. The sample period covered is 1998–2017. Eit−1 is the earnings per share of the last quarter, scaled by the beginning of period stock price. Loss is a dummy variable equal to 1 if the company reported a loss in the current quarter; zero otherwise. High is a dummy variable takes the value 1 if the absolute value of the analysts forecast error is above median; 0 otherwise. The other variables are defined in Table 2. The numbers in parentheses are standard errors clustered at the firm and year-levels. ***, ** and * represent statistical significance at the 1, 5 and 10 percent levels, respectively.
3.4.3 Joint information content of analysts’ EPS and CPS forecasts and past earnings persistence?
 ()
()where Highit is a dummy variable equal to 1 if the estimated earnings persistence is above the median for the sample; zero otherwise. We present these results in Table 13. This table shows that the coefficient on
 decreases from 0.577 (p-value = 0.000) in the first quintile of the rank of CPS and EPS forecasts to 0.237 (p-value = 0.000) in the fifth quintile. This suggests that the earnings persistence declines monotonically for firms with poor ex-ante earnings persistence, as the relative magnitude of the CPS forecasts increases, suggesting that analysts apparently cannot correctly identify earnings persistence when the ex-ante earnings quality is low. We find that the incremental persistence of earnings (measured by the coefficient on
 ) increases monotonically. This means that the total persistence of earnings (measured by the sum of coefficients
 and
and
 ) for the high ex-ante earnings persistence firms increases from 0.809 for the lowest quintile to 0.882 in quintile 2, before decreasing to 0.759 in quintile 5. These results are consistent with Table 3 and suggest that analysts find it easier to identify earnings quality when the ex-ante earnings quality is high.
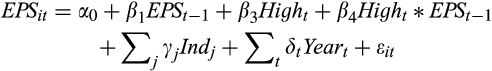
|
|||||
| Rank 1 | Rank 2 | Rank 3 | Rank 4 | Rank 5 | |
|---|---|---|---|---|---|
| EPSt −1 | 0.577*** | 0.459*** | 0.421*** | 0.300*** | 0.237** |
| (0.000) | (0.000) | (0.000) | (0.001) | (0.038) | |
| High | −0.002 | −0.006*** | −0.005** | −0.006*** | −0.006*** |
| (0.128) | (0.000) | (0.002) | (0.000) | (0.000) | |
| High*EPSt −1 | 0.232*** | 0.413*** | 0.421*** | 0.505*** | 0.522*** |
| (0.000) | (0.000) | (0.000) | (0.000) | (0.000) | |
| Constant | 0.004* | −0.002 | −0.028*** | −0.021*** | 0.037*** |
| (0.093) | (0.415) | (0.000) | (0.000) | (0.000) | |
| Observations | 10,976 | 9,598 | 10,444 | 10,415 | 10,006 |
| Industry and year effects | Included | Included | Included | Included | Included |
| Adjusted R2 | 0.528 | 0.498 | 0.565 | 0.401 | 0.254 |
- This table is based on the sample of analysts’ forecasts defined in Table 1. The sample period covered is 1998–2017. The dependent variable (EPS) in the above model is firm’s EPS scaled by closing stock price. High is a dummy variable equal to 1 if the firm’s earnings persistent coefficient is above median; zero otherwise. The other variables are as defined in Table 4. The numbers in parentheses are standard errors clustered at the firm and year-levels. ***, ** and * represent statistical significance at the 1, 5 and 10 percent levels, respectively.
4 Conclusion
We examine whether analysts’ CPS and EPS forecasts jointly provide information about earnings persistence and the value relevance of earnings. We also study whether the relative magnitudes of the these forecasts influence the market response to the earnings surprise.
Accounting standard-setters are of the opinion that financial statements complement each other and that together they provide complete decision-useful information. Accordingly, we argue that CPS and EPS forecasts jointly provide information to enable users to form better expectations about reported earnings. We find that the relative magnitudes of the CPS and earnings forecasts provide information about earnings persistence. Specifically, consistent with the idea that lower expected cash flow, relative to earnings indicate a greater proportion of expected accruals in earnings, we find that instances where CPS forecasts are low relative to EPS forecasts, are associated with lower earnings persistence than instances where CPS forecasts bear a more optimal correspondence with EPS forecasts. We also find that instances where CPS forecasts are high, relative to EPS forecasts, are associated with lower earnings persistence. This is consistent with the idea that high relative cash flows are more likely to indicate successful realisations of past accruals than current period earnings growth. We also find that the value relevance of earnings bears a similar association with EPS and CPS forecasts, suggesting that these two forecasts jointly provide useful information to help users assess the quality of the firm’s earnings. Importantly, we note that our results above are robust when we control for the level of absolute accruals realised at the end of the quarter. We also find that our results above do not hold when we consider only the EPS (and CPS) forecasts, thereby providing more explicit support for the joint information role of these forecasts.
We next examine whether the market’s reaction to the earnings surprise is conditional on the relative magnitudes of the cash flow and earnings forecast. We find that the market’s response to the earnings surprise increases as the ratio of the cash flow and the earnings forecast increases from the lower end of the distribution to the middle and then decreases again. Taken together, our results show the importance of the joint information role of analysts’ earnings and cash flow forecasts.
References
- We use the terms ‘surprise’ and ‘forecast errors’ interchangeably.
- FASB Concept Statement 5, para. 55 argues that: ‘Since neither earnings nor comprehensive income measured by accrual accounting is the same as cash flow from operations, cash flow statements provide significant information about amounts, causes, and intervals of time between earnings and comprehensive income and cash receipts and outlays. Users commonly consider that information in assessing the relationship between earnings or comprehensive income and associated cash flows’.
- Although we do not focus on analysts’ forecasting ability in our main tests, we do provide some evidence that their forecasts are good proxies for market expectations, in Section 3.4.2. These results indirectly speak to analysts’ forecasting ability.
- We illustrate the idea above with two examples. Consider two companies A and B, that operate in the same industry and report identical earnings of $0.05. Without any further information, an investor would likely value the earnings equally. Now suppose that company A has a cash flow of $0.03, whereas company B has a cash flow of $0.01. Clearly, based on this additional information, we can argue that company A’s earnings are supported by cash flows to a greater degree than company B. Accordingly, since cash flow tends to more persistent than accruals (Sloan, 1996), we could conclude that company A is likely to have higher earnings quality than company B. Consider another scenario. Suppose now that company A (B) reports a cash flow of $0.03 ($0.15). Let us assume that earnings are still $0.05 for both companies. In this scenario, company B reports a cash flow that far exceeds the earnings. This is more likely to be because company B has successfully realised its past accruals. Consequently, company B’s cash flow would be unlikely to have any incremental implication for its earnings quality. In other words, to the extent that the cash flow maps well into the earnings, it is likely to convey information about earnings quality. To the extent that analysts can accurately estimate future cash flow and earnings, these examples illustrate the importance of examining earnings quality in the light of the information conveyed by both EPS and CPS forecasts, when they are available.
- Creating quintiles allows us to better characterise the non-linear relation of the relative magnitudes of the earnings and cash flow forecasts with earnings quality and informativeness. If rank is very low or very high, it is likely that there is a poor correspondence between current period expected earnings and cash flows.
- While our results thus far suggest that CPS and EPS forecasts jointly provide information about the persistence and value relevance of reported earnings, the assignment of observations into quintiles by ratio also means that firms in the extreme (middle) quintiles are those with high (low) levels of absolute expected accruals. In other words, our results could plausibly be interpreted as firms with lower expected absolute accruals having more persistent and value-relevant earnings. This association between accruals and earnings properties has been established in prior research (Sloan, 1996; Chan et al., 2006). Our study is different from other studies of the association between reported accruals and earnings quality because we focus on forecasts and not actually reported accruals, which are prone to manipulation. By focusing on forecasts, we study the extent to which expected mapping between cash flow and earnings is associated with the properties of earnings actually reported at the end of the period. We elaborate on this point in detail in Section 3.3.2 below. However, in order to demonstrate that our results are not driven by actual accruals, we conduct a sensitivity test by controlling for the level of accruals and show that our results are not sensitive to the accruals actually reported.
- See http://bits.blogs.nytimes.com/2013/08/01/linkedins-profits-soar-as-user-growth-accelerates/
- See https://www.moodys.com/research/Moodys-downgrades-Nippon-Yusen-to-Baa3-outlook-negative--PR_357382
- We state our hypotheses in the alternate form.
- Refer to Chapter 1: The Objective of General Purpose Financial Reporting, Statement of Financial Accounting Concepts Number 8 of FASB.
- We check the robustness of our main results by removing these observations and find that our results (untabulated) are qualitatively similar.
- Alternately, we estimate Equation (3) by replacing
 (
(
 ) with
 (
(
 ). This is based on the assumption that EPS and CPS forecasts for period t provide information about the persistence of reported earnings in period t + 1. Our results do not change.
 - As we use quarterly data in our analysis, we also conduct robustness tests by replacing
 in equation (3) with
 to control for seasonality. Our (untabulated) results remain fundamentally unchanged.
 - We alternately define Loss as a dummy variable, set equal to 1 if the earnings surprise, measured with respect to the consensus analyst forecast error, is negative; zero otherwise. Our results are qualitatively similar.
- Most one-quarter-ahead forecasts are issued prior to the close of the fiscal period. Therefore, this selection criterion resulted in a loss of less than 5 percent of the sample.
- Following convention, we examine observations lying above (below) the 99th (1st) percentiles of the respective distributions to identify potential outliers.
- Alternately, we could include dummy variables for the specific ranks and interact those dummy variables with the independent variables of interest and test H1 using a single model. We choose the research design identified in Section 2.2.1 primarily because of its simplicity.
- We do not tabulate this.
- To statistically compare the incremental R2 for quintiles 1 and 3, we first create a sub-sample of observations from these quintiles. Then we create a dummy variable (Q3) equal to 1 if the observation is from quintile 3; zero otherwise. Then we interact Q3 with the independent variables in Equations (4) and (5) above. We calculate the incremental R2 by obtaining the R2 from Equations (4) and (5) without the dummy variable (and the interaction terms) and that from Equations (4) and (5) augmented with the dummy variable (and the interaction terms), and calculate its significance by constructing the F-statistic described above.
- We do not describe the incremental R2 for this test.
- The difference in coefficients is significant (p-value = 0.000).
- We do not report the p-values for the sake of brevity.
- We do not report the p-values for the sake of brevity.
- We use the word ‘optimal’ to indicate the level of cash flow (and accruals) that maximises the persistence of earnings.
- All the coefficients are significant at the 1% level of significance.
- All the coefficients are significant at the 1% level of significance.