Single-cell sequencing reveals the immune landscape of breast cancer patients with brain metastasis
Huaping Zhou and Xiang He contributed equally to this work.
Abstract
Background
Breast cancer has the highest incidence rate of cancer worldwide, and brain metastases (BrM) are among the most malignant cases. While some patients have benefited from immune checkpoint inhibitors (ICIs), the complex anatomical structure of the brain and the heterogeneity of metastatic tumors have made it difficult to characterize the tumor immune microenvironment (TME) of metastatic tumors.
Methods
To address this, we used single-cell RNA sequencing (scRNA-seq) to analyze immune cells in the cerebrospinal fluid (CSF) of BrM patients with breast cancer, thereby providing a comprehensive view of the immune microenvironment landscape of BrM.
Results
Based on canonical marker genes, we identified nine cell types, and further identified their subtypes through differential expression gene (DEG) analysis. We compared the changes in cells and functions in the immune microenvironment of patients with different prognoses. Our analysis revealed a series of genes that promote tumor immune function (CCR5, LYZ, IGKC, MS4A1, etc.) and inhibit tumor immune function (SCGB2A2, CD24, etc.).
Conclusions
The scRNA-seq in CSF provides a noninvasive method to describe the TME of breast cancer patients and guide immunotherapy.
INTRODUCTION
Breast cancer is the most commonly diagnosed cancer worldwide and the leading cause of cancer-related deaths among women in many countries,1 Despite advances in diagnosis and treatment, there are still many challenges to be addressed. Brain metastasis is a serious complication of breast cancer and is associated with poor prognosis. Almost all breast cancer-related deaths are caused by metastatic tumors rather than primary tumors. However, the molecular mechanisms underlying brain metastasis of breast cancer remain poorly understood. Current clinical treatment standards for breast cancer brain metastasis include surgery, stereotactic radiosurgery, whole brain radiotherapy, or a combination of chemotherapy,2 and systemic treatment with Poly-ADP-ribose-polymerase (PARP) inhibitors.3 However, regardless of the treatment modality used, the overall survival (OS) of patients is often less than a year.4 In the process of forming brain metastasis, tumor cells need to pass through the blood–brain barrier (BBB). After entering the BBB, the microenvironment of tumor cells changes, and breast cancer BrM and primary tumors have different immune landscapes.5
The tumor immune microenvironment is a complex ecosystem comprising cancer cells, immune cells, fibroblasts, and vascular cells, and operates through intricate mechanisms. Since the discovery of immune checkpoints and the use of immune checkpoint inhibitors (ICI), researchers have increasingly recognized the importance of the tumor immune microenvironment in tumor diagnosis and treatment. The development of single-cell RNA sequencing (scRNA-seq) has enabled the identification of new subcellular types and corresponding cellular functional states, providing a deeper and more complex understanding of the TME. This technology has shown great potential in the diagnosis, treatment, and prognosis prediction of tumors.6, 7 Currently, scRNA-seq has been widely applied in TME studies of various types of tumors.8
Pathological sampling through invasive surgery has long been considered the gold standard for the diagnosis of brain tumors and BrM. However, collecting tumor tissue from brain tissue is difficult and poses risks, and patients with metastatic tumors are often not suitable for surgical treatment. Recently, fluid biopsy of cerebrospinal fluid (CSF) has emerged as a promising approach for providing genetic characteristics of brain tumors and the tumor immune microenvironment (TME).9, 10 scRNA-seq of CSF is also being used to describe the tumor immune landscape of BrM.11, 12
To elucidate the immune landscape of breast cancer patients with brain metastasis, we analyzed the cellular composition of the tumor immune microenvironment in the CSF of patients with breast cancer brain metastasis using scRNA-seq. We focused on the main cell types, including T cells, macrophages, and DC cell subtypes, and their related biological functions. To better understand the factors that affect the immunocyte response in the TME, we compared the proportion of immune cells and differentially expressed genes in the CSF of patients with BrM with good and poor prognoses, providing a detailed view of the complexity and heterogeneity of the TME that leads to different prognoses. These findings will provide important evidence to support the diagnosis, treatment, and molecular mechanisms of brain metastasis in breast cancer.
METHODS
Patients
This study was approved by the Affiliated Cancer Hospital and Institute of Guangzhou. We obtained CSF samples from 12 patients with brain metastasis of human breast cancer from the Affiliated Cancer Hospital and Institute of Guangzhou, with informed consent obtained from all patients. The clinical information of all patients is summarized in the Supplementary Information (Table S1).
Acquisition of cerebrospinal fluid and preparation of single-cell samples
We collected 12 samples from breast cancer patients with BrM. Cerebrospinal fluid samples were obtained by lumbar puncture. A 3 mL sample was separated from the lumbar puncture and centrifuged at 400 × g for 10 min to obtain cells, which were then stored in PBS + 0.05% BSA.
Single-cell RNA sequencing
Single-cell suspensions (2 × 10⁵ cells/mL) in PBS (HyClone) were loaded onto a microwell chip using the Singleton Matrix Single Cell Processing System. Barcoding beads were subsequently collected from the microwell chip, followed by reverse transcription of the mRNA captured by the barcoding beads to obtain cDNA and PCR amplification. The amplified cDNA was then fragmented and ligated with sequencing adapters. The scRNA-seq libraries were constructed according to the protocol of the GEXSCOPE Single Cell RNA Library Kits (Singleton).13 The single library was diluted to 4 nM and combined for sequencing. Finally, 150 bp paired terminal read sequencing was performed on Illumina novaseq 6000.
Single-cell RNA data analysis
For quality control, we used the Seurat R package, Seurat objects were created for each sample with the cell-by-gene count matrix using Create Seurat Object (arguments: min. cells = 5). Cells with high mitochondrial content (10% for tumor libraries) and low gene number detection (<300) were considered low-quality cells and discarded. Potential doublets identified via scrublet were also removed from further analyses (Figure S7).
We used Seurat version 4.0 to standardize the expression matrix using the “NormalizeData” and “ScaleData” functions. Then the top 2000 variable genes were selected by the “FindVariableFeautres” function and principal component analysis (PCA) was carried out. To integrate cells from different samples and platforms for unsupervised clustering, we used Harmony and set the sample and platform as two technical covariables for batch correction. Using the “FindCluster” function to identify cell clusters with a resolution of 0.04.14 Finally, the UMAP algorithm was applied to visualize cells in a two-dimensional space.
To identify differentially expressed genes (DEGs), we used the “FindAllMarker” function and Wilcoxon's test with default parameters, and the most significant DEG in each cluster were identified. For the cell type annotation of each cluster, we combined the expression of canonical markers found in the DEGs has been reported15 and displayed the expression of markers of each cell type with heatmaps/dot plots/violin plots that were generated with SeuratDoHeatmap/DotPlot/Vlnplot function (adjusted p < 0.05, log2 fold change >0.5, and FDR <0.01 with both methods). Doublet cells were identified as expressing markers for different cell types and removed manually.
For T cells, macrophages, and DCs, we extracted cells from the integrated data set for subclustering. Perform gene rescaling, dimensionality reduction, batch correction, and cell aggregation as described above. For T cells, cell subclusters were determined according to the following gene markers: MAL, NKG7, CCR5, SCGB2A2, HLA-DRA, and MS4A1. For macrophages, cell subpopulations according to the following gene markers: VCAN, C1QB, KRT19. For DCs, cell subclusters were determined according to the following gene markers: ACOT8, IGKC, LYZ, MS4A1, and ZNF184.
Correlation analysis between different cell types to explore the correlation between different cell types, we first calculate the average gene expression level of cells belonging to the same cell type and combine it to calculate the Spearman correlation coefficient. Visualization of correlation coefficients between different cell types using the heat map software package (version 1.0.12).
Screening of differentially expressed genes and the differentially expressed genes were detected by the “FindMarkers” function in the Seurat software package. Genes with (adjusted p < 0.05 and |logFC| > 0.5 thresholds).
The “clusterProfiler” R package and Metascape were used to perform GO term analysis (version 3.5) Results were visualized using the “ggplot2 R" package (version 3.2.1).
CellCall version 0.0.0.900016 was used to analyze the intercellular interaction based on the receptor-ligand interaction between two cell types/subtypes and inferred the signaling pathways of the internal regulation. The fraction of ligand-receptor gene interactions between cell types was assessed by integrating the L2 norm of the ligand-receptor interaction and the activity fraction of downstream TFs, which was calculated by the inbuilt GSEA algorithm. Finally, ligand-receptor-Tf with a significant interaction between cell types was selected by using a hypergeometric test (p < 0.05). Visualization was performed by using the inbuilt plotting function from CellCall.
RESULTS
ScRNA-seq and CSF immune landscape
To study the phenotype of the immune landscape in the CSF of patients with brain metastasis of breast cancer, we performed scRNA-seq on CSF samples of 12 patients with brain metastasis of breast cancer (Figure 1a). First, we used the UMAP algorithm to distinguish cells by the high expression of canonical marker genes unique to different cell types. Through the canonical marker genes, we artificially annotated nine clusters of immune cells. For example, T cells are divided approximately into immune positive-mediated T cells and negative-mediated regulatory T cells (Treg) two clusters; myeloids are divided into mononuclear macrophages (MonoMac), macrophages (Mac), tumor-associated macrophages (TAMs), and other myeloids (myeloid). The other three clusters are dendritic cells (DC), endothelial cells and fibroblasts (Endo_Fib) and glioblastal (Figure 1b). The violin plot illustrates the difference in marker gene expression among different cell types in the sample (Figure S1a).
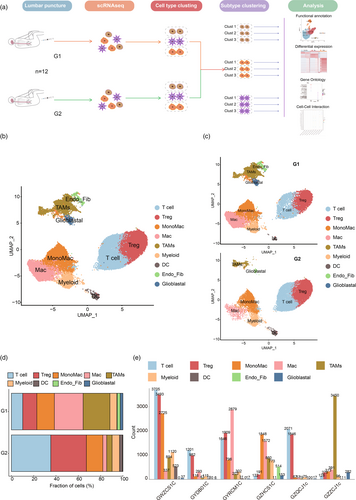
To investigate changes in the TME of breast cancer patients with BrM and different prognoses, we divided patients into two groups based on progression-free survival (PFS). Those with PFS <6 months were assigned to the G1 group, representing a poor prognosis, while those with PFS >6 months were assigned to the G2 group, representing a good prognosis (Table S1). Clustering the cell types of the G1 and G2 groups using cell typing (Figure 1c) revealed the proportion of cell types between the different groups (Figure 1d). Compared to the G1 group, the G2 group showed a significant increase in the proportion of T cells and DC cells, which are beneficial to tumor immunity. However, the proportion of Treg cells, which often represent tumor immunosuppression, also increased with the proportion of T cells. In contrast, the proportion of TAMs and Mac cells decreased in the G2 group. Furthermore, the Endo_Fib and glioblastal clusters almost disappeared in the G2 group, while the proportion of MonoMac and myeloid clusters did not change significantly between the G1 and G2 groups.
We also analyzed the number of immune cells in each cluster of CSF samples from different patients (Figure 1e). The number of immune cells in each cluster varied greatly among different patients, indicating a high degree of heterogeneity in the tumor immune microenvironment among individuals. Additionally, we performed gene ontology (GO) enrichment analysis on different cell clusters to explore the biological processes of different cell clusters (Figure S1b). The results showed that DC, Mac, MonoMac, myeloid, and T cell clusters were related to lymphocyte and myeloid cell-mediated immunity. Mac, MonoMac, myeloid, T cell, and Treg clusters were related to the regulation of cytokines, T cell activation, and immune cell differentiation. Furthermore, Mac, MonoMac, and myeloid clusters were also associated with the mechanism of antigen presentation.
Changes in the T cell subcluster affect the immune microenvironment
T cells are important cells in the immune system that directly kill tumor cells. We divided all immune cells into T cell clusters and Treg clusters. By clustering the transcriptomes of T cells, we identified six different T cell phenotypes using UMAP (Figure 2a,b). We named different clusters after the genes with the highest expression difference in DEGs. We named different clusters after the genes with the highest expression difference in DEGs. C1_MAL was characterized as naïve T cells (MAL, CCR7, IL7R) through the “CellMarker 2.0” database.15 C2_NKG7 and C3_CCR5 represented cytotoxic T cells (NKG7, CCL5, CCL4; CCR5, GZMK, GZMA). C5_HLA-DRA corresponded to CD8+ T cells (HLA-DRA) and C6_MS4A1 corresponded to CD4+ T cells (CD79A). Among them, the CCR5, SCGB2A2, and MS4A1 genes were specifically expressed in the corresponding cell clusters, and NKG7 was expressed in both C2_NKG7 and C4_SCGB2A2 (Figure S2a).
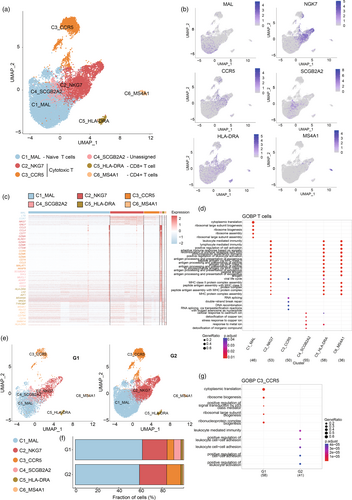
The DEG heat map of different groups showed differences in gene expression. C1_MAL highly expressed MAL, LTB, CCR7, and other immune-promoting genes. C2_NKG7s and C3_CCR5 highly expressed tumor-killing NKG7 and GZM family proteins. C5_HLA-DRA and C6_MS4A1 showed high expression of HLA, but C5_HLA-DRA also showed a high transcriptional level of effector protein LYZ. MS4A1 (also known as CD20) and IGKC, the character genes of C6_MS4A1, show B cell-like characteristics (Figure 2c). GO analysis showed that C2_NKG7s, C5_HLA-DRA, and C6_MS4A1 had functions related to antigen presentation and cell activation, such as lymphocyte-mediated immunity, peptide antigen assembly with MHC protein complex and antigen processing, and presentation of exogenous peptide antigen (Figure 2d).
Compared with the G1 group, the total number of T cells in the G2 group increased significantly (Figures 1d and 2e), and the proportion of C3_CCR5 clusters increased nearly two-fold (Figure 2f). A lot of evidence has shown that CCR5 plays an important role in memory T cells, such as promoting memory response and antigen sensitivity of CD4+ memory T cells17 and mediating the migration of bystander-activated CD8+ T cells.18 It can be speculated that in the G2 group, C3_CCR5 increased significantly and suppressed the tumor by indirectly promoting other immune effector cells, which leads to a better prognosis. Meanwhile, compared with the G1 group, DEGs of C3_CCR5 in the G2 group showed enrichment in immune cell regulation and cell adhesion functions, such as positive regulation of cell–cell adhesion and positive regulation of leukocyte activation (Figure 2g). It is worth noting that the C4_SCGB2A2, which accounts for about 10% of the G1 group, almost disappeared in the G2 group. SCGB2A2 is a secretory dimer protein with unknown physiological function and is expressed in many gynecological malignant tumors.19 Several studies have reported that mammaglobin in lymph nodes, blood, and bone marrow samples can be used as a breast cancer diagnostic marker for indicating minimal residual lesions and TME states in patients with breast cancer.20, 21 Unfortunately, the role of SCGB2A2 in immune cells has not been clarified yet, and its biofunction needs to be further explored. In addition, it has been proved that the differentially expressed CD24 in the C4_SCGB2A2 subcluster can bind to surface sialic-acid-binding Ig-like lectin 10 (Siglec-10) of macrophages to induce SHP-1 or SHP-2-mediated inhibitory signaling.22 In addition, the C1_MAL, C2_NKG7, and C5_HLA-DRA subclusters of group G2 were enriched in genes that promoted tumor immune-related regulation compared with group G1 (Figure S2b–d).
Changes in macrophage subcluster change the immune microenvironment
Macrophages, which are famous for their plasticity, are an important part of leukocyte infiltration. Monocytes are recruited from the blood by cytokines to differentiate into TAM and regulate tumor immunity together with resident macrophages in the tissue.23 TAM affects almost all aspects of tumor cell biology, including directly promoting tumor progression by promoting angiogenesis, epithelial-mesenchymal transformation, invasion and metastasis, and cell proliferation. In addition, TAM can also form an immunosuppressive microenvironment24, 25 by secreting inhibitory cytokines such as TGF β and IL-10 and expressing immune checkpoint molecules such as PD-L1. We performed a UMAP algorithm to divide the macrophage into three subclusters and identified three cell subtypes: C1_VCAN represented the mononuclear macrophage (MonoMac; VCAN, CD1C, LYZ), C2_C1QB represented the macrophage (Mac; C1QA, C1QB, C1QC), and C3_KRT19 represented the tumor-associated macrophages (TAM; CD24) (Figure 3a,b). The expression of marker genes VCAN, C1QB, and KRT19, respectively, show high specificity. While the characteristic gene of the C2_C1QB, the C1QB gene, was also partly expressed in the C1_VCAN (Figure S3).
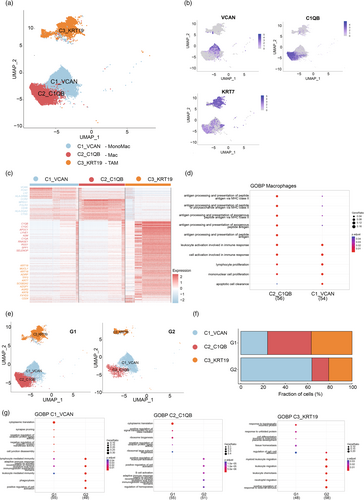
Through the analysis of the DEGs of the three subtypes of cells, it was found that the transcriptomic profiles of the three subtypes of cells were isolated. Differential expression analysis of the C1_VCAN showed that some immune positive genes such as LYZ, MPEG1, HLA family genes, and CTSS were differentially expressed in the C1_VCAN compared with the other two clusters. The C2_C1QB cluster differentially expressed complement-related genes, such as C1QA, C1QB, and C1QC, while the C3_KRT19 cluster highly expressed various keratins such as KRT19, KRT18, and KRT3 (Figure 3c). GO analysis reported several enriched terms in the C1_VCAN and C1_VCAN, such as lymphocyte proliferation, mononuclear cell proliferation, and cell activation involved in the immune response. In addition, C1_VCAN also shows biological functions related to antigen presentation, such as antigen processing and presentation of peptide antigens via MHC class II. However, C1_VCAN also shows a certain correlation but with a low gene ratio and high p-value (Figure 3d).
The change in the proportion of the macrophage subtype cluster in the G2 group shows that the C1_VCAN increased by an even two-fold level (Figure 3f) than the G1 group. Combining the result with the decrease in the frequency of C2_C1QB and C3_KRT19 (Figure 3e), we speculated that the increase in the proportion of monocytes, which has been known as the precursor of macrophages, could lose the differentiation ability of monocytes. Meanwhile, GO analysis showed that C1_VCAN cells in the G2 group were related to positive regulation of cell activation, leukocyte-mediated immunity, phagocytosis, and other positive immune functions (Figure 3g). Comparing the proportion of C2_C1QB between different prognosis groups, the proportion of C2_C1QB in the G2 group decreased significantly. The C1q complex, composed of C1QA, C1QB, and C1QV, is an important part of the classical complement system and shows specific differential expression in the C2_C1QB subtype. C1Q + macrophages were associated with poor prognoses in various tumors, such as clear cell renal cell carcinoma, hepatocellular carcinoma, and breast cancer.26 Furthermore, C1q + Mac has been reported to mediate T cell exhaustion by secreting CXCL10 and expressing immune checkpoint molecules, such as PD-1,4 which could explain the decrease of C2_C1QB proportion in the G2 group. TAMs induce tumor immunosuppressive microenvironment by promoting the immunosuppressive activity of Treg and producing immunosuppressive metabolites through arginase activity and indoleamine-2-dioxygenase-1 (IDO1/2) pathway. The proportion of C3_KRT19 in the G2 group was significantly lower than that in the G1 group (Figure 3f), which could suggest that a decrease in the number of inhibitory immune cells in TME leads to a better tumor immune response. On the other hand, the DEG of G2 regulates the biological functions related to the regulation of immune cells, such as the enrichment of leukocyte migration, and leukocyte chemotaxis suggests that the C3_KRT19 of the G2 group may be transformed into an immune-promoting function (Figure 3g), similar to the polarization process from M2 macrophages to M1 macrophages.
Dendritic cell subcluster affects immune response
Dendritic cells (DC) have been considered one type of antigen-presenting cell (APC), which can obtain and process antigens and present them to T cells. During the differentiation of DC cells, DC progenitor cells produce three main DC subsets: CD1c + DCS, CD141+ DC, and plasma cell-like DCS (pDCs), in which CD1c + DCS and CD141+ DCS are also called conventional DCs (cDCs).27, 28 By UMAP clustering, DC cell clusters were divided into five subclusters: C1_IGKC, C2_LYZ, C3_MS4A1, C4_ZNF184, and C5_ACOT8 (Figure 4a,b). C1_IGKC corresponded to plasmacytoid dendritic (pDC; MRPL36, JCHAIN) and C4_ZNF184 also represented pDC (RABGAP1L, SLC15A4). C2_LYZ and C3_MS4A1 represented conventional DCs (cDCs; VCAN, ANXA1; LAT2).

The heat map showed the differentially expressed genes of five DC subclusters, and there were significant differences in gene profiles among different clusters (Figure 4c). GO analysis showed that C1_IGKC clusters were involved in the immune regulation of leukocytes and activation of immune cells such as lymphocyte-mediated immunity and regulation of B cell activation. The DEGs of C2_LYZ clusters show the function of immune regulation such as regulating the proliferation of immune cells and negative regulation of the immune system process (Figure 4d). DCs were analyzed by cluster analysis to compare the changes of DC cell subclusters in the G1 group and G2 group. The proportion of C1_IGKC and C3_MS4A1 in the G2 group was significantly increased (Figure 4e,f). The proportion of C1_IGKC clusters that regulate immune cell-mediated immune response and immune cell activation (as described above), which promoted the tumor inhibition ability of immune effector cells, increased in the G2 group. In addition, GO analysis of G2 C1_IGKC clusters also shows that C1_IGKC cluster antigen presented related genes upregulated. In addition, the C3_MS4A1 cluster, which has been reported as CD1C + DCS could secrete IL-12, tumor necrosis factor-α, IL-8, and IL-10, and induce activation of TH1 cells, TH2 cells, TH17 cells, and CD8 + T cells.29 Although the proportion bar revealed that the ratio of the C2_LYZ cluster decreased in the G2 group, both the total number of DC cells and the subcluster increased in the G2 group (Figure 4e,f). Furthermore, compared with the C2_LYZ of the G1 group, the C2_LYZ of the G2 group was enriched in the functions related to antigen processing and presentation (Figure 4g), suggesting that the function of C2_LYZ in G2 may be activated by other immune effectors.
Intercellular interactions affect the immune microenvironment
To explore the changes in immune cell interaction in patients between different prognosis groups, we performed cell–cell interactions (CCIs) analysis on scRNA-seq data. The results showed that there was binding between the HLA family and CD4 among different subsets of DCS in both G1 and G2 groups. It is worth noting that there were MIF-(CD74 + CXCR4) and MIF-(CD74 + CD44) binding between the C4_SCGB2A2s of the G1 group and C1_IGKC and C2_LYZ, which account for the majority of DC (Figure 5a). Macrophage migration inhibitory factor (MIF) can bind and activate CD74 and chemokine receptors CXCR4 and CD4430 and it has been reported that blocking the MIF-CD74 signal transduction of DCS can increase the ability of DCS to activate cytotoxic T cells and restore antitumor immune response.31 However, the C4_SCGB2A2s almost disappeared in G2 and reduced its inhibition on DC, which could promote the activation of cytotoxic T cells by DC. Meanwhile, the immunosuppressive interaction between MIF and CD74 also occurred in the G1 group between TAMs and all subcluster T cells and DCs, but not in the G2 group (Figure 5b,c), which reveals the important role of MIF-CD74 in tumor immune of BrM. Similarly, MDK−SDC1 and MDK–NCL ligation occur between C4_SCGB2A2s to DC subclusters, C4_SCGB2A2s to C3_CCR5, C3_CCR5 to DC subclusters, and C3_CCR5 to T cell subclusters, which shows the effect may lead to T cell exhaustion in another scRNA-seq analysis.32 Furthermore, APP−CD74 interaction was also found in the suppression of TAMs on T cell subclusters and disappeared in the G2 group.
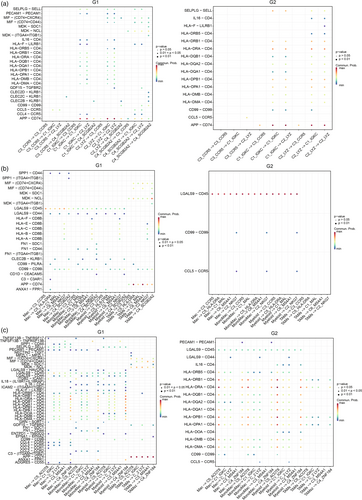
Interestingly, the interactions between C1_IGKC and C2_LYZ were similar between the G1 and G2 groups, except for CD99-CD99 and PECAM1-PECAM1 interaction. CD99-CD99 interaction exists only in G2, which is known to regulate the expression of CD1a in DC,33 and promote the translocation of the TCR complex to lipid craft.34 On the contrary, the binding of PECAM1-PECAM1 exists only in G1. Studies have shown that tyrosine phosphorylation of PECAM-1 mediates the inhibition of the TCR signal by recruiting the protein tyrosine phosphatase 2 (SHP-2).35 Moreover, PECAM-1 can promote T cell functional inhibition mediated by nonclassical (Smad independent) TGF- β signal transduction in T cells.36 In brief, the DC of the group with poor prognosis was mutually inhibited among subclusters of DC.
CLE2(B/C)-KLRB1 interaction in the G2 group was significantly reduced compared with G1. KLRB1 receptor was identified as a prototypical natural killer cell surface antigen, which was later shown to be expressed in CD4+ and CD8 + TCRαβ+T cells, NKT cells, and TCRγδ+T cells. KLRB1 has been identified to activate NK cell function and recognize the ligand on tumor cells.37 However, some subfamilies have been proven to be able to inhibit NK cell activity. It is a pity that the effect of KLRB1 on T cells has not been reported. In addition, CLE2C(CD69) has been reported to inhibit immune response and maintain immune tolerance by promoting the secretion of immunosuppressive IL-10 and expressing high-level inhibition-related markers such as CTLA-4, ICOS, CD38, and GITR.38 We speculate that the decrease of CLE2C-KLRB in Treg cells in the G2 group weakens the immunosuppressive effect of Treg, resulting in a better curative effect.
DISCUSSION
Analyzing the composition and status of immune cells within the tumor immune microenvironment (TME) can provide an insight into how a patient's immune function affects tumor development. This information can aid in the diagnosis and treatment of immunotherapy. The TME plays a significant role in determining the immune characteristics of tumors and their response to treatment. However, the TME of brain metastases (BrM) can vary greatly between different primary tumors and even between BrM from the same primary tumor.39, 40 This makes it difficult to generalize the TME of BrM.
In recent years, the use of single-cell RNA sequencing (scRNA-seq) has allowed for more accurate identification of individual cell types within the tumor immune microenvironment of patients. Studies have shown that scRNA-seq analysis of CSF samples can provide valuable information about the immune microenvironment of BrM.11, 12, 41, 42 Traditional methods of surgical and puncture sampling are limited by the heterogeneity between multiple metastases and the complexity of brain sampling. In contrast, collecting CSF samples through lumbar puncture is a minimally invasive and convenient procedure that can provide a more comprehensive view of the immune microenvironment in BrM.
We conducted single-cell RNA sequencing (scRNA-seq) on cells from patients with breast cancer BrM. Our clustering method detected differences in immune cell subclusters and characteristic genes in the CSF, as well as interactions between immune cells in different groups. We identified nine cell subtypes: T cells, Tregs, MonoMacs, Macs, TAMs, myeloids, DCs, Endo_Fibs, and glioblastals from CSF samples and analyzed their functions in the tumor microenvironment (TME). We also compared the single-cell map of CSF from patients with different prognoses. The scRNA-seq data showed that the number and proportion of immune cells were quite specific. In the G2 group, T cells and DCs increased significantly while Macs, TAMs, Endo_Fibs, and glioblastals decreased significantly. There were also differences in the number and proportion of immune cells in different samples, indicating individual heterogeneity in the tumor immune microenvironment. Additionally, we used UMAP to analyze T cell, macrophage, and DC subtypes and explained the differentially expressed genes (DEGs) and functional differences of each subtype. We also analyzed functional changes in several subsets with different prognoses. Finally, we examined interactions between T cells and DCs as well as between T cells and macrophages and found changes in cell interactions among different prognoses.
Together, we described the immune landscape of CSF of patients with brain metastasis of breast cancer, characterize the composition of immune cells in the immune microenvironment of brain metastatic tumors, describe the changes of TME in the CSF of patients with different prognoses, and find the effect of the change of transcriptional spectrum of some characteristic molecules (such as SCGB2A2, ACOT8) on the prognosis, which provides evidence for further study of its biological function and helping clinical diagnosis and treatment.
There were some limitations to this study. For instance, our research only included single-cell sequencing data from 12 cases of CSF, which may not be representative of all breast cancer patients with BrM. Additionally, while we identified nine types of cells from the single-cell sequencing data of CSF, we only studied the subclusters and functions of T cells, macrophages, and DCs. Other immune cells such as Tregs and myeloids also play significant roles in tumor immunity. Furthermore, our research results still have some distance to go before they can guide clinical treatment, which will require further in-depth and translational research.
In this study, we employed scRNA-seq to elucidate the heterogeneity of immune cell subpopulations and their characteristic genes within the TME of breast cancer patients with BrM. Our research identified differences in immune cell subclusters and characteristic genes in the CSF of patients with varying prognoses, as well as interactions between immune cells in different groups. This aspect, rarely addressed in previous studies, offers a new perspective on understanding the complexities of brain metastases in breast cancer. Moreover, our findings reveal variations in the quantity and proportion of immune cells across different samples, highlighting the individual heterogeneity within the tumor immune microenvironment. This contributes to a better understanding of why patients respond differently to treatments. In summary, our research deepens the understanding of the immune microenvironment in brain metastases of breast cancer and paves the way for novel research directions and potential clinical applications in the field of breast cancer diagnosis and treatment.
AUTHOR CONTRIBUTIONS
Conception and design: Hongling Liang. Development of methodology: Hongling Liang, Yumin Zhong, Jia Huang. Acquisition of data (acquired and managed patients, provided facilities, etc.): Hongling Liang, Jianqing Huang, Hongsheng Li, Hongxin Huang, Leyao Zhang, Xiang Ao, Hailin Zhao, Su Hu. Analysis and interpretation of data (e.g., statistical analysis, biostatistics, computational analysis): Hongling Liang, Xiang He, Jia Huang. Writing, review, and/or revision of the manuscript: Xiang He, Hongxin Huang, Hongling Liang. Administrative, or material support (i.e., reporting or organizing data, constructing databases): Hongling Liang, Jianqing Huang. Study supervision: Hongling Liang.
FUNDING INFORMATION
This work was supported by funds: Guangzhou S&T Project (No. 202102080096, HL Liang, and 201904010331, JQ Huang); Guangzhou S&T City and University United Project (No. 2023A03J0430, HL Liang); Project Natural Science Foundation of Guangdong Province (No. 2022A1515012376, JQ Huang); Guangdong Provincial Bureau of Education Project (No. 2021KTSCX091, HL Liang and 2020KTSCX105, JQ Huang); Guangzhou Health S&T Project (No. 20191A011097, HL Liang); Clinical Key Specialty Project of Guangzhou Medical University (No. 202005, HS Li).
CONFLICT OF INTEREST STATEMENT
The authors declare that there is no conflict of interest regarding the publication of this study.
Open Research
DATA AVAILABILITY STATEMENT
The datasets used and analyzed in this study are available from the corresponding author upon reasonable request.


