DNA barcoding and minibarcoding as a powerful tool for feather mite studies
Abstract
Feather mites (Astigmata: Analgoidea and Pterolichoidea) are among the most abundant and commonly occurring bird ectosymbionts. Basic questions on the ecology and evolution of feather mites remain unanswered because feather mite species identification is often only possible for adult males, and it is laborious even for specialized taxonomists, thus precluding large-scale identifications. Here, we tested DNA barcoding as a useful molecular tool to identify feather mites from passerine birds. Three hundred and sixty-one specimens of 72 species of feather mites from 68 species of European passerine birds from Russia and Spain were barcoded. The accuracy of barcoding and minibarcoding was tested. Moreover, threshold choice (a controversial issue in barcoding studies) was also explored in a new way, by calculating through simulations the effect of sampling effort (in species number and species composition) on threshold calculations. We found one 200-bp minibarcode region that showed the same accuracy as the full-length barcode (602 bp) and was surrounded by conserved regions potentially useful for group-specific degenerate primers. Species identification accuracy was perfect (100%) but decreased when singletons or species of the Proctophyllodes pinnatus group were included. In fact, barcoding confirmed previous taxonomic issues within the P. pinnatus group. Following an integrative taxonomy approach, we compared our barcode study with previous taxonomic knowledge on feather mites, discovering three new putative cryptic species and validating three previous morphologically different (but still undescribed) new species.
Introduction
Feather mites (Acari: Astigmata: Analgoidea and Pterolichoidea) are among the most abundant ectosymbionts living on birds (Gaud & Atyeo 1996; Proctor & Owens 2000; Proctor 2003). Among them, plumicolous mites are those living permanently on the feather surfaces of birds (Proctor 2003). In Europe alone, about 130 species of plumicolous feather mites (from 31 genera and 9 families) have been described on passerines, and a number of species have yet to be described (Mironov 1996; S. Mironov, personal observation).
Feather mites are present in almost all avian groups. However, there are many questions surrounding feather mite evolutionary ecology that remain unanswered (Proctor & Owens 2000; Proctor 2003). For example, it is still debated whether the nature of bird/feather mite relationships is parasitic, commensalistic or even mutualistic (Blanco et al. 2001; Figuerola et al. 2003; Galván et al. 2012). This controversy may stem from the fact that questions on feather mite ecology have been traditionally addressed by mainly correlating the combined abundance and prevalence of different mite species with host traits (e.g. Galván et al. 2012). However, we now know that the abundance of feather mites is not only shaped by host traits (e.g. body size, Galván et al. 2012; size of the uropygial gland, Galván & Sanz 2006), but also by the species composition of feather mites living on a bird (Fernández-González et al. 2013), or differently affecting feather mite species or even by environmental factors (Dubinin 1951; Fernández-González et al. 2013; Meléndez et al. 2014). Thus, it is clear that a greater knowledge of the feather mite community living on each bird species and on each bird individual would accelerate our understanding of the evolutionary ecology of this interaction.
This approach has rarely been addressed because feather mite species identification is a difficult task; females of some taxa and immature stages of many families are often indistinguishable, and even for males, accurate identification requires advanced taxonomic skills. Moreover, in some groups of closely related species (e.g. the pinnatus species group from the genus Proctophyllodes), it is extremely difficult to identify single individuals based on morphological characters (S. Mironov, personal observation). In this scenario, an accurate molecular tool for species identification would be highly valuable. In similar ecological systems, these problems have been successfully addressed by combining morphological and DNA barcoding approaches (i.e. integrative taxonomy approach), which has also been proposed as a powerful framework for species discovery and identification (Besansky et al. 2003; Smith et al. 2006; Hajibabaei et al. 2007; Schlick-Steiner et al. 2010).
On the other hand, species identifications based on barcoding do not work equally well in all groups, thus requiring a prior test of effectiveness before application to specific taxa (Moritz & Cicero 2004; Virgilio et al. 2012; Collins & Cruickshank 2013). This test requires an extensive barcoding library, which is not available for feather mites where only a few species (c. 20 sp) have been barcoded (Ratnasingham & Hebert 2007; Dabert et al. 2008, 2011; Jinbo et al. 2011; Glowska et al. 2014). However, the efficacy of barcoding has never been tested for feather mites.
DNA barcoding is based on amplifying and sequencing DNA regions that are informative at the species level. For several animal groups, the mitochondrial 648-bp region of the cytochrome oxidase subunit 1 (COI) gene has been demonstrated as a useful barcode (Hebert et al. 2003a,b; Savolainen et al. 2005; Hajibabaei et al. 2007). It has also proven effective in complex scenarios, even revealing cryptic species (Hebert et al. 2004). Here, we provide the largest library of DNA barcodes currently available for feather mites covering the majority of European passerine species, and we test the accuracy of the method. Moreover, we explored other issues around barcoding of feather mites relevant to their extended usability and confidence in addressing issues of molecular systematics:
- First, DNA barcodes of typical size (more than 600 bp) may be difficult to obtain with degraded DNA (e.g. museum specimens and dietary research) or may suffer technological restrictions. For instance, the more accurate and informative massive parallel sequencing technologies are currently limited to short DNA fragments. In these conditions, minibarcodes have proven to be very successful (Sundquist et al. 2007), so we identified potential minibarcodes for feather mites and explored their efficacy.
- The use of thresholds to differentiate species has been repeatedly discussed in the DNA barcoding literature, finding that no single threshold is optimal for all species (Puillandre et al. 2012; Virgilio et al. 2012; Collins & Cruickshank 2013). Moreover, the accuracy of a threshold-based approach critically depends upon the level of overlap between intra- and interspecific variation across a phylogeny (Meyer & Paulay 2005). Also, it is known that the overlap is considerably greater when a larger proportion of closely related taxa are included and that barcoding may perform poorly in incompletely sampled groups (Moritz & Cicero 2004; Ratnasingham & Hebert 2007). Therefore, here, we simulated the effect of library size (number of species) and species composition in the sample upon threshold calculation to test the robustness of our results against sampling issues.
- Finally, we tested the congruence of the barcode library of feather mites presented here with the previous taxonomic studies of feather mites. For this purpose, we followed an integrative taxonomy approach where we combined morphological identifications, automated procedures for primary species delimitation (Automatic Barcode Gap Discovery, ABGD) and Bayesian phylogenetic analyses (Huelsenbeck et al. 2001; Puillandre et al. 2012).
Materials and methods
Sampling
Feather mite specimens were collected during 2011–2013 from live birds captured with mist nets in different localities of Spain and Russia (Table S1, Supporting information). Mites were manually collected from the feathers using a flattened preparation needle or a cotton swab impregnated with ethanol and preserved at −20 °C in tubes with 96% ethanol. When possible, mite samples were taken from different geographical populations and from different host species, and one to five individuals from each putative mite species were sequenced (see below). After DNA isolation, mites were mounted on slides in Faure's medium according to standard techniques for small mites (Krantz & Walter 2009) and then identified by S.M. under a Zeiss AX10 light microscope. A total of 361 specimens were identified based on morphological characters according to world revisions of the genera Proctophyllodes (Atyeo & Braasch 1966) and Trouessartia (Santana 1976) and other corresponding taxonomic publications. The genus Proctophyllodes is the most species-rich genus (161 species) among feather mites, and the above-mentioned controversial pinnatus group is the most speciose within the genus, currently including 37 species (Mironov et al. 2012). Mites of this group are very uniform morphologically and differentiation of closely related species is mainly based on male characteristics. As morphological overlaps between species of this group have never been specifically studied, identification of species based on single specimens is often difficult. In this context, it is also possible that phylogenetically distant avian species described as hosts of, presumably, the same mite species actually harbour separate cryptic species. All mounted specimens were preserved at the Estación Biológica de Doñana (Spanish National Research Council, CSIC, Seville, Spain) with accession nos (EBD1201ART–EBD1561ART).
DNA isolation, amplification and sequencing
Genomic DNA was extracted using HotSHOT (Truett et al. 2000). After extraction, exoskeletons were separated from the extraction volume and stored in 96% ethanol. A segment of approximately 650 bp of the COI region was amplified by PCR with degenerate primers bcdF05 (5′-TTTTCTACH AAYCATAAAGATATTGC-3′) and bcdR04 (5′-TATAAACYTCDGGATGNCCAAAAAA-3′) (Dabert et al. 2008). PCRs were carried out in 20 μL reaction volumes containing 1× (NH4)2SO4 reaction buffer (Bioline), 2.5 mM MgCl2, 1× BSA, 0.25 mM DNTPs, 2 μm of each primer, 1.25 U BIOTAQ™ (Bioline) and 7 μL of DNA template. The reaction followed a touchdown PCR profile: 95 °C for 3 min, 20 cycles of 95 °C for 1 min, 55 °C for 30 s with a decrease of 0.5 °C every cycle, 72 °C for 1 min, and 20 cycles of 95 °C for 1 min, 45 °C for 30 s and 72 °C for 1 min, with a final extension step of 72 °C for 5 min. PCR products were quantitatively assessed by electrophoresis on a 2% agarose gel, and visible bands corresponding to the COI fragment size were sequenced in two directions. COI sequencing was carried out using the Sanger method and performed by Macrogen, Europe (Holland) and by Molecular Ecology Lab at the Estación Biológica de Doñana with bcdF05 and bcdR04 (Dabert et al. 2008).
Data analysis
Sequence editing and phylogenetic analyses
The forward and reverse DNA sequences were edited and manually trimmed to 602 bp using sequencher 5.2 software. Sequences were aligned using clustalw with default settings (Larkin et al. 2007) in Geneious (Drummond et al. 2009) and deposited in GenBank with the accession nos KP193464-KP193819. The final alignment was visually revised using mega (Tamura et al. 2013) and comprised 362 sequences including Freyana anatina (GenBank acc. no. GQ864352), as an outgroup taxon.
jmodeltest 2 (Darriba et al. 2012) was used to determine the appropriate model of sequence evolution for Bayesian analyses. Mr bayes version 3.2 (Ronquist et al. 2012) was used to run two parallel analyses each with GTR + G + I as the model of evolution, each consisting of four Markov chains of 4 000 000 generations. Convergence of each analysis was evaluated using tracer 1.4.1 (Rambaut & Drummond 2007) to check that ESS values were all >200 (default burn-in).
Barcoding analysis
Assessing specimen identification success
To assess barcoding accuracy in specimen identification, we used the genetic distances based on the ‘best close match’ (BCM) method presented by Meier et al. (2006). For the analyses, we used the bestCloseMatch function of the r package spider version 1.3–0 (http://spider.r-forge.r-project.org/) (Brown et al. 2012). BCM reports four different identification categories: (i) ‘correct’ when the name of the closest match is the same than the specimen considered; (ii) ‘incorrect’ when the name of the closest match is different than the specimen considered; (iii) ‘ambiguous’ when more than one species is the closest match; and (iv) ‘no id’ when no species is found within the given threshold. Thus, we obtained a metric of identification success calculated as the percentage of correct identifications. Following Collins et al. (2012), we considered singletons as a different identification scenario where the only possible identification result is ‘incorrect’ or ‘no id’. Therefore, we reported results with singleton species included and excluded. Finally, we also evaluated the performance of barcode sequences in species identification conducting a barcode gap analysis in BOLD (Ratnasingham & Hebert 2007).
Checking threshold confidence
For threshold calculations, the local minima function of the r package spider was used. It is based on the concept of the barcoding gap, where a dip in the density of genetic distances indicates the transition between intra- and interspecific distances.
As the identity of the species composition of the library may affect the threshold calculated, we explored whether and how our calculated threshold stabilized across a simulated increasing sample of species from our available library. To do so, for each possible sample size from 1 to 72 (the number of species in our library), we created 1000 random combinations of different species and calculated (with local minima function) the threshold for each subsample. Moreover, following Collins et al. (2012), we evaluated a range of threshold values for their effect on both the false-positive (α) and false-negative (β) error rates using threshold optimization function in the spider package. The optimum threshold was defined where cumulative errors were minimized.
Minibarcodes
The sliding window function slide analyses in spider (Brown et al. 2012) was used to determine the shortest informative window best discriminating the feather mite sequences of reference. This function extracts all possible windows (DNA sequences) of a chosen size in a DNA alignment and performs, for each window, distance measures including the following: (i) proportion of zero nonconspecific distances; (ii) number of diagnostic nucleotides; (iii) number of zero-length distances and overall mean distance; (iv) tree-based measures including the proportion of species that are monophyletic; and (v) the proportion of clades that are identical between the neighbour-joining tree calculated for the window and the tree calculated for the full data set.
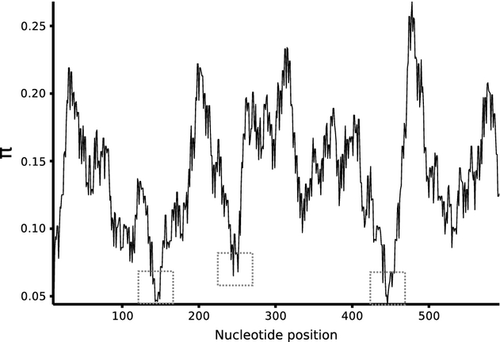
After this, the shortest informative window was selected by considering (following Boyer et al. 2012) the proportion of zero pairwise nonconspecific distances in the matrix, and the proportion of identical clades shared between the neighbour-joining tree derived from the full 602-bp data set (and those derived from each window). Windows with no zero nonconspecific distances and a proportion of identical clades >85% for shallow nodes (i.e. nodes tipwards of the median node depth) were considered as highly informative because they allow accurate specimen identification and provide a good representation of the tree topology for the full data set. Windows of 50, 100, 150 and 200 bp were analysed and compared to determine the shortest highly informative window. Then, identification success of each of the four most informative selected windows was also tested by BCM as was performed before for total length barcode. Tentative regions for group-specific degenerate primers were explored for the selected minibarcode, using nucleotide diversity analyses conducted on dnasp software (Librado & Rozas 2009).
Primary species delimitation
The ABGD method (Puillandre et al. 2012) was used with phylogenetic analyses to review the primary species discovery in our groups. This method uses many prior thresholds to propose partitioning of specimens into primary species hypotheses (PSHs) based on the distribution of pairwise genetic distances. In this distribution of pairwise differences between sequences, a gap exists between intraspecific and interspecific diversity. This ‘barcode gap’ can be used as a threshold for delimiting primary species under the consideration that individuals within species are more similar than those between species. The COI sequence alignment was used to compute matrices of pairwise distances using the Kimura-2-parameter (K2P) models with sppDistMatrix function in spider (Brown et al. 2012). Matrices were then used as inputs on the ABGD webpage (http://wwwabi.snv.jussieu.fr/public/abgd/abgdweb.html), using the default settings search on a set of prior minimum genetic distances ranging from 0.001 to 0.1. Lastly, ABGD output was visually compared with Bayesian phylogeny to check for congruence.
Additionally, we used the Refined Single Linkage (RESL) algorithm of BINs, which performs an initial analysis using a 2.2% sequence divergence as the minimum distance between clusters (Ratnasingham & Hebert 2013). BINs splits were also visually compared with ABGD partitions and Bayesian phylogeny to check for congruence.
Results
A total of 361 individual mites from 72 species and 12 genera were identified by morphology under the microscope, and their mitochondrial COI region was subsequently sequenced. All nucleotides were translated into functional protein sequences in the correct reading frame, with no stop codons or indels observed in the data. Each species was represented by five individuals on average; 20 species (27.3%) had only one individual (i.e. singletons; see other sample statistics in Table 1).
| Individuals | 361 |
| Species | 72 |
| Mean individuals per sp. (range) | 5 (1–22) |
| Singletons | 20 |
| Genera | 12 |
| Seq. length (bp) | 602 |
| Number of haplotypes | 319 |
| Haplotype gene diversity | 0.998 |
| Mean intraspecific distances (range, SD) | 2% (0–11, 2.04) |
| Mean smallest interspecific distances (range, SD) | 9% (0–22, 4.83) |
Identification success rates using DNA barcodes
Using BCM, identification success was usually high (>88%) when singletons were excluded and perfect when both the pinnatus group and the singletons were excluded. ‘ambiguous’ identifications increased mainly when the pinnatus group was included in the analyses (Table 2). The same pattern was observed when the barcoding gap analysis in BOLD was used. All species from the pinnatus group always presented nearest neighbour values smaller than the corresponding maximum intraspecific distances. Singleton species always resulted in nearest neighbour distances above the threshold (3.42%, see below), thus reporting ‘no id’ in the analyses.
| Singletons | pinnatus group | Correct | Incorrect | Ambiguous | No id | n |
|---|---|---|---|---|---|---|
| Included | Included | 83 | 3 | 8 | 6 | 361 |
| Excluded | Included | 88 | 4 | 8 | 0 | 342 |
| Included | Excluded | 93 | 0 | 0 | 7 | 300 |
| Excluded | Excluded | 100 | 0 | 0 | 0 | 281 |
| Window length (bp) | Window location (first nucleotide) | Proportion of identical clades shared |
|---|---|---|
| 50 | 259 | 0.94 |
| 100 | 286 | 0.96 |
| 150 | 283 | 0.96 |
| 200 | 295 | 0.97 |
Threshold confidence and accuracy
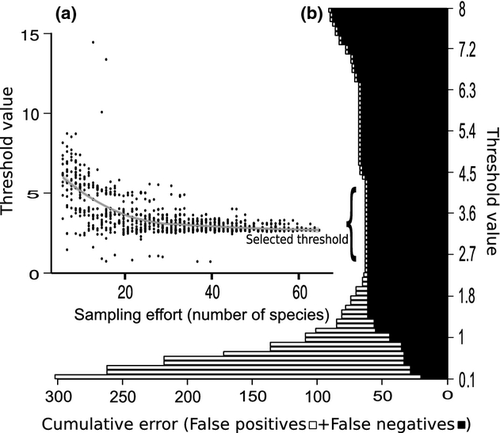
We obtained a threshold value of 3.42%, which remained the same after threshold optimization (Fig. 1). Our simulations (see ‘2.4.2’) showed that the threshold stabilized at around 30 mite species, well before reaching the 72 species of our whole data set, thus suggesting that additional sampling would not significantly change the threshold for feather mites of European passerine birds (Fig. 1).
Minibarcodes
Sliding window analyses revealed short informative regions from 50 to 200 bp (Table 3). For the four differently sized windows (one per window length), the proportion of zero pairwise nonconspecific distances was 0. Therefore, the criteria with which to choose the best windows were the proportion of identical clades shared between the neighbour-joining tree derived from the full-length data set and those derived from each window. After BCM analyses of all sized best windows, a 200-bp window (located from 295 to 495 bp in our alignment) was the only minibarcode to obtain exactly the same identification success as the total length barcode. Moreover, this region was surrounded by conserved regions (Fig. 2), thus being potentially useful to design group-specific degenerate primers.
Integrative taxonomy
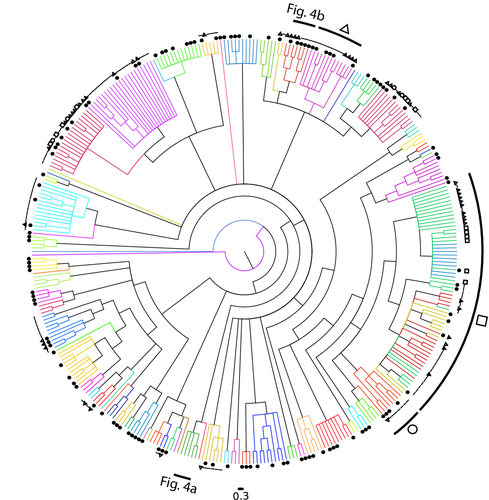
DNA barcoding was robust when comparing feather mites of the same species sampled at distant locations (Russia vs. Spain) or the same mite species from different bird hosts (Fig. 3). However, our phylogenetic, RESL and ABGD analyses showed a strong genetic structure of two clusters within three Proctophyllodes species: P. musicus, P. stylifer and P. clavatus. In two of these species, clusters within mite species occurred in different but closely related bird species: Turdus merula and Turdus philomelos on P. musicus (Figs 3, 4a and S1, Supporting information), and Parus major and Cyanistes caeruleus on P. stylifer (Figs 3 and S1, Supporting information). A similar situation occurred in P. clavatus, with a cluster with a single individual found on Acrocephalus schoenobaenus, while the rest of the P. clavatus were found on Sylvia borin. In this case, the individual on A. schoenobaenus was even closer to Proctophyllodes cetti than to the other P. clavatus (Figs 3 and S1, Supporting information). In all three cases, evidence thus suggests that these may be morphologically cryptic mite species living on different (but closely related) bird hosts.
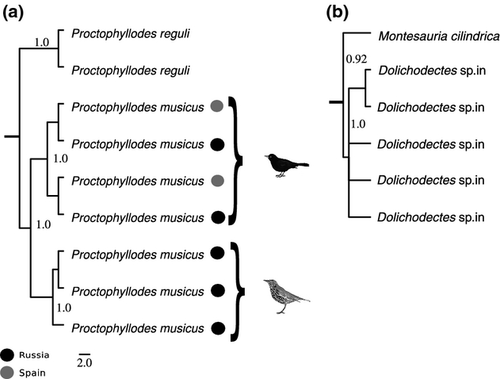
Moreover, our phylogenetic analyses supports the hypothesis that three previously undescribed mite species, recognized by morphology (S. Mironov, personal observation), do belong to distinct species, because they show well-isolated clusters in our phylogeny. Two species (from the genera Proctophyllodes and Mesalgoides) were from the red crossbill, Loxia curvirostra, and one from the genus Dolichodectes was hosted on the melodious warbler Hippolais polyglotta (Figs 4b and S1, Supporting information).
Discussion
Here, we found a high identification success (100% without singletons and the conflictive pinnatus group) using BCM (Meier et al. 2006) for our feather mite library, as previously reported in other arthropod barcoding studies (Virgilio et al. 2010). Contrary to other DNA barcoding studies, in which COI showed high genetic structure between populations within species (Tavares et al. 2011), our results showed high robustness with no geographical genetic structure for our marker, despite the fact that we sequenced the same feather mite species from distant populations of European passerines and the same mite species inhabiting different bird hosts. Previous studies using COI in taxonomical studies of particular feather mite species have reported low intraspecific and higher interspecific genetic distances (Dabert et al. 2008, 2011; Jinbo et al. 2011; Glowska et al. 2014) suggesting its usefulness for species identification. Here, we extend current information providing the largest library of barcodes for feather mites, and our analyses of this library confirm that the COI region is useful for species identification in this group.
Most of the current popular massive parallel sequencing tools (Illumina, Ion Torrent, etc.) have important benefits but also some constraints, such as the limited length of the sequences (Mardis 2011). In this context, minibarcodes have been presented as a good option for specimen identification in DNA barcoding (Meusnier et al. 2008). In this work, as reported for fish and butterflies (Hajibabaei et al. 2006), we obtained the same identification success with a short region of 200 bp and present it as a tentative minibarcode region for feather mites. Thus, at least for feather mite species identification, minibarcodes may be a useful tool.
Choosing appropriate thresholds that can separate species is one of the main challenges and concerns for DNA barcoding studies (Ferguson 2002). This is the basis of important criticisms of barcoding methods, which state that single-gene thresholds for species discovery can result in substantial errors in detecting new species with recent divergence times. Our innovative approach to the assessment of the threshold stability within a barcoding library may help discern when a threshold is usable for a certain group. It may be considered that the early stabilization confers a measure of confidence in the calculated threshold for a particular sampled group. In our library, we achieved a high threshold stabilization at a level of 30 species (<50% of total library). Moreover, species composition had a small impact on the final threshold obtained. This threshold was 3.14%, interestingly close to the 3% commonly used in barcoding literature (Hebert et al. 2003a,b). Nevertheless, it is important to note that for threshold calculations, we used the local minima function of the r package spider (Brown et al. 2012). This is based on the concept of the barcoding gap, which has been proven to be very effective in some groups (as reported here for feather mites) but not in others (Čandek & Kuntner 2014). Therefore, these simulations may be sensitive to the same benefits (easy to calculate, easy to interpret and very repeatable among different groups) and problems (mainly overlaps between intra- and interdistances in some groups) as the barcoding gap approach (Wiemers & Fiedler 2007; Čandek & Kuntner 2014).
The pinnatus group is composed of species highly similar in morphology and is the most diverse species group in the Proctophyllodes genus (Atyeo & Braasch 1966), thus suggesting a recent and rapid diversification. Our analyses confirmed previous suspicions of taxonomic issues within this group, thus encouraging further additions of new markers and integrated taxonomic approaches, likely leading to a reconsideration of current taxonomic descriptions and hopefully identification improvements thanks to a multilocus barcoding approach (Dupuis et al. 2012).
The tree inferred from barcoding data (Fig. S1, Supporting information) confirmed most of the taxonomies of the relationships of the investigated taxa. The barcoding served as most precise tool for revealing relationships of feather mites at specific and generic levels. This method allowed the clear differentiation of most mite species. It is important to note that these data revealed the (genetic) homogeneity of a mite population of a particular species associated with a particular passerine species within the limits of Europe. On the other hand, these data allowed the detection of supposedly cryptic species inhabiting different hosts in the same territory.
With respect to species discovery, we also used an integrative taxonomy approach, with a single-gene analysis from ‘DNA barcoding’ and a morphological study to determine species hypotheses (Schlick-Steiner et al. 2010). The single-gene data set was analysed with bioinformatic species delimitation tools, such as ABGD or RESL and contrasted with phylogenetic trees (Puillandre et al. 2012; Ratnasingham & Hebert 2013; Roy et al. 2014). This was useful to confirm the existence of three undescribed species and to discover three likely cases of cryptic species within three morphologically recognized Proctophyllodes species (P. musicus, P. stylifer and P. clavatus), each associated with a pair of closely related host species. Interestingly, one of these cases (P. stylifer) was also reported in an independent study by Dabert et al. (2005), thus giving further support to the hypothesis that P. stylifer may be composed of at least two cryptic species. In P. clavatus, a cluster with the single mite individual sampled from Acrocephalus shoenobaenus is clearly distant from the rest of the P. clavatus mites sampled from S. borin hosts, but is distinctly closer to P. cetti sequences. P. clavatus and P. cetti show very similar morphology. Association of P. clavatus with A. schoenobaenus is not accidental, as it was previously recorded by other authors (Atyeo & Braasch 1966). All of these cases of potentially cryptic species require further study.
Acknowledgements
Funding was provided by the Ministry of Economy and Competitiveness (Ramón y Cajal research contract RYC-2009-03967 to RJ and research project CGL2011-24466 to RJ). JD was also supported by the Ministry of Economy and Competitiveness (SVP-2013-067939). SV was supported for this study by the Russian Foundation for Basic Research (Grant no. 13-04-00608a). The authors thank three anonymous reviewers for suggesting improvements to earlier version of the manuscript. Special thanks to: Miroslawa Dabert for her advice on lab protocols; Rupert A. Collins for his recommendations on the barcoding analysis; Nicolas Puillandre for advice and instructions on ABGD and barcoding interpretation of our results. Francisco Jesus Ruiz Ruano for his help with phylogenetic analyses; and Carolina Osuna for her advice and phylogenetic tree illustrations. Special thanks also to Carlos M. Herrera for his logistic support. We thank Alberto Alvarez, Leandro Meléndez, Marc Llobet, Pepe Ayala, RaülAymí, Pere Josa Anguera and Rafael Sanchez for the samples provided.
References
J.D., J.D.-R., S.M., D.S. and R.J. conceived and designed the study. J.D.-R., S.M., D.S. and R.J. collected samples from the field. J.D.-R., P.B. and R.J. designed and performed the laboratory work. J.D. and J.D.-R. analysed the data. J.D., J.D.-R., S.M., P.B., D.S. and R.J. wrote the manuscript.
Data Accessibility
All sequences have been deposited in GenBank, and accession nos for the barcodes, specimens and collection data are available within the ‘Feather mites of European passerines project file (FMEP) in BOLD (http://www.barcodinglife.org), DOI: 10.5883/DS-771988. Sequence alignment deposited in Dryad: DOI:10.5061/dryad.34702. Phylogenetic data: treebase Study ID S16661. The r code used for simulation is available on the GitHub repository: http://github.com/Jorge-Dona/Barcoding.git.


