Single-nucleus transcriptomics and chromatin accessibility analysis of musk gland development in Chinese forest musk deer (Moschus berezovskii)
Abstract
Musk secreted by male forest musk deer (Moschus berezovskii) musk glands is an invaluable component of medicine and perfume. Musk secretion depends on musk gland maturation; however, the mechanism of its development remains elusive. Herein, using single cell multiome ATAC + gene expression coupled with several bioinformatic analyses, a dynamic transcriptional cell atlas of musk gland development was revealed, and key genes and transcription factors affecting its development were determined. Twelve cell types, including two different types of acinar cells (Clusters 0 and 10) were identified. Single-nucleus RNA and single-nucleus ATAC sequencing analyses revealed that seven core target genes associated with musk secretion (Hsd17b2, Acacb, Lss, Vapa, Aldh16a1, Aldh7a1, and Sqle) were regulated by 12 core transcription factors (FOXO1, CUX2, RORA, RUNX1, KLF6, MGA, NFIC, FOXO3, ETV5, NR3C1, HSF4, and MITF) during the development of Cluster 0 acinar cells. Kyoto Encyclopedia of Genes and Genomes enrichment showed significant changes in the pathways associated with musk secretion during acinar cell development. Gene set variation analysis also revealed that certain pathways associated with musk secretion were enriched in 6-year-old acinar cells. A gene co-expression network was constructed during acinar cell development to provide a precise understanding of the connections between transcription factors, genes, and pathways. Finally, intercellular communication analysis showed that intercellular communication is involved in musk gland development. This study provides crucial insights into the changes and key factors underlying musk gland development, which serve as valuable resources for studying musk secretion mechanisms and promoting the protection of this endangered species.
INTRODUCTION
The Chinese forest musk deer (FMD; Moschus berezovskii) is an artiodactyl mammal primarily distributed in Asia (Yang et al. 2003). Male FMD have musk glands between their navels and genitals that secrete musk, which has a unique fragrance, significant anti-inflammatory and antitumor properties, and an important impact on the human central nervous system and cardio–cerebral–vascular system (He et al. 2014). Musk has long been a vital component of traditional Chinese medicine and perfume production (Cao & Zhou 2007; Feng & Liu 2015). In recent decades, the number of wild FMD has rapidly decreased owing to overexploitation, habitat destruction, and degradation (Yang et al. 2003). Since the 1950s, artificial breeding technology has been applied to FMD in China for conservation purposes (Shrestha 1998). However, the current FMD population is far from sufficient to meet the significant demand for musk (Wang & Ha 2018). Therefore, enhancing our understanding of musk glands and finding ways to increase musk yield are important.
The musk gland is a unique organ that remains obscure in the field of biology. However, it has recently gained attention in the research community. The small RNA transcriptomes of unmated and mated male FMD musk glands were sequenced to reveal that miRNA–mRNA pairs (miR-21: Chd7, miR143: Hsd17b7, and miR-141/200a: Noc2) may be involved in musk gland development and secretion (Jie et al. 2021). Transcriptome sequencing of the musk gland and testis of male FMD suggested that the musk gland may synthesize steroid hormones (including androgens) (Yang et al. 2021) and that in the heart and musk gland tissues, steroid compounds (cholestanol, cholesterol, ketones, and numerous androstane derivatives) were active (Xu et al. 2017). However, the transcriptional cascade of musk gland development has not yet been fully elucidated. From a developmental biology perspective, the musk glands develop during sexual and somatic maturity. Before sexual maturity (1 year old), the acinar cells in the musk glands are immature, and male FMD cannot secrete musk. After somatic maturity (2.5 years old), the acinar cells in the musk glands are fully developed, and male FMD secrete abundant musk (Zhao et al. 2009; Zhou 2012; Zheng et al. 2021). Therefore, acinar cell maturation is necessary for musk secretion in FMD, and studying their development is important to understand musk gland development.
Single-nucleus RNA sequencing (snRNA-seq) in animal systems has demonstrated that the nucleus can be used to establish biologically meaningful transcriptomic information compared to isolated cells (Bakken et al. 2018; Hu et al. 2018). Single-cell RNA sequencing (scRNA-seq) is a high-throughput technology used to quantify the gene expression profiles of cell populations. It can identify cell-type diversity, reflect intercellular heterogeneity, and provide a systematic and comprehensive understanding of cell fate and regulatory programs of specific tissues (Carter et al. 2018). However, scRNA-seq cannot measure cellular identity, which is strongly influenced by cellular epigenetic wiring (Pervolarakis et al. 2020). These features can be investigated using single-nucleus ATAC sequencing (snATAC-seq) to reconstruct the cis/trans-regulatory elements associated with cellular identity (Buenrostro et al. 2015). snATAC-seq uses Tn5 transposase to cleave open chromatin regions and adds sequencing primers for high-throughput sequencing to study open chromatin regions at the single-cell level. In animal science, scRNA-seq and snATAC-seq have been used to study various biological processes (Buenrostro et al. 2018; Norrie et al. 2019; Zhou et al. 2019). Recently, single cell multiome ATAC + gene expression has received increasing attention because it yields both transcriptomic and epigenomic information from a cell. This maximizes data acquisition from limited samples to better reveal the complex interactions between regulatory elements, open chromatin, and gene expression (Trevino et al. 2021).
This study revealed the dynamic transcriptional cell atlas of musk gland development and elucidated the genes and transcription factors (TFs) that affect this development using single cell multiome ATAC + gene expression. Our findings provide valuable information for future research on the mechanisms of musk secretion.
MATERIALS AND METHODS
Ethics statement
The experimental design and procedures were approved by the Animal Care and Use Committee of Northwest A&F University (Shaanxi, China) (A20210816).
Sample preparation
The captive FMD used in this study were raised at Shenglinyuan Biotechnology Co., Ltd. in Fengxian County, Shaanxi Province, China. Musk gland tissues were obtained from 6-month-old and 6-year-old male FMD in the non-musk secretory period, both of whom died of hairball disease. The musk glands were washed with phosphate buffer saline and placed in a culture dish. Most of the musk glands were cut into 1 mm3 pieces and immediately placed in liquid nitrogen. The rest of the glands were cut into 1 and 2 mm3 pieces and fixed in paraformaldehyde and in situ hybridization fix solutions, respectively (Servicebio, Wuhan, China).
Hematoxylin and eosin staining
Following overnight fixation in paraformaldehyde, musk gland tissues were dehydrated in an ethanol solution and further incubated with xylene for 30 min. Subsequently, musk gland tissues were embedded in paraffin blocks that were cut at a thickness of 4 μm. The sections were transferred to clean slides for hematoxylin and eosin (H&E) staining, and the slides were deparaffinized in xylene for 40 min and hydrated in an ethanol series. The hydrated slides were incubated in a hematoxylin solution and washed with tap water. The slides were differentiated with 1% hydrochloric acid–ethanol, stained blue with 0.6% ammonia, and then stained with eosin. Finally, the slides were mounted with neutral resin after rinsing with absolute ethanol.
Preparation of single-nucleus suspension
For each sample, 500 μL of precooled lysis buffer was used to lyse the musk gland tissues, and a rubber grinding rod was used to vertically press them. Then, 700 μL of nuclei washing buffer was added, and the tissue homogenate was filtered through a 70-μm cell strainer (Corning, New York, USA) to obtain approximately 1 mL of filtrate. Subsequently, 1 mL of 50% iodixanol was added to the filtrate, and a gradient solution was prepared using 1 mL of 33% iodixanol and 2 mL of 30% iodixanol. Next, 2 mL of iodixanol solution containing nuclei was added to the liquid surface of 30% iodixanol. Following centrifugation, the white nuclei layer was transferred to a new 15-mL centrifuge tube, and nuclei washing buffer was added to resuspend the nuclei. The mixture was centrifuged, and the precipitate was resuspended in the nuclei-washing buffer. After several repetitions, the nucleus suspension was filtered through a 40-μm cell strainer (Corning, New York, USA). After further centrifugation, diluted nuclei buffer was added to resuspend the nuclei precipitate, and the nucleus suspension stained with trypan blue was detected using a microscopic cell-counting plate.
Library construction and sequencing
The single-nucleus suspension and transposase mixture were mixed and incubated according to the manufacturer's instructions (10 × Genomics, Chromium Next GEM Single Cell Multiome ATAC + Gene Expression, protocol CG000338). After entering the nucleus, the transposase preferentially fragmented DNA in the open regions of the chromatin, and sequencing primers were added to the ends of the DNA fragments. A mixed solution of nuclei and enzymes was loaded onto a Chromium Controller (10 × Genomics) to generate Gel Bead-in-emulsions (GEMs).
For the gene expression library, poly(dT) sequences were used to capture pre-mRNA and mature mRNA. After adding labels, the GEMs' structure was ruptured, all cDNA was mixed, and cDNA was amplified using PCR for library construction. P5, P7, the sample index, and sequencing primers were included during the construction of the RNA library by fragmentation, end repair, A-tail addition, ligation, and PCR. For the ATAC library, spacer sequences were used to capture labeled DNA fragments. Then, the GEMs' structure was ruptured, all dsDNA was mixed, and DNA was amplified using PCR for library construction. P7 and the sample index were analyzed using PCR during the construction of the ATAC library. Finally, the resulting libraries were sequenced using an Illumina NovaSeq 6000 sequencing system.
Multiome data processing
Cell Ranger ARC (version 2.0.1) (https://support.10xgenomics.com/single-cell-multiome-atac-gex/software/pipelines/latest/what-is-cell-ranger-arc) from 10 × Genomics was used for quality control of the raw data. For snRNA-seq data, the Cell Ranger ARC first pruned the reads to remove the TSO and poly(A) sequences. Spliced Transcripts Alignment to a Reference (STAR) (version 2.7.10) (https://github.com/alexdobin/STAR) was used to align Read2 with the reference genome (https://www.ncbi.nlm.nih.gov/bioproject/PRJNA317652/) (Dobin et al. 2013). Regarding snATAC-seq data, Cell Ranger ARC first pruned the reads to remove adaptor and primer sequences. BWA-MEM (version 2.2.1) (https://github.com/bwa-mem2/bwa-mem2) was used to align read pairs to the reference genome (Li 2013). Duplication analysis was used to identify reads with unique alignments, and MAPQ > 30 was used for subsequent analyses. The Unique Molecular Identifiers (UMIs) were filtered and corrected using Cell Ranger ARC, which was employed to identify peaks. After filtering the barcodes by combining the single-nucleus RNA and ATAC data, the final effective cell population was formed.
Cell-type clustering and differential expression gene analysis
Seurat (version 3.0.2) (https://github.com/satijalab/seurat/releases) was used for downstream analysis and visualization (Butler et al. 2018). Particularly, Seurat filtered abnormal cells to retain high-quality cells. The filtering indicators included the number of genes identified (between 200 and 3800) and the total number of UMIs in a single cell (<14 000). For the same type of cell, the number of expressed genes was maintained within a certain range. If the value was too high, multiple cell types were probably wrapped in one GEM, and such barcodes were removed. If the total number of UMIs was too high, two or more cells may have entered the same GEM, and such cells were removed. The clean data were normalized using the LogNormalize function. Seurat reduced the dimensionalities of snRNA-seq and snATAC-seq data using principal component analysis (Chung & Storey 2015) and latent semantic index (Deerwester et al. 1990), respectively. The batch effect correction was performed using a harmony algorithm (Korsunsky et al. 2019), and Seurat constructed a weighted-nearest neighbor (WNN) map based on gene expression levels and chromatin openness (Hao et al. 2021). Finally, the Louvain algorithm was used to cluster the cells based on the WNN map (Rotta & Noack 2011).
The FindAllMarkers function implemented in Seurat was used to identify differentially expressed genes (DEGs) between the different clusters. The Wilcoxon test was performed for each gene, and the gene filtering criteria were as follows: (1) P ≤ 0.01; (2) at least |log2FC| ≥ 0.36 between two groups; and (3) the proportion of cells expressing the gene in the target cluster or control cluster > 25%.
Differential gene analysis between samples
Based on the cell type and sample information to which the cell belongs, Seurat's Wilcoxon rank sum test was used to find DEGs between different samples in a cell type according to the following criteria: (1) P ≤ 0.01; (2) at least |log2FC| ≥ 0.36 between two samples; and (3) the proportion of cells expressing the gene in any sample > 25%.
Single-nucleus RNA and ATAC association analysis
The peak was annotated as proximal (0–2 kb upstream of the gene) or distal (2–100 kb upstream of the gene), depending on its position relative to the gene. Seurat's Wilcoxon rank sum test was used to determine differential peaks between different samples in a cell type according to the following criteria: (1) P ≤ 0.01; (2) at least |log2FC| ≥ 0.36 between two samples; and (3) the proportion of cells that detected the peak in any sample > 25%. Subsequently, the upregulated peaks in the samples were subjected to motif enrichment analysis. TF motif information from the JASPAR database (version 2022) (http://jaspar.genereg.net/) was used to identify TFs (Castro-Mondragon et al. 2022).
Seurat was used to correlate the snRNA-seq and snATAC-seq data. Candidate target genes were those that were upregulated in the snRNA-seq data and whose proximal and distal chromatin accessibility changed in the snATAC-seq data. These genes might also be regulated by chromatin accessibility. Candidate target genes were divided into proximal and distal candidate target genes according to the positions of the target genes annotated by peaks. Candidate TFs were upregulated during development and whose corresponding motifs were enriched in the upregulated peaks. These TFs may also be involved in transcriptional regulation. Moreover, the candidate TFs were divided into proximal and distal candidate TFs according to the positions of the target genes annotated by the peaks of enriched TF motifs. Candidate target genes and TFs were linked by peaks to obtain core target genes and TFs. Core TFs could bind to peaks that could regulate core target genes, thereby forming a regulatory network.
Weighted gene co-expression network analysis
The weighted gene co-expression network analysis (WGCNA) package (version 1.71) (https://rdocumentation.org/packages/WGCNA/versions/1.71) was used to construct co-expression networks (Langfelder & Horvath 2008). After filtering the genes, gene expression values were entered into WGCNA to create co-expression modules. The expression correlation coefficients of the remaining genes were calculated to determine the appropriate soft threshold for creating gene networks using a scale-free topology model. Correlations between modules as well as between modules and genes were also calculated by WGCNA. Subsequently, the module eigenvalues were used to identify the modules associated with the target cell clusters. For the genes in the target module, eggNOG-mapper (version 2.1.4) (eggnog-mapper.embl.de) was used for Gene Ontology (GO) enrichment analysis to analyze the biological function of the module (Cantalapiedra et al. 2021). Furthermore, the predicted protein sequences were aligned with AnimalTFDB (version 3.0) (http://bioinfo.life.hust.edu.cn/AnimalTFDB/) using hmmscan to obtain the TFs (Hu et al. 2019). Finally, Cytoscape (version 3.3.0) (https://cytoscape.org/release_notes_3_3_0.html) was used to visualize the regulatory network (Shannon et al. 2003).
Cell communication analysis
To infer intercellular communication, the CellChat R package (version 1.1.3) (https://github.com/sqjin/CellChat) was used to evaluate the mode of intercellular communication across biological time from multiple aspects. CellChat integrates ligand–receptor pair information from the Kyoto Encyclopedia of Genes and Genomes (KEGG) database and related literature to construct a comprehensive signaling molecule interaction database (CellChatDB, http://www.cellchat.org/) that considers the known structural composition ofligand–receptor interactions, such as multimericligand–receptor complexes, soluble agonists, and antagonists, as well as stimulatory and inhibitory membrane-bound co-receptors. These ligand–receptor pairs also belong to different pathway types. CellChat analysis uses the gene expression data of cells as input and establishes the probability of cell–cell communication by integrating prior knowledge of the interactions between gene expression and signal ligands, receptors, and their cofactors, thereby predicting intercellular communication (Jin et al. 2021). The ggplot2 R package (version 3.3.6) (https://github.com/tidyverse/ggplot2/releases) was used to visualize the ligand–receptor network. In this study, we mapped ligand–receptor pairs at different developmental stages to investigate the differences in intercellular communication during development.
Gene enrichment analysis
eggNOG-mapper (version 2.1.9) (http://eggnog-mapper.embl.de) was used for the GO and KEGG enrichment analysis (Cantalapiedra et al. 2021). Using the KEGG database, we applied gene set variation analysis (GSVA) (version 3.17) (https://bioconductor.org/packages/GSVA) to score the established pathways between different samples of Clusters 0 and 10 (Hänzelmann et al. 2013).
In situ hybridization analysis and immunohistochemical staining
Musk gland tissues were fixed with an in situ hybridization fixing solution, embedded in paraffin, and sectioned. The slides were deparaffinized in xylene solution and incubated with protease K (20 μg mL−1). Then, 3% methanol–H2O2 was used to block endogenous peroxidases, and probes for one of the target mRNAs were hybridized to the slides. After washing off the hybridization solution with Saline Sodium Citrate (SSC), the hybridization solution that contained two-labeled probes, anti-DIG-HRP, and FITC-TSA reagent were sequentially added. Then, probes for another target mRNAs were hybridized to the slides. After washing off the hybridization solution, the hybridization solution that contained three-labeled probes, anti-DIG-HRP, and CY3-TSA reagent were added. Finally, DAPI was added, and the slides were mounted with an anti-fade mounting medium. The probes are listed in Table S1, Supporting Information.
Immunohistochemical analyses were performed on paraformaldehyde-fixed, paraffin-embedded musk gland tissue sections. Briefly, slides were deparaffinized, hydrated, and antigen-repaired and then incubated in a 3% hydrogen peroxide (H2O2) solution to block endogenous peroxidase activity. The slides were blocked with 3% BSA and incubated with the primary antibody overnight at 4°C. The slides were then incubated with a secondary antibody for 50 min. The DAB solution was used for chromogenic detection. The slides were counterstained with hematoxylin for 3 min, differentiated with hematoxylin differentiation solution, and returned to blue with a hematoxylin blue-returning solution. Dehydration and transparency were performed by gradually introducing 75–100% ethanol (5 min each) and xylene. Finally, the slides were sealed with sealing glue. The antibodies used are listed in Table S1, Supporting Information.
RESULTS
Identification of cellular heterogeneity during musk gland development
Musk glands were dissected before sexual maturity (6 months) and after somatic maturity (6 years) (Fig. 1a). Histological examination showed major changes in morphology along this timeline. In the 6-month-old musk gland, the acinar lumen comprised cubic or short columnar cells, with a large lumen and sparse acinar distribution. However, in the 6-year-old musk gland, the acinar lumen was small, and the acinar cells were tightly arranged in a ring (Fig. 1b). To characterize the molecular features accompanying this developmental progression, we isolated single nuclei from musk gland tissues and performed single cell multiome ATAC + gene expression analysis using the 10 × Genomics platform (Fig. 1a). After quality filtering, we detected 19 283 genes and 89 233 peaks in the 6-month-old musk gland and 20 931 genes and 108 825 peaks in the 6-year-old musk gland. After removing low-quality nuclei, we obtained 18 701 total single-nuclei transcriptome profiles from 6-month-old and 6-year-old musk gland nuclei (2050 and 16 651 single nuclei, respectively) (Fig. 1c; Fig. S1a–d, Supporting Information). In general, the Pearson correlation coefficient between the average gene openness (snATAC-seq) and average gene expression (snRNA-seq) of the two samples was 0.46 (Fig. S1e, Supporting Information).
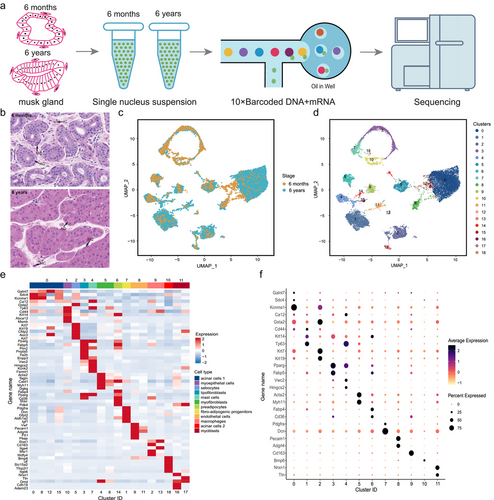
We performed UMAP analysis on all single nuclei (Fig. S2a,b, Supporting Information), which identified 19 cell clusters based on their gene expression profiles (Fig. 1d). To further characterize the cell clusters, we calculated the DEGs in each cluster compared to all other clusters (Table S2, Supporting Information). We then created a heatmap of known cell marker genes and top DEGs for each cluster and used a series of known markers to identify individual clusters (Fig. 1e,f). The marker genes were selected based on known annotations in the literature. Consistent with previous studies, 12 cell types were identified (Fig. 2a; Table S3, Supporting Information) (Liu et al. 2023). Clusters 0, 8, 12, and 15 were acinar cells 1 that expressed high levels of the Galnt7, Ca12, and Kcnma1 markers (Li et al. 2016). Cluster 10 consisted of myoepithelial cells with high expressions of Cd44, Krt14, and Tp63 (Indumathi et al. 2013; Wood et al. 2016). Cluster 5 contained sebocytes with high expressions of Krt7 and Krt19 (Zouboulis et al. 1991). Cluster 3 consisted of lipofibroblasts with enriched expressions of lipofibroblast markers (Pparg, Fabp5, and Plin2) (Xie et al. 2018). Cluster 7 consisted of mast cells with enriched expressions of mast cell markers (Vwc2 and Hmgcs2) (Young et al. 2018). Clusters 4 and 6 contained myofibroblasts that expressed high levels of Acta2 and Myh11 (Hsia et al. 2016; Guerrero-Juarez et al. 2019). Cluster 14 contained pre-adipocytes with high expressions of Fabp4, Pparg, and Cd36 (Hu & Yang 2020). Cluster 1 comprised fibroadipogenic progenitors with enriched expressions of Pdgfra and Dcn (Giordani et al. 2019). Clusters 9 and 11 consisted of endothelial cells with enriched expressions of Vwf, Pecam1, and Adgrl4 (Park et al. 2018; He et al. 2020). Clusters 2 and 13 contained macrophages with enriched expressions of macrophage markers (Stat1 and Cd163) (Christmann et al. 2014; Ma et al. 2020). Cluster 18 comprised acinar cells 2 with a high expression of Bmp6 (Heikinheimo et al. 1999). Clusters 16 and 17 contained myoblasts that expressed high levels of Nrxn1 and Ttn (Zeng et al. 2016; Li 2020).
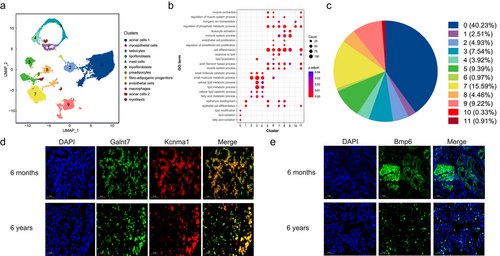
We performed a GO enrichment analysis of the inferred cell types. The results showed that fatty acid oxidation, lipid oxidation, as well as lipid modification pathways were primarily enriched in acinar cells 1. These results are because lipids and fatty acids are the primary components of musk, which is consistent with musk secretion function. Regulation of phosphate metabolic process and inorganic ion homeostasis pathways were enriched in acinar cells 2, which was in good agreement with the fact that inorganic salts are the primary components of musk, in line with its musk secretion function (Fig. 2b; Table S4, Supporting Information). We also examined the relative proportion of each major musk gland cell type contributing to the dataset. As expected, the acinar cell content was the highest, accounting for 40.56% of all cells (Fig. 2c). To further confirm the acinar cells, we performed fluorescence in situ hybridization on 6-month-old and 6-year-old musk gland sections. The results showed that Galnt7 and Kcnma1 were expressed in Cluster 0, whereas Bmp6 was expressed in Cluster 10 (Fig. 2d,e). In addition, in the 6-month-old and 7-year-old samples, Cluster 0 (acinar cells 1) accounted for the largest proportion at 26.93% and 41.87%, respectively (Fig. S2c, Supporting Information). Notably, all clusters comprised nuclei from different developmental periods (Fig. S2d, Supporting Information).
Single cell multiome ATAC + gene expression during Cluster 0 acinar cell development
We calculated the DEGs between the different developmental stages of Cluster 0 acinar cells to further elucidate their developmental process (Table S5, Supporting Information). During Cluster 0 development, we identified 543 upregulated and 877 downregulated genes (Fig. 3a). Moreover, we found that propanoate metabolism-related genes, such as Acaca, Pccb, Ehhadh, and Acss3, and fatty acid metabolism-related genes, such as Elovl6, Acsl1, Elovl1, and Acadl, significantly changed during development (Fig. 3b). Consistent with these results, we observed significant enrichment of propanoate and fatty acid metabolism during Cluster 0 development (Fig. 3c; Table S6, Supporting Information). To investigate the functional heterogeneity of Cluster 0 acinar cells at different developmental stages, we scored the KEGG pathways related to musk secretion in different Cluster 0 samples using GSVA. The results indicated that pathways related to musk secretion were enriched in 6-year-old acinar cells (Fig. S3 and Table S7, Supporting Information).
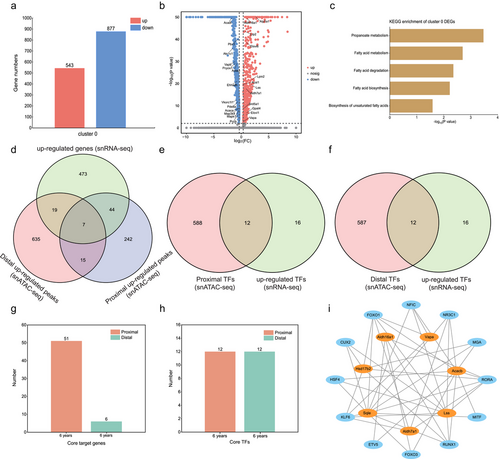
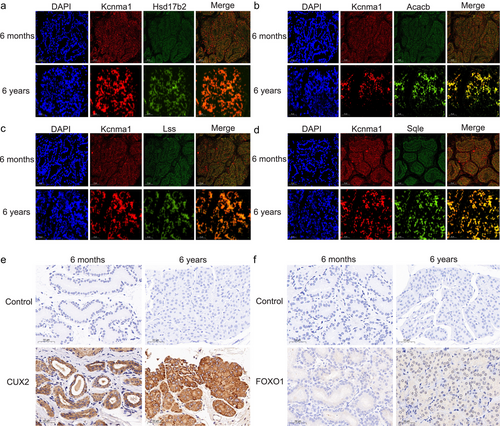
We used single cell multiome ATAC + gene expression to gain a deeper biological understanding of the relationships among TFs, chromatin accessibility, and upregulated genes during acinar cell development. During Cluster 0 acinar cell development, 44 proximal, 19 distal, and 7 proximal and distal candidate target genes were identified (Fig. 3d; Table S8, Supporting Information). Additionally, 12 proximal and 12 distal candidate TFs were identified (Fig. 3e,f; Table S8, Supporting Information). Associated candidate target genes and TFs, 51 proximal and six distal core target genes, as well as 12 proximal and 12 distal core TFs were identified (Fig. 3g,h; Table S8, Supporting Information). Among the core target genes, seven genes (Hsd17b2, Acacb, Lss, Vapa, Aldh16a1, Aldh7a1, and Sqle) participated in pathways related to musk secretion. Seven core target genes related to musk secretion were regulated by 12 core TFs (FOXO1, CUX2, RORA, RUNX1, KLF6, MGA, NFIC, FOXO3, ETV5, NR3C1, HSF4, and MITF) (Fig. 3i). To confirm the core target genes and TFs, we performed fluorescence in situ hybridization for Acacb, Hsd17b2, Lss, and Sqle, and immunohistochemistry for CUX2 and FOXO1 in 6-month-old and 6-year-old musk gland sections using the Cluster 0 acinar cell marker gene Kcnma1. The results indicated that the core target genes related to musk secretion were upregulated during Cluster 0 acinar cell development (Fig. 4a–d). Furthermore, the core TFs, CUX2 and FOXO1, which regulate core target genes related to musk secretion, were also upregulated during Cluster 0 acinar cell development (Fig. 4e,f).
Single cell multiome ATAC + gene expression during Cluster 10 acinar cell development
We examined the DEGs between different developmental stages of Cluster 10 acinar cells (Table S5, Supporting Information). During Cluster 10 development, we identified 135 upregulated and 87 downregulated genes (Fig. S4a, Supporting Information). The expression of genes related to propanoate metabolism, such as Pcca, Acacb, Acss3, and Suclg2, significantly changed during development (Fig. S4b, Supporting Information). Consistent with the above findings, propanoate metabolism was significantly enriched during Cluster 10 development (Fig. S4c and Table S6, Supporting Information). We also scored the KEGG pathways related to musk secretion between the different samples in Cluster 10 using GSVA. Notably, pathways related to musk secretion were enriched in 6-year-old acinar cells (Fig. S3 and Table S7, Supporting Information).
During the development of Cluster 10 acinar cells, two proximal and one distal candidate target genes, as well as three proximal and three distal candidate TFs were identified (Fig. S4d–f and Table S9, Supporting Information). Associated candidate target genes and TFs, a total of one proximal core target gene (Cdk8) and one proximal core TF (TFAP2A) were found (Fig. S4g,h and Table S9, Supporting Information).
Construction of a regulatory network during acinar cell development using WGCNA
WGCNA was used to categorize genes with similar expression patterns. Genes were divided into 13 modules, and the interactions between the modules were calculated (Fig. 5a). Gene–module correlations indicated that the gene expression between modules was relatively independent (Fig. S5a, Supporting Information). We used module eigenvalues to plot a heatmap of cell cluster expression patterns to identify the module that was significantly related to Cluster 0 acinar cells. The results indicated that the lightgreen module was significantly related to Cluster 0 (Fig. 5b; Table S10, Supporting Information). Notably, the lightgreen module was primarily enriched in the GO terms of “fatty acid metabolic process,” “cellular lipid metabolic process,” and “regulation of steroid metabolic process” (Fig. S5b, Supporting Information). Therefore, we focused on the lightgreen module to construct a regulatory network during Cluster 0 acinar cell development.
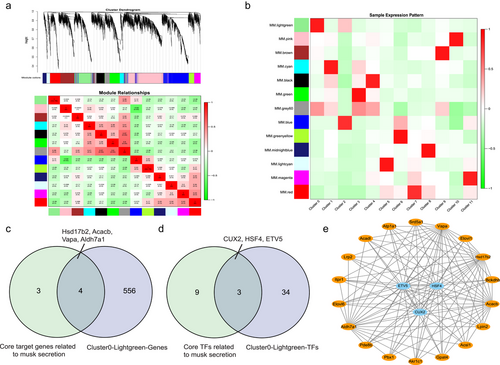
In the lightgreen module, 560 genes and 37 TFs were identified (Fig. S5c,d and Table S10, Supporting Information). During Cluster 0 acinar cell development, seven core target genes related to musk secretion were regulated by 12 core TFs. We screened four target genes (Hsd17b2, Acacb, Vapa, and Aldh7a1) and three target TFs (CUX2, HSF4, and ETV5) using Venn diagrams (Fig. 5c,d). The target genes and TFs were used to construct a gene co-expression network. Genes associated with musk secretion were further screened based on the pathways associated with musk secretion mapped by the DEGs during Cluster 0 acinar cell development. The regulatory network diagram is shown in Fig. 5e. Acsl1, Aldh7a1, and Acadl interacted via the “fatty acid degradation” pathway, while Akr1c1, Hsd17b2, and Srd5a1 interacted in the “steroid hormone biosynthesis” pathway. Finally, Gpat4, Aldh7a1, and Lpin2 interacted in the “glycerolipid metabolism” pathway.
Ligand–receptor interaction prediction during acinar cell development
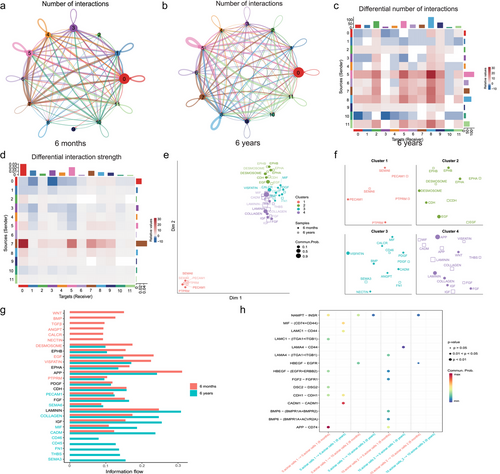
A public ligand–receptor database was used to infer the intercellular communication during musk gland development. We revealed the number and strength of interactions between cell types in the 6-month-old and 6-year-old musk glands (Fig. 6a,b; Fig. S6a,b and Table S11, Supporting Information). To identify the significantly changing interactions between cell types, we compared the number and strength of interactions between cell types. As expected, the number of interactions decreased and the strength of interactions weakened between Clusters 0 and 10 during musk gland development (Fig. 6c,d; Table S12, Supporting Information). Based on functional similarities, we identified four groups of signaling pathways (Fig. 6e). Notably, Cluster 1 primarily included pathways related to cell growth, development, and organ formation, such as PTPRM, PECAM1, and SEMA6 (Craig & Brady-Kalnay 2015; Villar et al. 2019; St Clair et al. 2019) (Fig. 6f). We compared the information flow of each signaling pathway between 6-month-old and 6-year-old samples. Certain developmental-related pathways, including WNT, BMP, TGFβ, and ANGPT (Liu & Xie 2012; Mulligan & Cheyette 2012; Morikawa et al. 2016; Magro-Lopez & Muñoz-Fernández 2021), were enriched in the 6-month-old sample (Fig. 6g; Fig. S6c, Supporting Information). We also compared the probability of communication mediated by the ligand–receptor pairs of Clusters 0 and 10 in the two samples. The results revealed 15 potential interactions between the ligands and receptors (Fig. 6h). NAMPT interacted with INSR in Clusters 0 and 10 and participated in the positive regulation of cell proliferation (Samal et al. 1994; Jensen et al. 2007). The ligand HBEGF interacted with its multi-subunit receptor, EGFR/ERBB2, and participated in the positive regulation of cell proliferation (Miyazaki et al. 1995; Gaudet et al. 2011). FGF2 interacted with FGFR1 and positively regulated cell proliferation (Mansukhani et al. 1990; Ornitz et al. 1996). The ligand BMP6 interacted with its multi-subunit receptors, BMPR1A/BMPR2 and BMPR1A/ACVR2A. BMP6 is a bone morphogenetic protein 6, which participates in aldosterone biosynthesis and secretion (Inagaki et al. 2006). APP, which is an amyloid-β precursor protein that plays a role in the cholesterol metabolic process (Liu et al. 2007), interacted with CD74 in Clusters 0 and 10.
Expression patterns of genes related to fatty acid degradation and steroid hormone biosynthesis pathways during acinar cell development
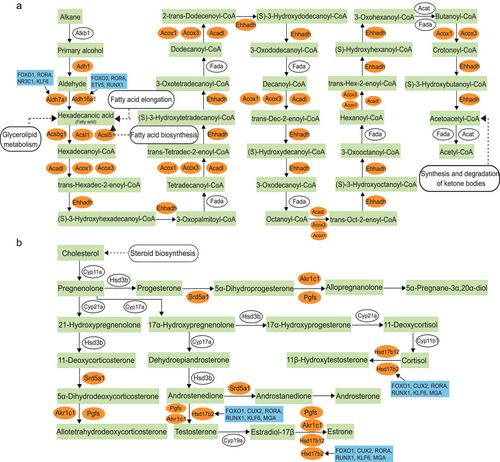
snRNA-seq and snATAC-seq association analysis was used to explore changes in transcriptional activity and identify key TFs during acinar cell development. During Cluster 0 acinar cell development, DEGs were enriched in 18 KEGG pathways associated with musk secretion, including propanoate metabolism, fatty acid metabolism, fatty acid degradation, and steroid hormone biosynthesis pathways. WGCNA further showed that fatty acid degradation, steroid hormone biosynthesis, and glycerolipid metabolism pathways played crucial roles in the development of Cluster 0 acinar cells. In the present study, we demonstrated the expression patterns of genes related to fatty acid degradation and steroid hormone biosynthesis during Cluster 0 acinar cell development (Fig. 7). Ten DEGs were detected in the fatty acid degradation pathway, including Aldh7a1, Aldh16a1, and Acsl1. Among these genes, we found that Aldh7a1 was regulated by the core TFs FOXO1, RORA, NR3C1, and KLF6, and Aldh16a1 was regulated by the core TFs FOXO3, RORA, ETV5, and RUNX1. Notably, this pathway was associated with several pathways related to musk secretion, such as fatty acid biosynthesis, glycerolipid metabolism, and synthesis and degradation of ketone bodies pathways (Fig. 7a). Regarding the steroid hormone biosynthesis pathway, Hsd17b2 (17-β-hydroxysteroid dehydrogenase type 2) underwent significant changes, was regulated by the core TFs FOXO1, CUX2, RORA, RUNX1, KLF6, and MGA, and directly affected testosterone content (Fig. 7b).
DISCUSSION
In this study, we used single cell multiome ATAC + gene expression to reveal the dynamic transcriptional cell atlas of musk gland development and determine the genes and TFs affecting acinar cell development. Using this dataset, we identified 12 different cell types, including acinar cells 1 (Cluster 0), myoepithelial cells, sebocytes, and acinar cells 2 (Cluster 10), that underwent dynamic changes throughout the study. Notably, we found two different types of acinar cells, including Cluster 0 acinar cells with high expressions of Galnt7 and Kcnma1 and Cluster 10 acinar cells with a high expression of Bmp6 (Heikinheimo et al. 1999; Li et al. 2016). Recent studies have shown that musk glands include outer and inner acini. The difference in diameter between the outer and inner acini is approximately 30 μm during the non-musk secretory period. The two layers of acini may comprise different cell types, and no current consensus exists on which cell type the two layers of acini belong to (Zheng et al. 2021).
Based on the expressions of DEGs during the developmental stage of acinar cells (Clusters 0 and 10), we further determined their functions. During acinar cell development, KEGG pathways that were associated with musk secretion changed, which may be related to the maturation of acinar cells and their ability to secrete musk. Using GSVA, we determined that pathways associated with musk secretion were enriched in 6-year-old acinar cells, possibly because of their ability to secrete musk. Using snRNA-seq and snATAC-seq association analysis, we identified seven core target genes (Hsd17b2, Acacb, Lss, Vapa, Aldh16a1, Aldh7a1, and Sqle) associated with musk secretion during the development of Cluster 0. Hsd17b2 encodes a steroid-metabolizing enzyme involved in androgen metabolism (Lu et al. 2002), and Acacb encodes a mitochondrial enzyme involved in fatty acid metabolism, which promotes lipid storage (Kaushik et al. 2009). Lss encodes lanosterol synthase, which is involved in cholesterol and steroid biosynthesis (Beyea et al. 2007; Zhao et al. 2015), while Vapa encodes a vesicle-associated membrane protein that participates in sterol transport (Mesmin et al. 2013). Aldh16a1 encodes an aldehyde dehydrogenase that participates in fatty acid degradation and pyruvate metabolism (Charkoftaki et al. 2017). Aldh7a1 encodes a multifunctional enzyme that takes part in fatty acid degradation and pyruvate metabolism (Brocker et al. 2010). Sqle is a rate-limiting enzyme that is involved in sterol biosynthesis and regulates lipid droplet formation (Polycarpou-Schwarz et al. 2018; Padyana et al. 2019). Notably, previous studies have shown that Hsd17b2 may be involved in the secretion of musk (Yang et al. 2021). During the development of Cluster 10, we identified a core target gene, Cdk8, which encodes cyclin-dependent kinases that are related to cell proliferation and energy metabolism and plays a crucial role in development (Westerling et al. 2007; Galbraith et al. 2017).
WGCNA was used to identify the module that was significantly related to Cluster 0 acinar cells. In the lightgreen module, a gene co-expression network was constructed during the development of Cluster 0. In the network diagram, the interacting genes were primarily located in the fatty acid degradation, steroid hormone biosynthesis, and glycerolipid metabolism pathways. Therefore, we determined the expression patterns of genes related to fatty acid degradation and steroid hormone biosynthesis pathways during the development of Cluster 0. In addition, the results of WGCNA provided a deeper biological understanding of the connections between TFs, genes, and pathways.
Considering that intercellular communication plays a crucial role during musk gland development, we predicted ligand–receptor interactions between cell types. During musk gland development, cellular communication between Clusters 0 and 10 was weakened, possibly because of the maturation of acinar cells and their ability to secrete musk. We also found that development-related pathways were enriched in the 6-month-old sample, which was consistent with the development of musk glands. Clusters 0 and 10 primarily communicated in processes associated with cell proliferation and musk secretion. The corresponding ligand–receptor pairs had a stronger communication probability in the 6-month-old sample, whereas it was weaker in the 6-year-old sample.
The current study has certain limitations. The development of musk glands is a gradual process, and little is known about their specific developmental process. We dissected and analyzed two musk gland samples before sexual maturity (6 months) and after somatic maturity (6 years). Future research on more samples may reveal additional details about the developmental process and transformation of musk glands. In this study, the application of only one replicate was a potential limitation. However, experimental validation provided confidence in the results. FMD is an endangered animal, and harming it for scientific research is not allowed, which limits sample collection. In future studies, we aim to collect more samples to study musk gland development and explore factors influencing musk secretion levels.
In summary, the present study provides new insights into musk gland development in FMD using single cell multiome ATAC + gene expression. Particularly, we revealed a dynamic transcriptional cell atlas of musk gland development and identified the core target genes and TFs during acinar cell development. A gene co-expression network was constructed for acinar cell development using WGCNA. Our data also provide new insights into intercellular communication during musk gland development. These data will enable us to understand the development of musk glands, provide reliable resources for future research on musk secretion mechanisms, and lay the foundation for increasing musk yield and meeting market demand. Subsequently, reducing the hunting and poaching of wild FMD, protecting FMD resources, and maintaining the ecological balance are also important.
ACKNOWLEDGMENTS
This work was supported by the Science and Technology Project of the State Forestry Administration (20180109000005), the Science and Technology Promotion Project of Shaanxi Forestry Bureau (20180611000001), the Science and Technology Project of the National Forestry and Grass Administration (20191202000009), and the Shaanxi Academy of Forestry Sciences (SXL(2020-0207)).
CONFLICT OF INTEREST STATEMENT
The authors declare no conflict of interest.
Open Research
DATA AVAILABILITY STATEMENT
The sequencing data used in this research are deposited in NCBI GEO databases under accession number: GSE182087.


