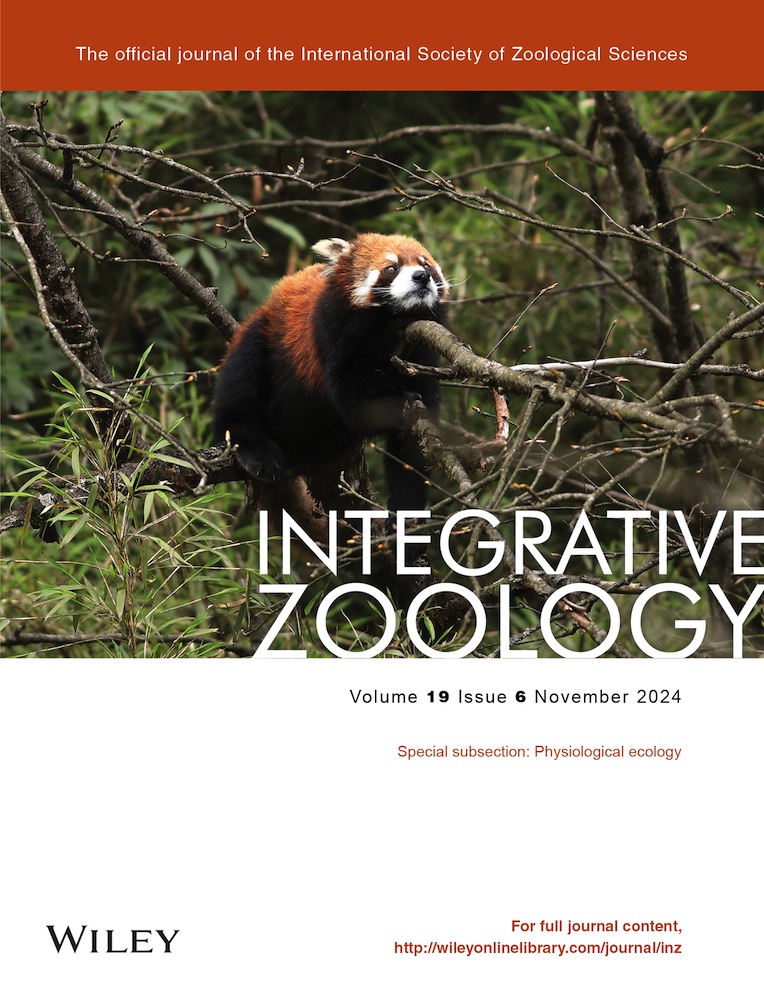
Distinct metabolic responses to thermal stress between invasive freshwater turtle Trachemys scripta elegans and native freshwater turtles in China
Abstract
Different responses or tolerance to thermal stress between invasive and native species can affect the outcome of interactions between climate change and biological invasion. However, knowledge about the physiological mechanisms that modulate the interspecific differences in thermal tolerance is limited. The present study analyzes the metabolic responses to thermal stress by the globally invasive turtle, Trachemys scripta elegans, as compared with two co-occurring native turtle species in China, Pelodiscus sinensis and Mauremys reevesii. Changes in metabolite contents and the expression or enzyme activities of genes involved in energy sensing, glucose metabolism, lipid metabolism, and tricarboxylic acid (TCA) cycle after exposure to gradient temperatures were assessed in turtle juveniles. Invasive and native turtles showed distinct metabolic responses to thermal stress. T. scripta elegans showed greater transcriptional regulation of energy sensors than the native turtles. Enhanced anaerobic metabolism was needed by all three species under extreme heat conditions, but phosphoenolpyruvate carboxykinase and lactate dehydrogenase in the invader showed stronger upregulation or stable responses than the native species, which showed inhibition by high temperatures. These contrasts were pronounced in the muscles of the three species. Regulation of lipid metabolism was observed in both T. scripta elegans and P. sinensis but not in M. reevesii under thermal stress. Thermal stress did not inhibit the TCA cycle in turtles. Different metabolic responses to thermal stress may contribute to interspecific differences in thermal tolerance. Overall, our study further suggested the potential role of physiological differences in mediating interactions between climate change and biological invasion.
INTRODUCTION
Global climate change and biological invasion are threats to global biodiversity and can interact. Climate change could favor invasive species and thus facilitate biological invasion, especially in aquatic systems (Sorte et al. 2013; Padilla et al. 2023). Studies have suggested that this may be linked with the asymmetries in physiological performance during warming between native and invasive species or greater resistance to thermal stress by invasive species (Bates et al. 2013; Penk et al. 2016). Due to the diverse responses or levels of resistance to thermal stress, native species may reach their physiological limits before invasive species do, especially under extreme climate events such as heat waves (Diez et al. 2012). This may result in a change in species composition in communities wherein native species decline and affect the biodiversity under climate change (Zerebecki & Sorte 2011). For example, an increase of 4.5°C in mean temperature decreased the survival of native species but did not affect invasive species in a marine fouling community (Sorte et al. 2010). Revealing differences in responses to thermal stress and underpinning physiological mechanisms between native and invasive species is crucial for a mechanistic understanding of the interaction between climate change and biological invasion and for managing invasive species in the future.
Maintaining energy balance or adaptive metabolic responses to thermal stress affects the thermal tolerance of organisms and sets limits for the survival of organisms under stressful conditions (Sokolova et al. 2012). Under moderate thermal stress, energy trade-off will reduce investment in other physiological functions, such as activity and reproduction, to cover the energy demands for stress protection and damage repair (Sokolova et al. 2012). Furthermore, energy demands will continue to increase as thermal stress becomes severe. When aerobic metabolism cannot support the energy demands under hot conditions, anaerobic metabolism will be initiated and potentially enhanced to help sustain the energy status and survival of organisms in the short term (Gangloff & Telemeco 2018). Enough energy supply is essential for self-maintenance under thermal stress and is needed to support the synthesis of stress proteins, such as heat shock proteins (HSPs) or antioxidant enzymes. For example, energy metabolism was enhanced synchronously with the activation of HSP70 and genes encoding antioxidant enzymes in the red cusk-eel, Genypterus chilensis, during thermal stress (Dettleff et al. 2020). Therefore, the interspecific difference in metabolic responses during thermal stress can contribute to diverse thermal tolerance among species. However, although previous studies have shown diverse tolerances to thermal stress between native and invasive species and revealed that the interspecific differences in thermal tolerance are linked with different capacities for self-maintenance (especially regulation of HSPs), the differences in metabolic responses to thermal stress between native and invasive species are rarely explored (Zerebecki & Sorte 2011; Yu et al. 2012; Gu et al. 2023).
Multiple pathways involved in sensing cellular energy status and modulating energy metabolism, such as the AMP-activated protein kinase (AMPK) signaling pathway, glycolysis, lipolysis, and the tricarboxylic acid (TCA) cycle, can play important roles in maintaining energy balance under thermal stress. AMPK and another metabolic sensor, the protein deacetylase sirtuins (SIRTs), are important energy sensors in the AMPK signaling pathway and regulate the metabolic network and energy homeostasis under low energy states (Hardie & Sakamoto 2006; Houtkooper et al. 2012). Activation of AMPK or SIRT can enhance glucose metabolism, lipid catabolism, and fatty acid β-oxidation to restore energy equilibrium under stressful conditions (Cantó et al. 2009; Mihaylova & Shaw 2011). For example, in the intertidal limpet Cellana toreuma acclimated to hot conditions, expression levels of AMPK subunits and SIRT1 positively correlated with the expressions of glycolysis-related genes and HSP70 (Dong & Zhang 2016). Inhibition of SIRTs also reduced the synthesis of stress proteins involved in energy metabolism, reactive oxygen species scavenging, and signaling in thermal-stressed mussels, Mytilus galloprovincialis and M. trossulus (Vasquez et al. 2017). Alteration of expression levels or enzyme activities of metabolic enzymes, such as hexokinase (HK), lactate dehydrogenase (LDH), or citrate synthase (CS), can indicate adaptive metabolic responses of organisms to high temperatures (Jia et al. 2018; O'Brien et al. 2018; Ghaffari et al. 2019). Hence, interspecific differences in changes in the components of metabolic pathways under thermal stress can dictate the diverse metabolic response capacity among different species. This may also reveal altered or novel physiological mechanisms underlying interspecific differences in thermal tolerance.
Freshwater turtles are an important ecological animal group in aquatic ecosystems (Lovich et al. 2018). In recent decades, this ancient animal group has suffered from climate change, habitat fragmentation, and biological invasion (Stanford et al. 2020). The red-eared slider, Trachemys scripta elegans, is native to the eastern United States but is now a global invader of freshwater ecosystems in many countries, including China, and competes for food and basking sites with native species (Polo-Cavia et al. 2010; Polo-Cavia et al. 2011; Cerasoli et al. 2019). Sliders are now widely distributed in China and have overwhelmed co-occurring native freshwater turtles, such as the Chinese pond turtle Mauremys reevesii and the Chinese stripe-necked turtle M. sinensis, in density (Ma & Shi 2017). Thus, the invasive T. scripta elegans and the co-occurring native species provide an ideal system to examine the potential role of physiological differences between invasive and native species in the response to thermal stress and potentially reveal an interaction between climate change and biological invasion. Indeed, in a previous study, we showed a greater resistance to thermal stress by T. scripta elegans as compared with two native turtles suggesting that a warming climate favors the invader (Zhang et al. 2023).
The present study aimed to explore and reveal interspecific differences in metabolic responses to thermal stress between invasive T. scripta elegans and two native species: M. reevesii and the Chinese soft-shelled turtle Pelodiscus sinensis. Changes in expression levels or enzyme activities of energy sensors and regulatory enzymes of selected metabolic pathways were assessed along with changes in concentrations of primary metabolites in turtle juveniles. The juvenile stage is an important life-history stage because juveniles usually inhabit the same environments as adults but can have less thermal tolerance than adults, and the survival of juveniles has important consequences for population persistence (Bodensteiner et al. 2021). Based on the importance of energy metabolism in enduring thermal stress, we hypothesized that the invader, T. scripta elegans, that shows greater resistance to thermal stress would be better at dealing with the energy budget or experience less energetic stress than the native species under thermal stress. Specifically, the invader was expected to show more or stronger regulation of metabolic responses than native species under thermal stress and could maintain or enhance energy metabolism at higher temperatures to cover the energy demands. Meanwhile, the two native turtle species, P. sinensis and M. reevesii, that showed lower and similar thermal tolerances may share more similarities in their metabolic responses to thermal stress despite the closer phylogenetic relationship between T. scripta elegans and M. reevesii (Pereira et al. 2017).
MATERIALS AND METHODS
Experimental organisms
The experiments were conducted according to the standards of the Animal Ethical and Welfare Committee of Nanjing Normal University (Approval No. IACUC-20 220 242).
Juveniles of three turtle species (1-year-old, mass: mean ± standard deviation, P. sinensis: n = 40, mass = 24.62 ± 5.11 g; T. scripta elegans: n = 40, mass = 35.49 ± 5.67 g; and M. reevesii: n = 40, mass = 34.41 ± 7.16 g) were purchased from a natural pond-rearing turtle hatchery (Baoying County, Jiangsu province, China). The turtles were transported to the laboratory and reared in tanks (610 × 485 × 360 mm3) with a density of 18 individuals per tank and aerated tap water. All turtles were fed a commercial diet (Xinxin Ltd, China) of approximately 1% of body weight once a day. The air temperature in the room and water temperature were maintained at 28 ± 1°C and the photoperiod was 12 h light: 12 h dark. The acclimation period lasted for more than 3 months.
Thermal stress treatment and sampling
According to the critical thermal maximum (CTmax) of the three turtle species determined in our previous study (mean ± standard error, P. sinensis: 40.25 ± 0.18°C; T. scripta elegans: 41.39 ± 0.23°C; M. reevesii: 40.53 ± 0.33°C), thermal stresses of 35°C, 37°C, 39°C, and 41°C were chosen for the experiments whereas turtles acclimated to 28°C were used as the control group (Zhang et al. 2023). Thermal stress treatments were conducted as described in our previous study and each thermal stress group contained eight individuals (Zhang et al. 2023). Briefly, using a heating chamber and a programmed water bath (TX150, Grant, UK), the air temperature in the chamber was raised by 0.1°C min−1 and was maintained for 1 h after reaching the target temperature. Turtles were held in the air during these thermal stress treatments and no individuals died during treatments. After the treatments, the turtles were euthanized by decapitation, and samples of liver and forelimb muscle were isolated and frozen in liquid nitrogen.
Gene expression analysis and enzyme activities assays
The expressions of 12 genes encoding energy sensors and metabolic enzymes (Table 1) were measured using real-time PCR. Methods for RNA isolation, reverse transcription, and real-time PCR were described in our previous study (Zhang et al. 2023). We used 30 mg tissue samples for RNA isolation using TRIzol (Cat. 9108, TaKaRa, Japan) and RNA isolation kits (Cat. 9767, TaKaRa, Japan). RNA was reverse transcribed into cDNA using a reverse transcription kit (Cat. RR037A, TaKaRa, Japan), and cDNA templates were diluted six times for real-time PCR, which was conducted on a StepOne Plus Real-time PCR platform (Applied Biosystems, USA). Primers for the control gene (translation elongation factor 1 alpha 1, EF1A) and target genes were designed using the Primer 3 web tool (http://primer3.ut.ee), and the sequences and amplification efficiencies of the primers are shown in Supporting Information 1. Each sample was run in triplicate for each gene, and relative expression levels were calculated using the 2−ΔΔCt method (Schmittgen & Livak 2008).
| General categories | Full names | Abbreviations | Parameters |
|---|---|---|---|
| Energy sensors | AMP-activated protein kinase subunit alpha 1 | AMPKα1 | Gene expression |
| AMP-activated protein kinase subunit alpha 2 | AMPKα2 | Gene expression | |
| Protein deacetylase sirtuin 1 | SIRT1 | Gene expression | |
| Glucose metabolism | Hexokinase | HK | Gene expression and enzyme activity |
| Phosphoenolpyruvate carboxykinase | PEPCK | Gene expression and enzyme activity | |
| Glucose | / | Metabolite content | |
| Lactate dehydrogenase A | LDHA | Gene expression and enzyme activity | |
| Lactate dehydrogenase B | LDHB | Gene expression and enzyme activity | |
| Lactic acid | LA | Metabolite content | |
| Lipid metabolism | Acetyl-CoA carboxylase α | ACACA | Gene expression |
| Hepatic lipase | LIPC | Gene expression | |
| Lipase | LPS | Enzyme activity | |
| Triglyceride | TG | Metabolite content | |
| TCA cycle | Citrate synthase | CS | Gene expression |
| Isocitrate dehydrogenase 1 | IDH1 | Gene expression | |
| Isocitrate dehydrogenase 3α | IDH3α | Gene expression |
- TCA, tricarboxylic acid.
Metabolite content and metabolic enzyme activity assays
Commercial kits (Nanjing Jiancheng, China) were used to measure metabolite concentrations and metabolic enzyme activities (Table 1 and Supporting Information 2). Concentrations of tissue homogenates loaded were optimized to fit within the standard curves of all kits (Supporting Information 2). Total protein content in tissues was also measured to standardize the samples. In brief, glucose content was determined using the glucose oxidase method (Kumar & Gill 2018), and TG content was measured using the glycerolphosphate oxidase-p-aminophenazone method (Fossati & Prencipe 1982). LA content was transformed to pyruvate with the generation of NADH, which reduced nitroblue tetrazolium. HK activity was determined as the rate of generation of NADPH in the HK reaction that transformed glucose into glucose-6-phosphate in the presence of glucose-6-phosphate dehydrogenase. Phosphoenolpyruvate carboxykinase (PEPCK) activity was measured as the reduction rate of NADH in the PEPCK-catalyzed reaction that converted phosphoenolpyruvate to oxaloacetate, which was then reduced to malate with the oxidation of NADH. LDH activity was measured as the conversion of lactate to pyruvate in the presence of 2,4-dinitrophenylhydrazine. LPS activity was determined as the rate of formation of methylresorufin in the cleavage reaction of 1,2-o-dilauryl-rac-glycero-3-glutaric acid-(6′-methylresorufin) ester (Graca et al. 2008). Absorption values at wavelengths specified for each target were measured on a microplate reader (Synergy H1, BioTek, USA). All measurements were assessed in duplicates, except for total protein content, which was measured in triplicates, and mean values were calculated.
Data analysis
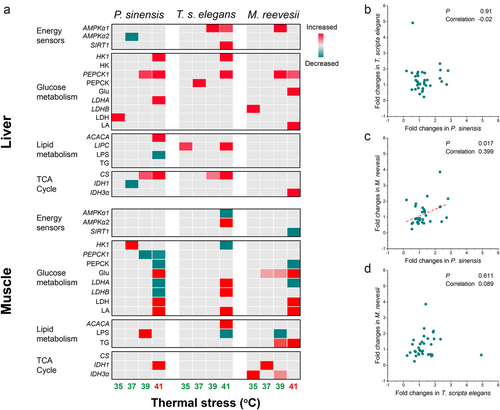
After testing the assumption of normality and homogeneity of variance, one-way analysis of variance (ANOVA) followed by a Tukey post hoc test or generalized linear model (GLM) followed by least significant difference pairwise comparison was used to analyze changes in expression levels, metabolite contents, and enzyme activities in response to thermal stress in different tissues of the three turtle species. Because of the relative expression levels being measured and the interspecific differences in the maximum expression of target genes, the effects of species or tissues were not directly tested in our models. All results were used in the ANOVA or GLM analysis and no outlier was excluded. To summarize the changes in metabolic pathways for the three turtles, a heatmap was made using the significant difference values between the treatment groups and control group for each parameter after standardizing based on the maximum change. To compare the interspecific parallelism in metabolic responses to thermal stress, Pearson correlation was conducted among the three turtles using the fold changes of all parameters at 41°C compared with the control group, but the results for PEPCK1 expression were excluded due to its overlarge fold change (e.g. 158-fold change in T. scripta elegans) (Zhao et al. 2015). Only the results from 41°C exposure were used in the correlation analysis because most changes occurred at 41°C and few changes were observed at other temperatures (Fig. 7a). The significance level was set as α = 0.05, and the statistical analysis was conducted on SPSS software (v.23, IBM, USA). The data were represented as mean ± standard error, n = 8 for each group.
RESULTS
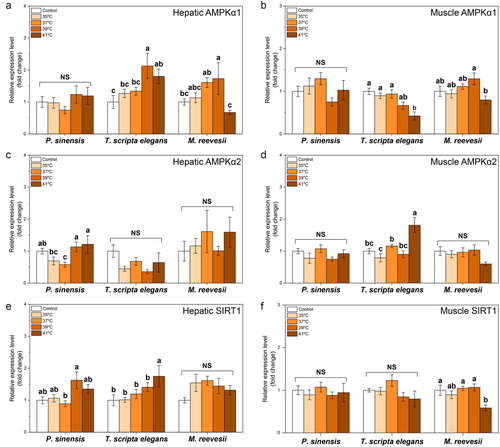
Of energy sensors, thermal stress did not affect the expression of AMPKα1 in the liver and muscle of P. sinensis (Table 2; Fig. 1a,b). However, in T. scripta elegans, the thermal stress of 39°C and 41°C significantly increased the mRNA levels of AMPKα1 in the liver but 41°C exposure decreased the expression of AMPKα1 in muscle (Table 2; Fig. 1a,b). Expression of hepatic AMPKα1 increased at 39°C but recovered at 41°C in M. reevesii (Table 2; Fig. 1a). However, muscle AMPKα1 in M. reevesii did not differ from the control group under thermal stress (Table 2; Fig. 1b). AMPKα2 expression was inhibited by 37°C exposure in the liver of P. sinensis but was induced by thermal stress at 41°C in the muscle of T. scripta elegans (Table 2; Fig. 1c,d). Expression of SIRT1 did not change under thermal stress in the liver and muscle of P. sinensis as compared with the control group (Table 2; Fig. 1e,f). In T. scripta elegans, thermal stress of 41°C increased the expression of hepatic SIRT1 but no treatment temperatures affected the expression of SIRT1 in muscle (Table 2; Fig. 1e,f). Inversely, no treatment temperatures affected the expression of hepatic SIRT1, but thermal stress of 41°C inhibited the expression of muscle SIRT1 in M. reevesii (Table 2; Fig. 1e,f).
| Pelodiscus sinensis | Trachemys scripta elegans | Mauremys reevesii | |||||
|---|---|---|---|---|---|---|---|
| Tissues | Parameters | Statistics | P-value | Statistics | P-value | Statistics | P-value |
| Liver | AMPKα1 expression | Wald χ2 = 4.087 | P = 0.394 | Wald χ2 = 16.617 | P = 0.002 | Wald χ2 = 14.263 | P = 0.007 |
| AMPKα2 expression | Wald χ2 = 13.402 | P = 0.009 | Wald χ2 = 9.193 | P = 0.056 | Wald χ2 = 2.589 | P = 0.629 | |
| SIRT1 expression | F4,35 = 3.654 | P = 0.014 | Wald χ2 = 12.228 | P = 0.016 | Wald χ2 = 7.529 | P = 0.11 | |
| HK1 expression | Wald χ2 = 12.42 | P = 0.014 | Wald χ2 = 19.892 | P = 0.001 | Wald χ2 = 5.723 | P = 0.221 | |
| HK activity | F4,35 = 2.282 | P = 0.08 | F4,35 = 2.718 | P = 0.045 | F4,35 = 5.442 | P = 0.002 | |
| PEPCK1 expression | Wald χ2 = 9.891 | P = 0.042 | Wald χ2 = 22.129 | P < 0.001 | Wald χ2 = 16.45 | P = 0.002 | |
| PEPCK activity | Wald χ2 = 3.406 | P = 0.492 | Wald χ2 = 22.149 | P < 0.001 | Wald χ2 = 1.413 | P = 0.842 | |
| Glucose content | Wald χ2 = 8.42 | P = 0.077 | Wald χ2 = 8.843 | P = 0.065 | Wald χ2 = 21.341 | P < 0.001 | |
| LDHA expression | Wald χ2 = 27.958 | P < 0.001 | F4,35 = 2.548 | P = 0.056 | Wald χ2 = 4.237 | P = 0.375 | |
| LDHB expression | F4,35 = 1.393 | P = 0.257 | Wald χ2 = 2.796 | P = 0.592 | Wald χ2 = 25.266 | P < 0.001 | |
| LDH activity | F4,35 = 4.68 | P = 0.004 | F4,35 = 0.433 | P = 0.784 | F4,35 = 0.537 | P = 0.709 | |
| LA content | F4,35 = 3.718 | P = 0.013 | F4,35 = 0.68 | P = 0.611 | Wald χ2 = 31.912 | P < 0.001 | |
| ACACA expression | Wald χ2 = 20.662 | P < 0.001 | F4,35 = 1.019 | P = 0.411 | F4,35 = 0.324 | P = 0.86 | |
| LIPC expression | Wald χ2 = 9.006 | P = 0.061 | Wald χ2 = 17.086 | P = 0.002 | Wald χ2 = 12.244 | P = 0.016 | |
| LPS activity | F4,35 = 9.273 | P < 0.001 | F4,35 = 0.589 | P = 0.673 | Wald χ2 = 7.501 | P = 0.112 | |
| TG content | Wald χ2 = 5.887 | P = 0.208 | F4,35 = 0.559 | P = 0.694 | Wald χ2 = 1.65 | P = 0.8 | |
| CS expression | Wald χ2 = 35.478 | P < 0.001 | Wald χ2 = 28.77 | P < 0.001 | Wald χ2 = 8.841 | P = 0.065 | |
| IDH1 expression | F4,35 = 3.354 | P = 0.02 | Wald χ2 = 6.107 | P = 0.191 | Wald χ2 = 8.645 | P = 0.071 | |
| IDH3α expression | Wald χ2 = 9.027 | P = 0.06 | F4,35 = 2.068 | P = 0.106 | Wald χ2 = 12.782 | P = 0.012 | |
| Muscle | AMPKα1 expression | F4,35 = 1.507 | P = 0.221 | F4,35 = 8.275 | P < 0.001 | F4,35 = 3.178 | P = 0.025 |
| AMPKα2 expression | F4,35 = 1.462 | P = 0.235 | Wald χ2 = 39.908 | P < 0.001 | Wald χ2 = 8.606 | P = 0.072 | |
| SIRT1 expression | Wald χ2 = 1.593 | P = 0.81 | F4,35 = 1.996 | P = 0.117 | F4,35 = 5.342 | P = 0.002 | |
| HK1 expression | Wald χ2 = 9.566 | P = 0.048 | F4,35 = 11.843 | P < 0.001 | F4,35 = 3.259 | P = 0.023 | |
| PEPCK1 expression | Wald χ2 = 10.953 | P = 0.027 | Wald χ2 = 7.458 | P = 0.114 | Wald χ2 = 2.988 | P = 0.56 | |
| PEPCK activity | F4,35 = 6.496 | P = 0.001 | Wald χ2 = 2.64 | P = 0.62 | Wald χ2 = 166.872 | P < 0.001 | |
| Glucose content | Wald χ2 = 166.118 | P < 0.001 | Wald χ2 = 5.407 | P = 0.248 | Wald χ2 = 125.827 | P < 0.001 | |
| LDHA expression | F4,35 = 3.317 | P = 0.021 | Wald χ2 = 12.373 | P = 0.015 | Wald χ2 = 21.411 | P < 0.001 | |
| LDHB expression | F4,35 = 3.097 | P = 0.028 | Wald χ2 = 66.26 | P < 0.001 | F4,35 = 3.792 | P = 0.012 | |
| LDH activity | F4,35 = 4.836 | P = 0.003 | F4,35 = 0.74 | P = 0.571 | F4,35 = 5.566 | P = 0.001 | |
| LA content | Wald χ2 = 111.497 | P < 0.001 | F4,35 = 5.78 | P = 0.001 | Wald χ2 = 273.704 | P < 0.001 | |
| ACACA expression | F4,35 = 2.626 | P = 0.051 | F4,35 = 10.687 | P < 0.001 | F4,35 = 4.474 | P = 0.005 | |
| LPS activity | Wald χ2 = 19.617 | P = 0.001 | F4,35 = 4.343 | P = 0.006 | Wald χ2 = 11.775 | P = 0.019 | |
| TG content | Wald χ2 = 8.548 | P = 0.073 | Wald χ2 = 0.702 | P = 0.951 | Wald χ2 = 12.023 | P = 0.017 | |
| CS expression | F4,35 = 2.026 | P = 0.112 | F4,35 = 2.284 | P = 0.08 | F4,35 = 2.3 | P = 0.078 | |
| IDH1 expression | Wald χ2 = 15.374 | P = 0.004 | Wald χ2 = 6.207 | P = 0.184 | Wald χ2 = 15.613 | P = 0.004 | |
| IDH3α expression | Wald χ2 = 13.238 | P = 0.01 | Wald χ2 = 5.945 | P = 0.203 | Wald χ2 = 87.936 | P < 0.001 | |
- AMPKα1, AMP-activated protein kinase subunit alpha 1; AMPKα2, AMP-activated protein kinase subunit alpha 2; ACACA, acetyl-CoA carboxylase α; SIRT1, protein deacetylase sirtuin 1; HK1, hexokinase 1; PEPCK1, phosphoenolpyruvate carboxykinase 1; LDHA, lactate dehydrogenase A; LDHB, lactate dehydrogenase B; LIPC, hepatic lipase; LA, lactic acid; LPS, lipase; TG, triglyceride; CS, citrate synthase; IDH1, isocitrate dehydrogenase 1; IDH3α, isocitrate dehydrogenase 3α.
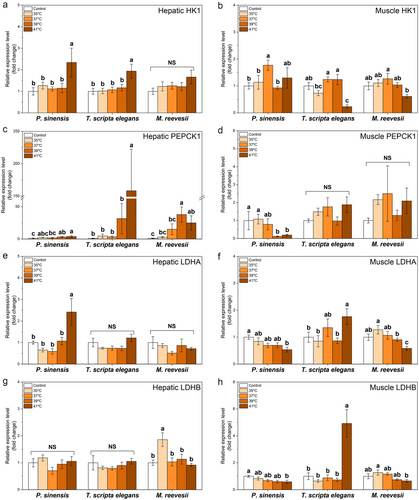
The thermal stress at 41°C increased mRNA levels of HK1 in the liver of P. sinensis and T. scripta elegans whereas thermal stresses did not affect hepatic HK1 in M. reevesii (Table 2; Fig. 2a). Muscle HK1 in P. sinensis was upregulated at 37°C but reverted when temperature increased further (Table 2; Fig. 2b). In T. scripta elegans, the thermal stress of 41°C inhibited the expression of muscle HK1, but thermal stresses did not make a significant change in muscle HK1 expression in M. reevesii as compared with the control levels (Table 2; Fig. 2b). The expression of PEPCK1 increased at 39°C and 41°C in the liver of P. sinensis and M. reevesii but, exceptionally, exposure to 41°C induced a ∼150-fold increase in the expression of hepatic PEPCK1 in T. scripta elegans (Table 2; Fig. 2c). However, in the muscle of turtles, expression of PEPCK1 in P. sinensis decreased under thermal stresses of 39°C and 41°C but was not affected in T. scripta elegans or M. reevesii (Table 2; Fig. 2d). Hepatic LDHA was upregulated at 41°C in P. sinensis but its expression remained stable in the liver of the other two species (Table 2; Fig. 2e). In muscle, the thermal stress of 41°C inhibited the expression of LDHA in P. sinensis and M. reevesii but increased the expression of LDHA in T. scripta elegans (Table 2; Fig. 2f). Similarly, the thermal stress of 35°C increased the expression of hepatic LDHB in M. reevesii, but no treatments affected hepatic LDHB expression in P. sinensis or T. scripta elegans (Table 2; Fig. 2g). Thermal stress of 41°C decreased the expression of muscle LDHB in P. sinensis but induced an approximately fourfold increase in muscle LDHB in T. scripta elegans (Table 2; Fig. 2h). Meanwhile, muscle LDHB expression in M. reevesii did not show a significant difference as compared with the control group under thermal stress (Table 2; Fig. 2h).
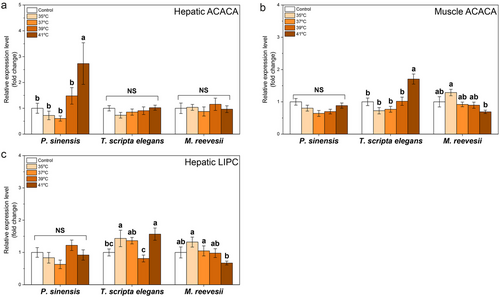
In the liver, a significant increase in expression of ACACA was observed in P. sinensis with rising temperatures, but in muscle, increased ACACA expression was observed only in T. scripta elegans at the highest temperature exposure (Table 2; Fig. 3a,b). Compared with the control group, a significant increase in LIPC expression was observed in T. scripta elegans at 35°C and 41°C but not in P. sinensis or M. reevesii (Table 2; Fig. 3c).
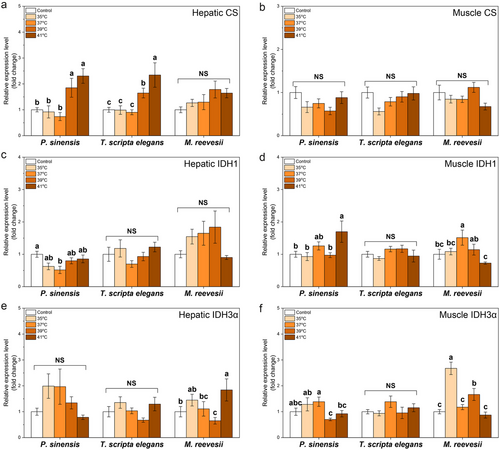
In the TCA cycle, thermal stresses of 39°C and 41°C increased the expression of CS in the liver of P. sinensis and T. scripta elegans but did not affect M. reevesii (Table 2; Fig. 4a). Furthermore, our treatments did not affect the expression of muscle CS in any of the three species (Table 2; Fig. 4b). For hepatic IDH1, only 37°C exposure led to inhibited expression in P. sinensis whereas the other two species showed no change (Table 2; Fig. 4c). In muscle, 41°C and 37°C increased IDH1 expression in P. sinensis and M. reevesii, respectively (Table 2; Fig. 4d). Our treatments did not affect the expression of hepatic IDH3α in P. sinensis and T. scripta elegans, but hepatic IDH3α in M. reevesii showed a significantly higher expression level at 41°C than the control group (Table 2; Fig. 4e). Compared with control groups, thermal stresses did not cause a significant change in the expression of muscle IDH3α in P. sinensis or T. scripta elegans, whereas thermal stresses of 35°C and 39°C upregulated muscle IDH3α in M. reevesii (Table 2; Fig. 4f).
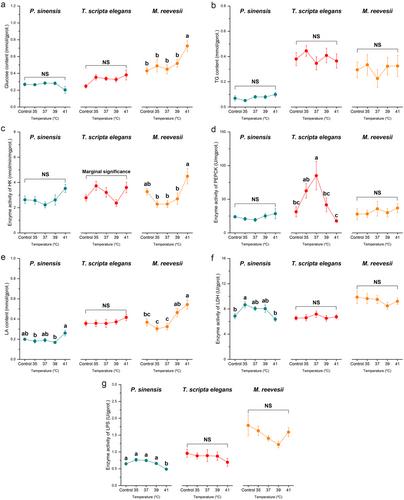
Thermal stress of 41°C increased hepatic glucose levels in M. reevesii but did not affect the hepatic glucose in the other two turtles (Table 2; Fig. 5a). Furthermore, thermal stress did not affect hepatic TG content in any of the three turtles (Table 2; Fig. 5b). Thermal stresses did not cause significant changes in the hepatic HK activity in P. sinensis and M. reevesii as compared with the control groups (Table 2; Fig. 5c), and although one-way ANOVA showed a significant effect of thermal stress on hepatic HK activity in T. scripta elegans, the multiple comparisons did not show any change among groups (Table 2; Fig. 5c). For hepatic PEPCK activity, a significant increase was observed in T. scripta elegans during thermal stress at 37°C but not at other temperatures or in the other two species (Table 2; Fig. 5d). Only a thermal stress of 41°C elevated hepatic LA content in M. reevesii, but no treatments caused significantly different hepatic LA contents in P. sinensis and T. scripta elegans as compared with control groups (Table 2; Fig. 5e). A significant increase in hepatic LDH activity was observed only in P. sinensis at 35°C but fell again when temperature continued to increase whereas thermal stresses did not affect hepatic LDH activity in the other two species (Table 2; Fig. 5f). The highest temperature (41°C) inhibited hepatic LPS activity in P. sinensis, but enzyme activity was not affected in T. scripta elegans or M. reevesii (Table 2; Fig. 5g).
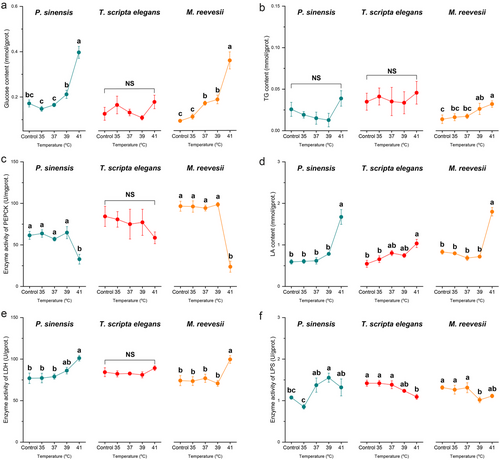
In the muscle of T. scripta elegans, thermal stress did not affect glucose content but thermal stress of 41°C increased muscle glucose levels in P. sinensis, and glucose levels also increased in the muscle of M. reevesii when the temperature exceeded 37°C (Table 2; Fig. 6a). Under thermal stresses of 39°C and 41°C, increased muscle TG content was observed in M. reevesii, but TG contents did not change significantly in the muscle of P. sinensis or T. scripta elegans under thermal stress (Table 2; Fig. 6b). PEPCK activity remained stable in the muscle of T. scripta elegans but was inhibited by thermal stress of 41°C in the muscles of P. sinensis and M. reevesii (Table 2; Fig. 6c). In the muscles of all three turtles, the thermal stress of 41°C increased the LA content (Table 2; Fig. 6d). Muscle LDH activity increased in P. sinensis and M. reevesii under thermal stress at 41°C, whereas activity remained stable in T. scripta elegans (Table 2; Fig. 6e). In the muscle of P. sinensis, thermal stress of 39°C increased LPS activity but thermal stress of 41°C inhibited muscle LPS activity in T. scripta elegans (Table 2; Fig. 6f). Similarly, thermal stress of 39°C decreased muscle LPS activity in M. reevesii but it recovered when temperature continued to increase (Table 2; Fig. 6f).
Correlation analysis showed a positive correlation between the results for all parameters at 41°C in P. sinensis and M. reevesii, but no correlation was observed between T. scripta elegans and any other species (Fig. 7).
DISCUSSION
Energy balance matters for setting the limits of tolerance of organisms under stressful conditions, and thus has important ecological significance (Sokolova et al. 2012). Interspecific differences in metabolic responses to environmental stress can produce diverse stress tolerances between species in the same community and drive changes in species composition. A greater stress tolerance of invasive species compared with native species can favor the invasion and population persistence of the invasive species under climate change (Zerebecki & Sorte 2011; Sorte et al. 2013). Therefore, interspecific differences between invasive and native species in their metabolic responses to environmental stress can be one of the important physiological underpinnings of biological invasion under climate change. In the present study, our results showed distinct energetic metabolic responses and regulatory capacity between the invasive freshwater turtle T. scripta elegans and two co-occurring native turtles, P. sinensis and M. reevesii, especially in the muscles of the three species. These differences can be driven and mediated by different response patterns of energy sensors and metabolic enzymes, especially PEPCK and LDH.
Energy sensors were more sensitive to extreme thermal stress in T. scripta elegans than in the other two native species. Regulation of AMPK can activate catabolism and limit anabolic pathways to save energy and maintain or restore energy equilibrium (Frederich et al. 2009). Different AMPKα subunits show specialized roles in metabolic regulation, with AMPKα1 being linked to carbohydrate metabolism and AMPKα2 being linked to lipid metabolism (Karagounis & Hawley 2009). Activated hepatic AMPKα1 in T. scripta elegans and M. reevesii may indicate increased glycogen utilization, such as via glycogenolysis, to maintain and regulate a fuel supply under high thermal stress. However, this upregulation reduced in the liver of M. reevesii at 41°C, which exceeded the CTmax of this species. The inhibition of AMPKα1 in the muscle of T. scripta elegans at 41°C may be for maintaining the glycogen storage under thermal stress with the activation of AMPKα2 being a substitute response to regulate lipid metabolism to generate energy. Meanwhile, the upregulation of SIRT1, a key regulator of glucose and lipid metabolism, was observed only in the liver of T. scripta elegans, indicating a potential energetic response to thermal stress by this species (Li 2013). Based on the greater resistance of T. scripta elegans to thermal stress and the corresponding response patterns of stress proteins, as compared with the other two species, a flexible alteration in the expression of energy sensors may be an adaptive response to thermal stress by this invader (Zhang et al. 2023).
Under thermal stress, T. scripta elegans showed different regulatory patterns of glucose metabolism as compared with the other two native species, mainly via alterations in the expression or activities of PEPCK and LDH. These unique responses may contribute to energy turnover under thermal stress and further enhance heat resistance in T. scripta elegans. HK1 catalyzes the first step in glucose catabolism and promotes glycolysis (John et al. 2011). Increased hepatic HK1 expression in P. sinensis and T. scripta elegans suggested a potential need for greater glucose catabolism to supply energy under thermal stress, and similar results have been observed in multiple species, such as limpet C. toreuma or shrimp Litopenaeus vannamei (Dong & Zhang 2016; Jia et al. 2018; Yang et al. 2023). However, hepatic HK activity did not change significantly in the three species under thermal stress. Inhibition of HK expression in the muscle of T. scripta elegans differed from other studies on the effects of thermal stress. This inhibition may link with the regulation of AMPKα1 in muscle to maintain glucose balance and reduce the dependence of muscle tissue on glucose catabolism under thermal stress. PEPCK is an important regulatory enzyme in gluconeogenesis and can contribute to regulating the TCA cycle by controlling the flow of carbon (Spacht et al. 2018). It has also been reported that inhibition of PEPCK can lead to metabolic derangements, including accumulation of TCA cycle intermediates and altered redox balance (Yang et al. 2008; Méndez-Lucas et al. 2013). Activation of PEPCK1 was observed in the liver of all three turtles, especially at extremely high temperatures (39°C and 41°C), indicating an essential role of upregulated PEPCK in the metabolic response of freshwater turtles to thermal stress. However, elevated PEPCK activity was observed only in the liver of T. scripta elegans at 37°C and may benefit this species in gluconeogenesis and energy turnover, such as offering extra glucose as fuel to tissues. Coincidentally, our previous study showed that the activation of key HSPs, including HSP70 and heat shock cognate 70 (HSC70), occurred at 37°C in the liver of T. scripta elegans, and the elevated PEPCK activity may promote enhanced energy metabolism to cover the energetic cost of the onset of stress protein synthesis (Zhang et al. 2023). Similarly, compared with inhibited PEPCK activity or PEPCK1 expression in the muscle of P. sinensis and M. reevesii at 41°C, the stable muscle PEPCK activity and expression in T. scripta elegans indicated a stable function of PEPCK under extreme thermal stress. This could help this invader maintain basic carbon flow for the TCA cycle or glucose recycling.
Anaerobic metabolism is important for the survival of organisms when energy supply via aerobic metabolism cannot match energy demand, such as can occur under thermal stress in various species (Overgaard et al. 2012; Han et al. 2017). In the present study, the accumulation of LA in the muscle of the three turtles at 41°C indicated enhanced anaerobic metabolism under extreme thermal stress. However, the elevation of anaerobic metabolism was accompanied by different responses of LDH between T. scripta elegans and the native turtles. Increased LDH activity but decreased expression of LDH subunits in the muscle of P. sinensis and M. reevesii suggested that these two species may depend on the regulation of LDH activity when enhanced anaerobic metabolism is needed, and may be limited in maintaining or enhancing LDH protein turnover via transcriptional regulation (Somero et al. 2017). However, T. scripta elegans showed upregulation of LDH expression, and this may allow this species to further increase its reliance on anaerobic metabolism under extreme thermal stress. Similar results were observed in the limpet Cellana toreuma that, under thermal stress, elevated expression of the anaerobic enzyme alanopine dehydrogenase (AIDH, a functional equivalent of LDH in many marine invertebrates) prior to the increase in enzyme activity that was observed when limpets reached their sublethal thermal limit (Han et al. 2017). Furthermore, thermal stress at 41°C exceeded the CTmax of P. sinensis and M. reevesii but, by contrast, was lower than the CTmax of T. scripta elegans (Zhang et al. 2023). Therefore, the transcriptional response of muscle LDH in T. scripta elegans can be a physiological response to high temperatures, but changes in muscle LDH activity in the other two species may be a limited strategy to maintain survival in the short term. In the liver, increased expression or activity of LDH was observed only in P. sinensis and M. reevesii but not in T. scripta elegans, indicating an earlier upregulation of anaerobic metabolism in the former two species than in the invader.
Changes in the expression or activity of ACACA and LPS indicated that lipid metabolism was involved in the energetic response to thermal stress in P. sinensis and T. scripta elegans but this response differed between the two species. ACACA and LPS control fatty acid synthesis and triglyceride hydrolysis, respectively, to provide fuel for fatty acid β-oxidation (Abu-Elheiga et al. 2000; Quiroga & Lehner 2012). Upregulated hepatic ACACA and increased muscle LPS activity in P. sinensis suggested enhanced fatty acid synthesis in the liver and enhanced lipid hydrolysis in the muscle of this species under thermal stress. However, it was the opposite in T. scripta elegans as suggested by increased hepatic LIPC expression and muscle ACACA expression. Meanwhile, increased ACACA expression in T. scripta elegans was consistent with a change in muscle AMPKα2, supporting the regulation of lipid metabolism in the muscle of this species. Indeed, the lipid metabolic response in P. sinensis and T. scripta elegans was stronger than in M. reevesii, which only showed decreased LPS activity and accumulation of TG in the muscle.
Results for CS, IDH1, and IDH3α expression indicated a potential acceleration of the TCA cycle in the three turtle species in response to thermal stress. CS and IDH are key rate-limiting enzymes in the TCA cycle, which is an aerobic pathway for the oxidation of carbohydrates and fatty acids (Krebs & Johnson 1937; Krell et al. 2011; Rodrigues et al. 2015). Studies have shown inhibition of CS or IDHs in various aquatic animals under thermal stress, such as large yellow croaker Larimichthys crocea and Yesso scallop Patinopecten yessoensis, due to the mismatch between oxygen supply and demand (Qian & Xue 2016; Yang et al. 2023). In the present study, only a transient inhibition of IDH1 was observed in the liver of P. sinensis under thermal stress at 37°C, but its mitochondrial isoform was not affected (Krell et al. 2011). As air breathers, turtles showed few inhibitory effects of thermal stress on their aerobic metabolism. Our results suggested that, in freshwater turtles, an enhanced anaerobic metabolism under extreme heat conditions is probably a supplement to aerobic metabolism to support energy demands rather than a replacement for aerobic metabolism (Gangloff & Telemeco 2018).
As we hypothesized, T. scripta elegans showed a better capacity to deal with energy stress under high-temperature conditions than did the two native turtle species. Our results showed similar changes in most parameters related to glucose metabolism in the muscles of P. sinensis and M. reevesii. However, these changes were contrary to those in T. scripta elegans. This suggested a different metabolic capacity in the muscle of T. scripta elegans, especially anaerobic metabolism capacity. This could contribute to the differences in thermal tolerance between invasive and native freshwater turtles. In particular, enhanced anaerobic metabolism can be needed in all three turtle species as a supplement to aerobic metabolism to match energy demand under thermal stress, but the differences in the regulatory capacity of anaerobic metabolism may lead to different thermal tolerances. Different enzyme properties of LDH were also reported to mediate differences in the CTmax of cladocerans (Zeis et al. 2023). Meanwhile, it was reported that adaptive responses to anoxia can help to increase thermal tolerance (Verberk & Calosi 2012). The invasive species, T. scripta elegans, has an excellent anaerobic capacity and high levels of LDH supporting this capacity (Ultsch 1985; Xiong & Storey 2012). The anaerobic capacity is related to supporting both short-term diving and long-term underwater hibernation during the winter in ice-locked ponds and lakes without breathing by this invader in its native habitat (Dinkelacker et al. 2005; Xiong & Storey 2012). By contrast, anaerobic capacity seems to be limited in the two native turtle species, P. sinensis and M. reevesii, in China, these species being of subtropical origin and experiencing relatively mild hibernation conditions (Zhang et al. 2016; Pereira et al. 2017). Therefore, the evolved differences between invasive and native species in physiological adaptation to environmental stress in their respective original areas may contribute to the diverse thermal tolerances and have determined the “winner” during the interaction between climate change and biological invasion.
In summary, the present study suggests that invasive and native freshwater turtle species show distinct energetic and metabolic responses to thermal stress, especially in muscle and with respect to glucose metabolism. The invader, T. scripta elegans, with higher resistance to thermal stress showed greater regulation of energy sensors than the other two native freshwater turtles, P. sinensis and M. reevesii. The invasive species also showed a stronger response by hepatic PEPCK to thermal stress at both transcription and enzyme activity levels and a more stable muscle PEPCK expression or activity than the two native species. The extreme heat condition (41°C) induced the accumulation of glucose and inhibited PEPCK activity in the muscles of P. sinensis and M. reevesii but not in the invasive species. Accumulation of lactic acid was observed in the muscles of all three turtles under thermal stress at 41°C. However, the two native species with lower thermal tolerance showed inhibited muscle LDH expression and increased muscle LDH activity, whereas the invasive T. scripta elegans showed upregulated expression of muscle LDH. Regulation of lipid metabolism was also observed in P. sinensis and T. scripta elegans under thermal stress. However, only inhibited LPS activity and accumulation of TG was observed in M. reevesii. Thermal stress did not inhibit the TCA cycle in any of the turtle species. Our results highlight the potential role of physiological responses in addition to heat shock responses in mediating the interaction between climate change and biological invasion.
ACKNOWLEDGMENTS
The study was funded by the Youth Science Foundation of the National Natural Science Foundation of China (No. 31901094) and the University Natural Science Foundation of Jiangsu Province (22KJD190002). The authors are grateful to all members of the Research Center of Herpetology of Nanjing Normal University for their support with all experiments.
CONFLICT OF INTEREST
The authors declare no competing financial interests.


