A molecular phylogeny for all 21 families within Chiroptera (bats)
Abstract
Bats, members of the Chiroptera order, rank as the second most diverse group among mammals. Recent molecular systematic studies on bats have successfully classified 21 families within two suborders: Yinpterochiroptera and Yangochiroptera. Nevertheless, the phylogeny within these 21 families has remained a subject of controversy. In this study, we have employed a balanced approach to establish a robust family-level phylogenetic hypothesis for bats, utilizing a more comprehensive molecular dataset. This dataset includes representative species from all 21 bat families, resulting in a reduced level of missing genetic information. The resulting phylogenetic tree comprises 21 lineages that are strongly supported, each corresponding to one of the bat families. Our findings support to place the Emballonuroidea superfamily as the basal lineage of Yangochiroptera, and that Myzopodidae should be situated as a basal lineage of Emballonuroidea, forming a sister relationship with the clade consisting of Nycteridae and Emballonuridae. Finally, we have conducted dating analyses on this newly resolved phylogenetic tree, providing divergence times for each bat family. Collectively, our study has employed a relatively comprehensive molecular dataset to establish a more robust phylogeny encompassing all 21 bat families. This improved phylogenetic framework will significantly contribute to our understanding of evolutionary processes, ecological roles, disease dynamics, and biodiversity conservation in the realm of bats.
INTRODUCTION
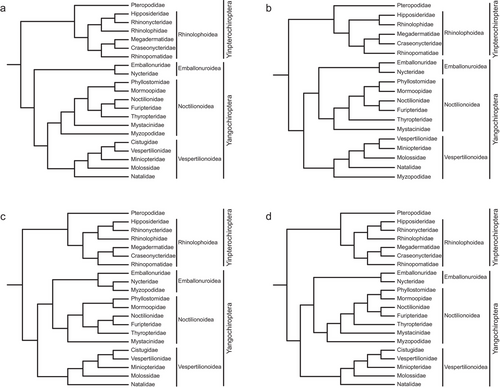
Bats (members of order Chiroptera), consisting of over 1400 species and accounting for approximately one-fifth of the world's living mammal species, are the second-most speciose group of mammals (Wilson & Mittermeier 2020; Lu et al. 2021). Understanding the phylogeny of bats is crucial, as it informs evolutionary processes, ecological roles, disease dynamics, and biodiversity conservation efforts (Ramírez-Fráncel et al. 2021; Sharnuud & Ameca 2023). Current molecular systematic studies have established the classification of 21 families within two suborders: Yinpterochiroptera and Yangochiroptera (Teeling et al. 2000; Van Den Bussche & Hoofer 2004; Teeling et al. 2018), including the three newly confirmed families Miniopteridae, Cistugidae and Rhinonycteridae, in addition to the traditional 18 subfamilies (Hoofer & Van Den Bussche 2003; Lack et al. 2010; Foley et al. 2015). However, the family-level relationships within Yangochiroptera are still controversial. For example, one phylogenetic hypothesis supported that the superfamily Emballonuroidea, containing the two families Emballonuridae and Nycteridae, is the basal lineage of Yangochiroptera; it is also the sister group to other yangochiropteran taxa (i.e. superfamilies Noctilionoidea and Vespertilionoidea) (Teeling et al. 2005, 2018) (Fig. 1a). In comparison, other phylogenetic hypotheses argued that the two superfamilies, Emballonuroidea and Noctilionoidea, are sister groups (Meredith et al. 2011; Amador et al. 2018; Álvarez-Carretero et al. 2022) (Fig. 1b–d). Moreover, the taxonomic status of the family Myzopodidae remains ambiguous. Specifically, the work of Teeling et al. (2018) and a recent species-level study from Álvarez-Carretero et al. (2022) supported that Myzopodidae should be positioned at the base of the superfamily Noctilionoidea (Fig. 1a,d), whereas Amador et al. (2018) placed Myzopodidae into Emballonuroidea, which is the sister group to Noctilionoidea (Fig. 1c). In addition, Meredith et al. (2011) argued that Myzopodidae should be positioned in the basal clade of the superfamily Vespertilionoidea (Fig. 1b).

The lack of genomic data has forced phylogeneticists to make trade-offs between higher coverage of taxonomic sampling and more complete data matrices. From the four phylogenetic hypotheses depicted (Fig. 1), Amador et al. (2018) and Álvarez-Carretero et al. (2022) sampled 799 and 890 species, respectively, and reconstructed the species-level evolutionary relationships of the relatively complete bat taxa, but with over 60% (using 9 genes) and 95% (the available molecular characters are still small although they claimed to use 182 loci) missing data matrices, which are calculated by the ratio of the total number of missing genes of all species in the concatenated super-gene matrix to the total number of genes in this matrix. On the contrary, Teeling et al. (2005) and Meredith et al. (2011) included relatively incomplete taxonomic sampling to obtain relatively complete molecular datasets. Previous simulations demonstrated that the estimates of tree topology and branch lengths may be biased by nonrandomly distributed missing data in maximum likelihood (ML) and Bayesian inference (BI) approaches (Agnarsson & May-Collado 2008; Lemmon et al. 2009; Simmons 2012; Xi et al. 2016). A common view that seems to apply to all phylogenetic methods is that high levels of missing data are problematic for phylogenies based on small datasets (i.e. overall number of characters is small) (Philippe et al. 2004; Wiens & Morrill 2011). In addition, in Wiens's argument, incomplete taxa may be misleading in phylogenetic inference due to long branches, especially for model-based methods (e.g. Bayesian analysis, likelihood, and neighbor-joining), and adding taxa could lead to dramatic increases in accuracy (Wiens 2006).
Currently, the complete molecular data matrix without missing genes for reconstructing the family-level phylogeny of bats is unavailable. In this study, we therefore have used a compromise strategy to provide a robust family-level phylogenetic hypothesis of bats based on a concatenated molecular data matrix, which contains representative species of all 21 bat families and a low level of missing genes.
MATERIALS AND METHODS
Our molecular dataset is retrieved from the super-matrix in the study of Amador et al. (2018), including four mitochondrial genes (Cyt-b, ND1, 12S rRNA, and 16S rRNA) and five nuclear genes (BRCA1, DMP1, RAG1, RAG2, and vWF). The taxon sampling strategy is that the species must contain six or more of these nine genes, with a few exceptions when some families only contain one or few species for selection. For example, species of the following families have only five genes available in the super-matrix: Cistugo seabrae (Cistugidae), Craseonycteris thonglongyai (Craseonycteridae), Rhynchonycteris naso (Emballonuridae), Taphozous nudiventris (Emballonuridae), Hipposideros diadema (Hipposideridae), Nyctinomops femorosaccus (Molossidae), Chilonatalus micropus (Natalidae), and Mormoops blainvillii and M. megalophylla (Mormoopidae). Notably, the only species Paratriaenops furculus in the family Rhinonycteridae just has three available genes (Table S1, Supporting Information). Our samples finally included 151 bat species covering 21 families. Furthermore, additional data were obtained to this initial data matrix described above to cover the missing genes as much as possible. We retrieved all currently available whole genomes, complete mitochondrial genomes, and the Sequence Read Archive (SRA) data of all selected bat species in the National Center for Biotechnology Information (NCBI) database. We eventually successfully extracted and/or assembled 95 genes (including partial genes) from 20 whole genomes, 19 mitochondrial genomes, and 18 SRA data, covering a total of 50 species (Table S1, Supporting Information). Newly obtained sequences in this study are provided in the Dataset S1, Supporting Information. The accession numbers of all genes are provided in Table S1, Supporting Information. Accession numbers for SRA data that failed to assemble into genes of interest (i.e. the four mitochondrial and the five nuclear genes) were not provided. Human (Homo sapiens), Chinese pangolin (Manis pentadactyla), and West Indian manatee (Trichechus manatus) are selected as outgroups.
We used two strategies to restore the missing data: (1) We re-retrieved the complete mitochondrial genomes (mitogenomes) and the available assembled whole-genomes in the NCBI database. Missing mitochondrial genes were extracted from complete mitogenomes using PhyloSuite (Zhang et al. 2020; Xiang et al. 2023), and nuclear genes were acquired in the whole genomes using the tblastn program (Altschul et al. 1990). The protein sequences from Amador et al. (2018) and intact protein-coding genes (PCGs) in NCBI were used as queries with the tblastn program. Open reading frames (ORFs) were corrected by GeneWise (Birney et al. 2004). (2) We searched all available SRA data in NCBI to assemble the missing genes. GetOrganelle (Jin et al. 2020) was used to assemble raw reads into complete mitogenomes. Subsequently, the target genes with intact ORFs were identified by multiple sequence alignments. For nuclear genes, raw reads were mapped to reference sequences using Geneious R9 (Biomatters, Auckland, New Zealand).
Reconstruction of phylogeny was based on four different sub-datasets: (1) PR matrix, containing all codon positions of the seven PCGs (including Cyt-b, ND1, BRCA1, DMP1, RAG1, RAG2, vWF), and the two rRNAs (12S rRNA and 16S rRNA); (2) P12R matrix, containing the first and second codon positions of the seven PCGs, and the two rRNAs; (3) P3R matrix, containing the third codon positions of the seven PCGs, and the two rRNAs; (4) AA matrix, including all amino acid sequences of the seven PCGs. The phylogenetic trees were reconstructed as follows: Multiple sequence alignments were conducted using MAFFT (Katoh et al. 2002; Katoh & Standley 2013) with L-INS-i (accurate) strategy under the codon alignment mode for PCGs and the nucleotide mode for RNAs. Poorly aligned regions were removed using Gblocks (Castresana 2000). Individual genes were then concatenated into molecular data matrices. Based on the four sub-datasets, phylogenetic trees were reconstructed using the ML and BI methods. The optimal partitioning schemes of genes, codon positions, and nucleotide substitution models of ML and BI analyses were selected using PartitionFinder2 (Lanfear et al. 2017) with the greedy algorithm (Table S2, Supporting Information). ML analyses were inferred by IQ-TREE (Nguyen et al. 2015) with the Ultrafast bootstrap (UFB) algorithm (Hoang et al. 2018), and the bootstrap support value of each node was estimated with 10 000 UFB replicates. BI method was conducted using MrBayes (Ronquist et al. 2012). Two sets of independent runs were conducted, each consisting of 20 million generations. Simultaneously, four independent Markov Chain Monte Carlo (MCMC) runs were performed, with sampling occurring every 5000 generations. A consensus tree was obtained after the initial 25% of the trees were discarded as burn-in in each MCMC run. The final consensus tree was considered to have reached convergence when the average standard deviation of split frequencies became smaller than 0.01, and the confidence value of each node was shown as the Bayesian posterior probability (BPP). To test the impact of sequence heterogeneity on phylogeny, we additionally used AliGROOVE (Kück et al. 2014) to visualize the heterogeneity levels of combined subsets of mitochondrial and nuclear genes (Fig. S1, Supporting Information), with ambiguous parameters for DNA indels and blocks of amino acid substitution matrix 62 (BLOSUM62), respectively. PhyloBayes-MPI (Lartillot et al. 2013) was used for Bayesian phylogenetic inference based on the mixture model (CAT-GTR model). Two independent chains were run, and a consensus tree was obtained when the discrepancy of bipartition frequencies (maxdiff value) between the two chains was smaller than 0.3. Alternative topologies were tested using the four-cluster likelihood mapping (FcLM) (Strimmer & von Haeseler 1997), Kishino–Hasegawa (KH) (Kishino & Hasegawa 1989), Shimodaira–Hasegawa (SH) (Shimodaira & Hasegawa 1999; Goldman et al. 2000), and approximately unbiased (AU) (Shimodaira 2002) methods, respectively.
Divergence times of all species were estimated using the MCMCtree program in the PAML package (Yang 2007). Baseml program was used for the overall estimation of the substitution rate of the dataset (GTR+G model), and MCMCtree was then used to estimate the gradient and Hessian of the likelihood values, branch lengths, and divergence times. We used seven fossil constraints (two in Yinpterochiroptera and five in Yangochiroptera, see Table S3, Supporting Information, in detail) in our molecular dating analyses, which were taken from Meredith et al. (2011).
RESULTS AND DISCUSSION
In this study, we used four mitochondrial genes and five nuclear genes to provide a robust family-level phylogenetic tree of bats based on the integrated datasets from Amador et al. (2018) and our newly extracted or assembled genes with a lower level of missing data (19.5% missing genes).
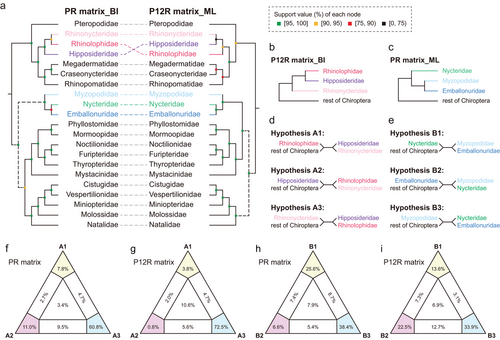
Phylogenetic analyses using both ML (IQ-TREE) and BI (MrBayes) methods yielded nearly identical family-level relationships for the same sub-datasets, and topologies based on different datasets were distinct (Dataset S2, Supporting Information). The familial relationships inferred from the PR and AA matrices were the same except for some conflicts within superfamilies Rhinolophoidea and Emballonuroidea (Trees 1–4 in Dataset S2, Supporting Information). As a result, we only presented two main topologies (PR and P12R matrix) inferred from different analyses in Fig. 2a. Several phylogenetic inconsistencies were observed in the two trees, most notably concerning the position of the superfamily Emballonuroidea (including three families: Emballonuridae, Nycteridae, and Myzopodidae) (Fig. 2a). The topologies of the PR matrix inferred by both IQ-TREE and MrBayes strongly supported the basal position of Emballonuroidea within the suborder Yangochiroptera (BPP = 1) (Fig. 2a; Trees 1 and 2 in Dataset S2, Supporting Information). Conversely, the P12R matrix supported a sister relationship between the two superfamilies Emballonuroidea and Noctilionoidea, the latter of which included six families: Phyllostomidae, Mormoopidae, Noctilionidae, Furipteridae, Thyropteridae, and Mystacinidae (Fig. 2a; Trees 5 and 6 in Dataset S2, Supporting Information). Neither topology was explicitly rejected when using topology tests based on both PR and P12R matrices (Table S4, Supporting Information). It is noteworthy that the P12R_ML tree contained some unsolved nodes, but a more robust family-level topology, indicated by higher support values, was obtained through the utilization of the PR matrix compared to the P12R matrix (Fig. 2a).

Furthermore, the relationships among families, such as the three families Rhinonycteridae, Rhinolophidae, and Hipposideridae within the superfamily Rhinolophoidea, as well as the three families Myzopodidae, Nycteridae, and Emballonuridae within the superfamily Emballonuroidea, remain equivocal (Fig. 2a–c). Various FcLM analyses preferred the sister-group relationship between Hipposideridae and Rhinolophidae (Hypothesis A3), whereas the KH/SH/AU tests supported two other hypotheses A1 and A2 (Fig. 2d,f,g; Table 1). For the superfamily Emballonuroidea, all topology tests placed Myzopodidae at the basal position of Emballonuroidea (Fig. 2e,h,i; Table 1). In addition, the results of the P3R sub-dataset showed an obvious phylogenetic error, as the monophyly of Yinpterochiroptera is not recovered (Trees 7–8, Dataset S2, Supporting Information). One possible explanation is that the third codon positions may have valuable phylogenetic information when inferring relationships within genera or closely related genera (Lartillot et al. 2013), but they may not suit the family-level inference. Moreover, these fast-evolving codon positions may have excessive variations in lineages with rapid adaptive radiations such as bats, and the resulting substitution saturations may bias phylogenetic inference (Yang 1996; Breinholt & Kawahara 2013). Another possibility is that the sequences of the P3R subset lack enough resolutions as it is almost one-third the size of the entire PR dataset. Notably, in the subsequent PhyloBayes analyses utilizing the mixture heterogeneity model that incorporates variations across sites in the amino acid replacement process, we observed that the CAT + GTR model did not yield satisfactory results for any of the sub-datasets, although the maxdiff values indicated convergence of the trees based on the PR matrix (maxdiff = 0.157) and P12R matrix (maxdiff = 0.127). This could be explained by the CAT + GTR model that does not fit well on these small datasets due to the lack of sufficient information on the sequences (e.g. the number of parsimony-informative sites is small) (Lartillot et al. 2009). Nonetheless, all our analyses suggest that the family Myzopodidae should be placed into the superfamily Emballonuroidea, which is the sister group to Noctilionoidea. Given the highest support values at the nodes compared to other trees (Dataset S2, Supporting Information), we have chosen a single tree (PR matrix_BI, Fig. 2a) as the optimal phylogenetic hypothesis.
| Matrix | Hypothesis | logL | deltaL | bp-RELL | P-KH | P-SH | P-WKH | P-WSH | c-ELW | P-AU |
|---|---|---|---|---|---|---|---|---|---|---|
| PR | A1 | −263734.18 | 2.722 | 0.212 + | 0.275 | 0.391 + | 0.275 + | 0.435 + | 0.22 + | 0.35 + |
| A2 | −263731.46 | 0 | 0.642 + | 0.726 + | 1 + | 0.726 + | 0.817 + | 0.62 + | 0.745 + | |
| A3 | −263734.79 | 3.331 | 0.146 + | 0.233 + | 0.331 + | 0.233 + | 0.382 + | 0.16 + | 0.247 + | |
| P12R | A1 | −137990.02 | 0 | 0.459 + | 0.513 + | 1 + | 0.513 + | 0.652 + | 0.444 + | 0.559 + |
| A2 | −137991.82 | 1.805 | 0.114 + | 0.271 + | 0.451 + | 0.271 + | 0.454 + | 0.14 + | 0.205 + | |
| A3 | −137990.12 | 0.099 | 0.427 + | 0.487 + | 0.634 + | 0.487 + | 0.635 + | 0.416 + | 0.574 + | |
| PR | B1 | −263733.41 | 2.366 | 0.383 + | 0.397 + | 0.507 + | 0.397 + | 0.539 + | 0.384 + | 0.418 + |
| B2 | −263741.31 | 10.262 | 0.0031 − | 0.0628 + | 0.104 + | 0.0628 + | 0.122 + | 0.00503 − | 0.00429 − | |
| B3 | −263731.04 | 0 | 0.614 + | 0.603 + | 1 + | 0.603 + | 0.719 + | 0.611 + | 0.615 + | |
| P12R | B1 | −137994.61 | 6.275 | 0.219 + | 0.224 + | 0.268 + | 0.224 + | 0.355 + | 0.222 + | 0.247 + |
| B2 | −137998.62 | 10.29 | 0.0188 − | 0.0776 + | 0.105 + | 0.0776 + | 0.156 + | 0.0231 − | 0.0465 − | |
| B3 | −137988.33 | 0 | 0.762 + | 0.776 + | 1 + | 0.776 + | 0.847 + | 0.755 + | 0.818 + |
- Hypotheses A1, A2, A3, B1, B2, and B3 are also shown in Fig. 2. Assessment of conflicting tree topologies using Kishino–Hasegawa (KH), Shimodaira–Hasegawa (SH), and approximately unbiased (AU) (Shimodaira 2002) tests. deltaL, logL difference from the maximal logL in the set; bp-RELL, bootstrap proportion using the RELL method (Kishino et al. 1990); P-KH, P-value of KH test; P-SH, P-value of SH test; P-WKH, P-value of weighted KH test; P-WSH, P-value of weighted SH test; c-ELW, expected likelihood weight (Strimmer & Rambaut 2002); P-AU, P-value of AU test. Plus signs (+) and minus signs (−) denote the 95% confidence sets and significant exclusion, respectively. All tests performed 10 000 resamplings using the RELL method.
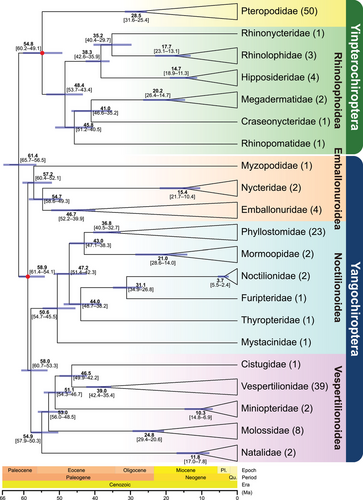
Twenty-one lineages in the phylogenetic tree correspond to 21 bat families (Fig. 3). Almost all inter-familial nodes in the phylogenetic tree are strongly supported. Compared to the results of Amador et al. (2018) with most unresolved nodes, our integrative analyses obtained a more robust phylogenetic framework with improved phylogenetic signals and a lower level of missing data (Fig. 3). Compared to the results of many studies (Meredith et al. 2011; Amador et al. 2018; Álvarez-Carretero et al. 2022), our results do not agree with their placement of Emballonuroidea. Conversely, we are generally more supportive of putting this superfamily as the basal lineage of Yangochiroptera, which is a sister group to the remaining Yangochiroptera taxa sensu Teeling et al. (2018). In addition, we contend that the placement of Myzopodidae as the sister group to Nycteridae (Amador et al. 2018) (Fig. 1c) lacks sufficient resolution, which has been significantly excluded in our topology tests (Fig. 2h,i; Table 1). Our results instead support that Myzopodidae should be placed as a basal lineage of Emballonuroidea and a sister to the clade consisting of Nycteridae and Emballonuridae (BPP = 0.953, Fig. 3). These phylogenetic inconsistencies may be attributed to distinct levels of missing data between molecular datasets. In addition, our results are consistent with those obtained from the available whole genomic data (Foley et al. 2023), although they cannot cover all 21 families due to the lack of genome data for some families. However, in either this study or previous studies, it is difficult to avoid phylogenetic errors (for instance, incomplete lineage sorting or potential long branch attraction) based on current concatenated super-matrix (or multiple sub-matrices). Thus, major challenges remain for accurate phylogenetic reconstructions using concatenated few-gene datasets. Despite the Bat1K Project being launched in 2018 (Teeling et al. 2018), phase 1 of the project has not been completed so far, that is, sequencing representative species in each of the 21 bat families. The scarcity of genomic data for key taxa remains the biggest issue, which makes the real evolutionary histories of some taxa confusing.

The dated phylogenetic tree of Chiroptera based on the PR matrix using seven fossil calibration points is shown in Fig. 3 and Fig. S2, Supporting Information. Divergence time estimates showed that bats diverged approximately 61.4 Ma (65.7–56.5 Ma, 95% highest posterior density [HPD]) at Paleocene after the Cretaceous-Paleogene (K-Pg, 66 Ma) boundary. The divergence times are similar to the estimates of Amador et al. (2018) and Álvarez-Carretero et al. (2022), but slightly more recent than those of Teeling et al. (2005) and Meredith et al. (2011). Moreover, Yinpterochiroptera diversified at 54.8 Ma (60.2–49.1 Ma, 95% HPD), whereas Yangochiroptera diversified at 58.9 Ma (61.4–54.1 Ma, 95% HPD). Together, this study proposes a robust molecular phylogeny of all 21 families in bats with a lower level of missing data and provides divergence times for each bat family. The puzzling relationships within the suborder Yangochiroptera call for in-depth phylogenetic studies of these bats in the future.
ACKNOWLEDGMENTS
This work was supported by the National Natural Science Foundation of China (32270436).
CONFLICT OF INTEREST
The authors declare no conflict of interest.


