The intestinal microbiota and metabolic profiles of Strauchbufo raddei underwent adaptive changes during hibernation
Abstract
The intestinal microbiota help regulate hibernation in vertebrates. However, it needs to be established how hibernation modulates the gut microbiome and intestinal metabolism. In the present study, we used an artificial hibernation model to examine the responses of the gut microbiota of the Strauchbufo raddei to the environmental changes associated with this behavior. Hibernation significantly lowered the diversity of the microbiota and altered the microbial community of the gut. Proteobacteria, Firmicutes, and Bacteroidota were the major bacterial phyla in the intestines of S. raddei. However, Firmicutes and Proteobacteria predominated in the gut of active and hibernating S. raddei, respectively. Certain bacterial genera such as Pseudomonas, Vibrio, Ralstonia, and Rhodococcus could serve as biomarkers distinguishing hibernating and non-hibernating S. raddei. The gut microbiota was more resistant to environmental stress in hibernating than active S. raddei. Moreover, metabolomics revealed that metabolites implicated in fatty acid biosynthesis were highly upregulated in the intestines of hibernating S. raddei. The metabolites that were enriched during hibernation enabled S. raddei to adapt to the low temperatures and the lack of exogenous food that are characteristic of hibernation. A correlation analysis of the intestinal microbiota and their metabolites revealed that the gut microbiota might participate in the metabolic regulation of hibernating S. raddei. The present study clarified the modifications that occur in the intestinal bacteria and their symbiotic relationship with their host during hibernation. These findings are indicative of the adaptive changes in the metabolism of amphibians under different environmental conditions.
INTRODUCTION
Hibernation is a common behavior associated with various physiological strategies that enable animals to contend with extreme environments (Mohr et al. 2020). Hibernators lack exogenous food sources and must, therefore, fast for extended periods. Fasting during hibernation adaptively modifies organ systems such as the gastrointestinal tract that are directly involved in dietary intake. Fasting can cause atrophy of the intestinal villi and inhibit epithelial cell proliferation in hibernating animals (Kurtz et al. 2021). However, the gastrointestinal tract also houses trillions of microorganisms. The impact of fasting on the gastrointestinal mucosa invariably alters the gut microbiome in hibernating animals. The symbiotic relationship between the intestinal microbiota and their vertebrate hosts has been investigated and confirmed. Vertebrates provide a supportive living environment for intestinal bacteria while the latter and their metabolites affect various life activities in the host, including adaptation to the external environment. Intestinal microorganisms depend mainly on their host for their nutrients (Carey & Assadi-Porter 2017). Hence, the ambient environment, life history (Tong et al. 2020), geographical location (Yatsunenko et al. 2012), and diet (David et al. 2014; Devkota & Chang 2015) of the host influence the composition of its gut microbiota. Prior research demonstrated that the intestinal microbiota is implicated in the development, immune function, cell proliferation, and metabolism of the host (Carey & Assadi-Porter 2017; Silva et al. 2020). Thus, the changes that occur in the gut microbiota profile during hibernation must be determined to understand the functions of the intestinal bacteria in the host in this process.
Amphibians link aquatic and terrestrial life. Their unique life histories have inspired researchers to examine the changes and potential roles of gut microorganisms during their various life stages including hibernation (Tong et al. 2019; Song et al. 2021). The gut microbiota shares common characteristics in a wide range of hibernating animals. Proteobacteria predominate in certain hibernators such as Bufo gargarizans (Song et al. 2021), Rana dybowskii (Tong et al. 2020), and arctic ground squirrel (Stevenson et al. 2014). A study on artificially hibernating brown tree frogs revealed that their intestinal Firmicutes and Bacteroides abundances decreased and increased, respectively, during hibernation (Weng et al. 2016). The same phenomenon was observed in hibernating mammals (Dill-McFarland et al. 2014; Sommer et al. 2016). Energy intake may be correlated with Firmicutes: Bacteroides ratios (Murphy et al. 2010; Cox & Blaser 2013). The gut microbiota helps regulate energy metabolism in the host. Hibernating animals such as 13-lined ground squirrels (Dill-McFarland et al. 2014), brown bears (Sommer et al. 2016), and bats (Xiao et al. 2019) store abundant fat in the summertime and use it as their primary energy source during hibernation. Moreover, their metabolic rates decrease in response to the drastic change from exogenous to endogenous food sources that occurs during hibernation (Carey & Assadi-Porter 2017). However, it remains to be determined whether the gut microbiota plays a role in the metabolism of hibernating animals in general, and amphibians in particular.
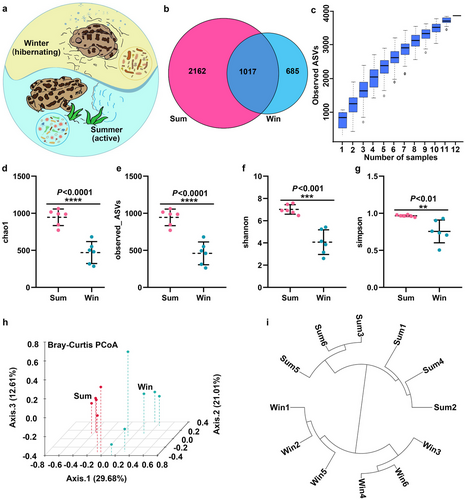
The amphibian Strauchbufo raddei (Family Ranidae; Order Anura) is distributed in the northern part of China (Ju et al. 2011). It usually hibernates in burrows and has no arousal periods (Fig. 1a). The differences in the intestinal microbiota of hibernating and active (non-hibernating) S. raddei are unclear. Furthermore, the relationship between the metabolites in the intestines and alterations in the gut microbiota is unknown. In the present study, we constructed an artificial environment simulating the hibernation state of overwintering S. raddei and collected the colonic contents of both hibernating and active S. raddei. We used 16S rDNA amplicon sequencing analysis to investigate the alterations in the intestinal microbiota of hibernating S. raddei. We also used untargeted metabolomics based on liquid chromatography–mass spectrometry (LC–MS) to screen the different metabolite profiles of hibernating and active S. raddei. We performed Pearson's correlation analysis on bacterial biomarkers and various microbial metabolites to ascertain whether the gut microbiota influences the metabolism of hibernating S. raddei. The present work investigated the changes in the gut microbiota and the differences in the metabolites of hibernating and active S. raddei demonstrated how the gut microbiota affects the metabolism of hibernating S. raddei and clarified the complex relationship between amphibians and their intestinal microbial symbionts.
MATERIALS AND METHODS
Sample collection
Forty-two adult S. raddei were collected in Lanzhou, Gansu Province, China, in July 2021. All males were housed in an 85 cm × 50 cm × 60 cm tank containing water, soil, and wheatgrass for S. raddei maintenance. All animals were housed at 23°C and under a 14 h/10 h light/dark cycle for ≥ 2 weeks. Tenebrio molitor larvae were fed at the rate of 10% S. raddei biomass thrice weekly for 2 weeks. Each animal was randomly assigned to the summer (Sum) or the winter (Win) group. All of them were fasted for 3 days before the experiment. After fasting, the S. raddei in the Sum were euthanized while those in the Win groups were placed in artificial hibernation. The S. raddei in the Win group were placed in 20 cm × 15 cm × 15 cm bubble chambers containing wet soil and simulating their natural hibernation habitat. Each chamber contained two S. raddei, and all chambers were placed in an incubator in the dark at 4°C for 60 days. The S. raddei were then moved to the foregoing 23°C environment, kept there until they crawled slowly (∼2 h), and euthanized. The colonic contents of the animals in both groups were meticulously collected within 15 min of euthanasia and placed in separate sterile 1.5-mL sterile Eppendorf tubes (Eppendorf GmbH, Hamburg, Germany). The tubes were then frozen in liquid nitrogen for 1 h and stored at −80°C. The guidelines of the Institutional Animal Care and Use Committee of Lanzhou University and the National Regulations on the Administration of Experimental Animals were strictly followed in all experiments.
DNA extraction, PCR amplification, and sequencing
A DNA purification kit (Qiagen, Hilden, Germany) was used to extract the intestinal bacterial DNA of each animal according to the manufacturer's instructions. DNA purity and integrity were evaluated on 1% agarose gel. The V4 region of the bacterial 16S rRNA gene was amplified with the primers 515F (5′-GTGCCAGCMGCCGCGGTAA-3′) and 12-base barcoded 806R (5′-GGACTACHVGGGTWTCTAAT-3′). The polymerase chain reactions (PCR) were performed using Phusion® High-Fidelity PCR Master Mix (New England Biolabs [NEB], Ipswich, MA, USA) according to the manufacturer's instructions. The PCR products were amplified, combined with equivalent volumes of SYB green-containing 1X loading buffer (Thermo Fisher Scientific, Waltham, MA, USA), electrophoretically separated on 2% agarose gels, and observed. The PCR amplicons were then purified with a Qiagen Gel Extraction Kit. Sequencing libraries were created with a NEBNext® UltraTM IIDNA Library Prep Kit (No. E7645; NEB) according to the manufacturer's instructions. A Qubit@ 2.0 fluorometer (Thermo Fisher Scientific) and an Agilent Bioanalyzer 2100 system (Agilent Technologies, Santa Clara, CA, USA) were used to assess library quality. The library was sequenced on an Illumina NovaSeq platform at Novogene (Beijing, China) and 250-bp paired-end reads were generated.
Amplicon sequence variant (ASV) denoising and species annotation
The aforementioned paired-end reads were assigned based on their distinctive sample barcodes and truncated by eliminating the barcodes and the primer sequences. FLASH (Fast Length Adjustment of SHort reads) v. 1.2.11 (https://ccb.jhu.edu/software/FLASH/) was used to merge the paired-end reads (Magoc & Salzberg 2011). Raw tags were quality-filtered with Fastp v. 0.20.0 (https://github.com/OpenGene/fastp) to create high-quality clean tags. Vsearch v. 2.15.0 (https://github.com/torognes/vsearch/releases) was used to compare the clean tags against the reference Silva database (https://www.arb-silva.de/) for 16S/18S and the Unite database (https://unite.ut.ee/ ) for ITS. The chimera sequences were removed to obtain the effective tags (Haas et al. 2011), which were then denoised with DADA2 in QIIME2 v. QIIME2-202006 (https://qiime2.org/) to produce the initial amplicon sequence variants (ASVs). ASVs with abundance < 5 were filtered out. The Silva database was then used to annotate the species, collect the pertinent species information, and determine the species-based abundance distributions. QIIME2 was also used to perform a multiple sequence alignment, explore the evolutionary relationships among ASVs, and identify the differences between groups in terms of their dominant gut bacterial species. The absolute ASV abundance was normalized by using a standard sequence number corresponding to the sample with the fewest sequences. Alpha- and beta diversity analyses were then conducted based on the normalized output data.
Analysis of 16S rDNA sequencing data
QIIME2 was used to construct the alpha diversity indices Chao1, Observed ASVs, Shannon, and Simpson to evaluate the intestinal bacterial community diversity and richness of the samples. The Bray–Curtis distances in QIIME2 were used to estimate the beta diversity and compare the two groups in terms of their intestinal bacterial community compositions. A principal coordinate analysis (PCoA) was conducted to display the differences among samples in intricate multidimensional data. The 3D PCoA was plotted in QIIME2, and the statistical significance of each difference in the gut bacterial community structure between groups was determined using the analysis of similarities (ANOSIM) function in QIIME2. MetaStat and t-tests were run in GraphPad Prism v. 8.0 (GraphPad Software, La Jolla, CA, USA) and R v. 3.5.3 (R Core Team Vienna, Austria) to identify the bacterial phyla, classes, orders, families, genera, and species that significantly differed between groups. The vegan package of R was used to quantify the contribution of each species to the differences between the two groups. LEfSe v. 1.0 (https://huttenhower.sph.harvard.edu/lefse) was used to conduct the linear discriminant analysis effect size (LEfSe) analysis. ASVs with linear discriminant analysis (LDA) scores > 4 were deemed typical.
Intestinal bacterial phenotype and function prediction
BugBase (https://bugbase.cs.umn.edu/downloads.html) uses the ASV table as the input file and was applied to predict the phenotypes of the various groups of gut bacteria. The ASV table was first standardized according to the predicted 16S copy number. The bacterial phenotypes were then predicted using the preprocessed database, and the thresholds were automatically selected by BugBase. PICRUSt (https://github.com/picrust/picrust2/wiki) was used to predict the genomic functions of the gut microbiota based on the ASV tree in the Greengenes database (https://ngdc.cncb.ac.cn/databasecommons/database/id/3120) and the genetic information for the ASVs. PICRUSt inferred the gene function spectrum from the common gene ancestor and those of other untested species in the Greengenes database. Genetic function prediction profiles were constructed for entire archaeal and bacterial lineages, the microbiota composition obtained by sequencing was mapped to the database, and the metabolic functions of the microbiota were predicted.
Metabolite extraction
The colonic contents were suspended in prechilled 80% (v/v) methanol in Eppendorf tubes, incubated on ice for 5 min, and centrifuged at 15 000 rpm and 4°C for 20 min. The partial supernatants were then transferred to new Eppendorf tubes, centrifuged at 15 000 rpm and 4°C for 20 min, and injected into an ultrahigh-performance liquid chromatography–tandem mass spectrometry (UHPLC–MS/MS) system for analysis.
UHPLC–MS/MS analysis
A Vanquish UHPLC system and an Orbitrap Q ExactiveTM HF-X mass spectrometer (MS) (Thermo Fisher Scientific and Novogene, respectively) were used to perform the UHPLC–MS/MS analyses at the Novegene facilities. The samples were injected in a 17-min linear gradient into a Hypesil Gold column (100 mm × 2.1 mm; 1.9 μm) at 0.2 mL/min flow rate. Aqueous ammonium acetate (5 mM; pH 9.0) and formic acid (0.1% v/v) were the eluents for the positive and negative polarity modes, respectively. Methanol was eluent B for both types of polarity. The Q ExactiveTM HF-X MS was run in positive/negative polarity mode. The spray voltage was 3.5 kV, the capillary temperature was 320°C, the sheath gas flow rate was 35 psi, the auxiliary gas flow rate was 10 L/min, the S-lens RF level was 60, and the auxiliary gas heater temperature was 350°C. Quality control (QC) samples comprised mixtures of equal volumes of all experimental samples and were created to validate experimental integrity.
Analysis of metabolomics data
Peak alignment, peak selection, and quantification of each metabolite were conducted in Compound Discoverer v. 3.1 (CD3.1; Thermo Fisher Scientific) to process the raw data files generated from the UHPLC–MS/MS. The Kyoto Encyclopedia of Genes and Genomes (KEGG; https://www.genome.jp/kegg/pathway.html) and the Human Metabolome (HMDB; https://hmdb.ca/metabolites) databases were used to annotate the metabolites. MetaX (https://rdrr.io/bioc/metaX/) was used to perform the principal component analysis (PCA) and the partial least squares–discriminant analysis (PLS–DA) (Wen et al. 2017). P-values were calculated by univariate analysis (t-test). Differentially expressed metabolites (DEMs) had variable importance in projection (VIP) > 1 and P < 0.05. Volcano plots selected metabolites of interest based on log2 fold change (FC) and -log10 P-value in the ggplot2 tool of R. The KEGG database searched metabolite functions and pathways. Bubble maps were plotted in the ggplot2 tool of R. Metabolic pathways were deemed enriched when x/n > y/N and highly enriched when P < 0.05. Pearson's correlation coefficient was used to conduct correlation analyses of various metabolites and bacterial taxa. Statistical significance (P < 0.05) was determined using the cor.mtest function in R. Heat maps were generated using the Pheatmap package in R.
RESULT
Changes in alpha diversity and beta diversity
RNA quality processing of the colonic contents of 12 S. raddei individuals resulted in 1 466 782 high-quality 16S rRNA genes and an average of 122 232 sequences per sample. After dereplication, 3864 amplicon sequence variants (ASVs) were identified and the average length per read was 253 nt. There were 1017 ASVs common to both groups and 2162 and 685 unique ASVs in the Sum and Win groups, respectively (Fig. 1b). The number of ASVs was significantly lower in hibernating than active S. raddei. The species accumulation boxplot revealed that the sequenced samples mainly reached the plateau phase. Hence, the sample size was adequate for data processing (Fig. 1c).
The Chao1, Observed_ASVs, Shannon, and Simpson alpha diversity indices were used to evaluate the richness of the intestinal microbiota and identify the differences in microbial diversity between the Sum and Win groups. All alpha diversity indices were significantly lower in the Win than in the Sum group (P < 0.01; Fig. 1d–g). Thus, gut microbiota richness and diversity were substantially lower in hibernating than in non-hibernating S. raddei. The Bray–Curtis distance was used in a principal coordinate analysis (PCoA) to distinguish clusters of specific intestinal microbiota taxa in S. raddei. Fig. 1h shows that samples from the Win group formed a cluster distinct from that of the Sum group, and the principal components Axis.1, Axis.2, and Axis.3 explained 29.68%, 21.01%, and 12.61% of the variation, respectively. Fig. 1i presents the clustering tree of the intestinal microbial species in the Sum and Win groups and demonstrates that each group belongs to a different branch. The preceding analysis indicated that the microbial groups formed in hibernating S. raddei differed from those that developed in active S. raddei.
Hibernation promoted adaptive changes in the composition of the intestinal microbiota of S. raddei
The compositions of the intestinal microbiota of the Sum and Win groups markedly differed. We detected 52 bacterial phyla in the colonic contents of the 12 S. raddei individuals. The dominant phyla (> 1%) were Proteobacteria, Firmicutes, and Bacteroidota, followed by Actinobacteriota, Fusobacteriota, Desulfobacterota, Spirochaetota, and Verrucomicrobiota (Fig. 2a). We then used the Simper function in the vegan package of R to evaluate the contribution of each species to the observed differences in the intestinal microbiota between the Sum and Win groups. Elevated microbial abundance mainly accounted for these differences. Proteobacteria explained most of the differences between groups, followed by Firmicutes, Bacteroidota, Actinobacteriota, and Desulfobacterota (Fig. 2b). All bacterial phyla were more abundant in the Sum than in the Win group, and their relative proportions were as follows: Firmicutes (58.40% vs. 7.62%, P < 0.0001), Desulfobacterota (2.81% vs. 0.51%, P < 0.05), Verrucomicrobiota (0.84% vs. 0.14%, P < 0.05), Chloroflexi (0.58% vs. 0.14%, P < 0.05), Deferribacterota (0.21% vs. 0.01%, P < 0.05), Nitrospirota (0.09% vs. 0.02%, P < 0.01), and TA06 (0.02% vs. 0.001%, P < 0.01) (Fig. 2d–j). However, the relative difference in Bacteroidota abundance between groups was not significant (16.24% vs. 9.27%, P > 0.05) and exhibited a decreasing trend. The relative abundance of Proteobacteria (13.92% vs. 75.34%, P < 0.0001) significantly increased after hibernation (Fig. 2c).
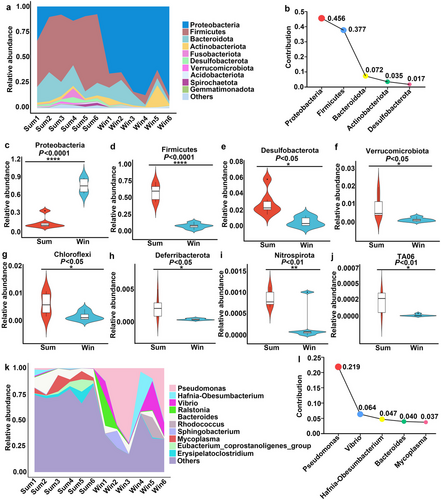
Pseudomonas was the dominant bacterial genus in the Win group followed by Hafnia-Obesumbacterium, Vibrio, Ralstonia, Bacteroides, and Rhodococcus (all > 3%) (Fig. 2k). The relative abundance of Pseudomonas was significantly lower in the Sum than in the Win group (0.62% vs. 33.78%, P < 0.05; Table S1, Supporting Information). Bacteroides was the dominant genus in the Sum group. Though its relative abundance was lower in the Win group, the difference was not significant (9.39% vs. 4.39%, P > 0.05, Table S1, Supporting Information). Table S1, Supporting Information, compares the relative abundances of the top 30 microbes in the Sum and Win groups. Overall, Pseudomonas contributed the most to the observed differences in the intestinal microbiome between groups, followed by Vibrio, Hafnia-Obesumbacterium, Bacteroides, and Mycoplasma (Fig. 2l).
We then screened for bacterial taxa exclusively present in 60% of the Sum group samples and those uniquely occurring in 60% of the Win group samples (Table S2, Supporting Information). Fifteen genera, namely, Eubacterium_fissicatena_group, Treponema, dgA-11_gut_group, SH3-11, Dinghuibacter, Anaeroplasma, Lentimicrobiaceae, Akkermansia, NS9_marine_group, Smithella, Anaerotruncus, Ercella, WCHB1-81, Subgroup_23, and Leuconostoc were detected only in the Sum group while four other genera, namely, Mucinivorans, Providencia, Flaviflexus, and Geobacillus were found exclusively in the Win group. Gram-positive bacteria predominated in the Sum group whereas gram-negative bacteria were dominant in the Win group (Fig. S1, Supporting Information). The foregoing results suggest that seasonal hibernation caused an adaptive shift in the composition of the gut microbiota of S. raddei.
Segregation of the intestinal microbiota structure
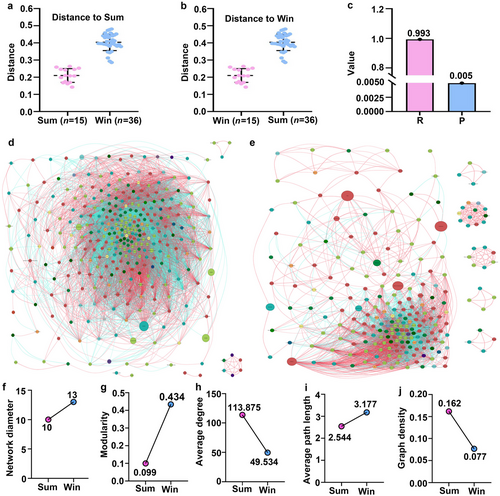
ANOSIM based on the unweighted Unifrac distance was performed to identify any significant differences between the Sum and Win groups in terms of their intestinal microbial community structure (Fig. 3a,b). The result was R < 0 (Fig. 3c), which means that the intragroup variation was not as significant as the intergroup variation. P < 0.05 indicated that the Sum and Win groups significantly differed. We subjected the bacterial taxa to Spearman's correlation index to clarify co-occurrences of the intestinal microbiota in hibernating and active S. raddei. Fig. 3d,e shows significant differences between the Sum and Win groups in terms of their network graph structure. We then compared the network graph parameters of the two groups. Fig. 3f–j shows that the network diameter, modularity, and average path length were larger while the average degree and graph density were smaller for the Win than the Sum group. Therefore, seasonal hibernation altered the intestinal microbial community structure of S. raddei.
Intestinal microbial biomarker screening and validation
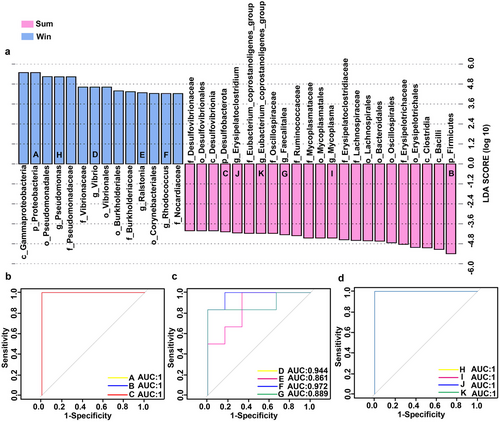
Linear discriminant analysis effect size (LEfSe) discovers and interprets high-dimensional biomarkers that can, in turn, identify taxonomic differences between groups or treatments. Hence, we used LEfSe (LDA score > 4) to explain the observed statistical differences between the Sum and Win groups. Fig. 4a shows putative biomarkers from the phylum to genus level in both groups. Three phyla significantly differed between groups. The abundance of Proteobacteria was significantly higher while those of Desulfobacterota and Firmicutes were significantly lower in the Sum than in the Win group. Eight genera significantly differed between the Sum and Win groups. Pseudomonas, Vibrio, Ralstonia, and Rhodococcus were enriched in the Win group whereas Mycoplasma, Faecalitalea, Eubacterium_coprostanoligenes_group, and Erysipelatoclostridium were enriched in the Sum group. Receiver operating characteristic (ROC) curves were plotted, and the area under the curve (AUC) was calculated to validate the reliability and evaluate the performance of these biomarkers, respectively. The AUC values for Proteobacteria, Desulfobacterota, and Firmicutes were all unity (Fig. 4b). The AUC values for all genera were > 0.8 (Fig. 4c,d). Therefore, the biomarkers had satisfactory predictive accuracy.
Functional phenotypic prediction of the intestinal microbiota of S. raddei
BugBase was used to predict the bacterial phenotypes of both groups and examine the phenotypic characteristics of the intestinal microbiota in hibernating S. raddei. The relative abundances of potentially pathogenic bacteria, stress resistance, and biofilm formation were significantly higher in the Win than in the Sum group (Fig. S2, Supporting Information). Hence, the intestinal microbiota of S. raddei had undergone an adaptive transformation during hibernation.
We used PICRUSt to predict the gut microbial function of the Sum and Win groups (Fig. S3, Supporting Information). Fifteen metabolic categories significantly differed between groups. The relative abundances of microbiota related to cellular processes and signaling (P = 0.04), lipid metabolism (P = 0.042), xenobiotic biodegradation and metabolism (P = 0.042), cell motility (P = 0.003), signal transduction (P = 0.001), metabolism of other amino acids (P = 0.004), and infectious diseases (P = 0.001) were higher in the Win than in the Sum group. The Sum group had relatively higher abundances of microbiota implicated in carbohydrate metabolism (P = 0.015), replication and repair (P < 0.001), energy metabolism (P = 0.01), translation (P < 0.001), metabolism of cofactors and vitamins (P = 0.04), nucleotide metabolism (P < 0.001), genetic information processing (P = 0.005), and cell growth and death (P = 0.002).
Intestinal metabolite profiling
QC samples were conducted to validate the reliability and accuracy of the data. Fig. S4a,b shows the Pearson's correlation coefficient between QC samples in positive and negative ion modes. As R2 ∼1, the sequencing results were reliable. A PCA was performed on the positive and negative ions in the QC and all other samples to establish the metabolite distribution trend for each group. Fig. S5a,b shows that the QC samples clustered together. The results indicated that the quality of the data was high and the testing procedure was reliably stable.
PCA was used to observe the differences between the Sum and Win groups in terms of their metabolic samples (Fig. 5a,b). The PCA score scatterplot in positive and negative ion modes showed that all Sum and Win samples were located within the 95% confidence interval (CI) (Fig. 5a,b). PC1 and PC2 explained 38.09% and 12.68% of the variation between samples in positive ion mode, respectively (Fig. 5a), and 35.62% and 14.58% of the variation between samples in negative ion mode, respectively (Fig. 5b).
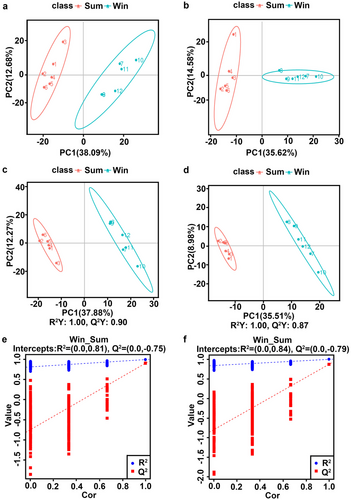
PLS–DA was used to establish the relationship between metabolite expression level and sample category and identify the latter (Fig. 5c,d). The PLS–DA score plots of the positive and negative ion modes showed that all data points were located within the 95% CI (Fig. 5c,d). This finding was consistent with that of the PCA model. As R2Y > Q2Y for both groups in both models, the latter were reliable. Two hundred permutation tests were performed to validate the PLS–DA model (Fig. 5e,f). The permutated positive ion and negative ion modes showed that all R2 regression lines were above the Q2 regression line, and the intercept of the latter and the Y-axis was < 0. Thus, the original model was reliable for data analysis (Fig. 5e,f), the PLS–DA model could effectively identify differences between the Sum and Win groups, and the intestinal metabolites profiles significantly differed between these groups.
Analysis of differentially expressed metabolites
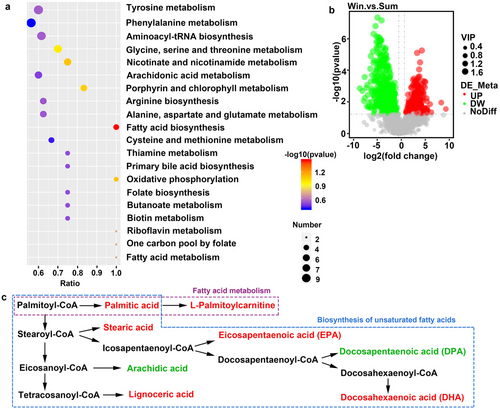
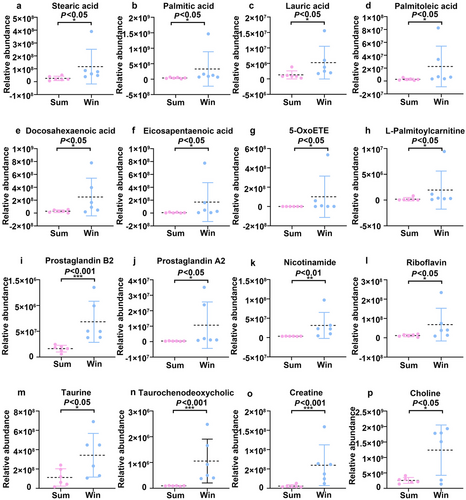
We obtained 1385 metabolites, of which 51 were differentially expressed and significantly enriched in 20 KEGG pathways (P < 0.5; Table S3, Supporting Information). The KEGG analyses showed that the DEMs between the Sum and Win groups were significantly enriched in fatty acid biosynthesis (P < 0.05; Fig. 6a). In addition, certain DEMs were enriched in fatty acid metabolism and unsaturated fatty acid synthesis (P < 0.05; Fig. 6c). The overall distribution of the DEMs was represented by volcano plots. Fig. 6b depicts the upregulated and downregulated DEMs. We also obtained 631 DEMs (P < 0.01; variable importance of projection [VIP] > 1), of which 409 were downregulated and 222 were upregulated. We focused on the changes occurring in the metabolites enriched in the top 20 KEGG pathways. The levels of saturated fatty acids (stearic acid, palmitic acid, and lauric acid) and unsaturated fatty acids (palmitoleic acid, docosahexaenoic acid [DHA], eicosapentaenoic acid [EPA], and 5-oxoETE) (Fig. 7a–g), as well as those of L-palmitoylcarnitine, prostaglandin B2, and prostaglandin A2 (fatty acid metabolites) (Fig. 7h–j), significantly increased during hibernation. In contrast, the levels of most amino acids including L-aspartic acid, L-threonine, L-tyrosine, L-phenylalanine, and methionine significantly decreased during hibernation (Table S3, Supporting Information). The levels of the tricarboxylic acid (TCA) cycle metabolites succinic acid and fumaric acid were higher in active than in hibernating S. raddei (Table S3, Supporting Information). The levels of nicotinamide and riboflavin were higher in hibernating than in non-hibernating S. raddei (Fig. 7k,i). The levels of the bile acid components taurine and taurochenodeoxycholic acid (TCDCA) (Fig. 7m,n), the amino acid derivative creatine (Fig. 7o), and the organonitrogen compound choline (Fig. 7p) were higher in hibernating than in active S. raddei. The preceding findings suggest that hibernating and non-hibernating S. raddei significantly differed in terms of their metabolite profiles.
Correlation analysis of the intestinal metabolome and microbiota
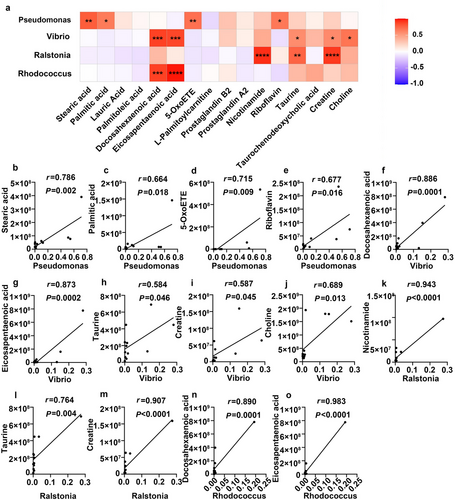
We calculated Pearson's correlation coefficient to plot a correlation matrix of the metabolites and intestinal microbiota and determine the functional relationship between them (Fig. 8a). We focused on the relationships between the significantly increased metabolites and the gut microbiota biomarkers in hibernating S. raddei. Fig. 8b–o shows the significantly positively correlated intestinal microorganisms and metabolites. Pseudomonas was positively correlated with stearic acid (r = 0.786, P = 0.002; Fig. 8b), palmitic acid (r = 0.664, P = 0.018; Fig. 8c), 5-oxoETE (r = 0.715, P = 0.009; Fig. 8d), and riboflavin (r = 0.677, P = 0.016; Fig. 8e). Vibrio was positively correlated with DHA (r = 0.886, P = 0.0001; Fig. 8f), EPA (r = 0.873, P = 0.0002; Fig. 8g), taurine (r = 0.584, P = 0.046; Fig. 8h), creatine (r = 0.587, P = 0.045; Fig. 8i), and choline (r = 0.689, P = 0.013; Fig. 8j). Ralstonia was positively correlated with nicotinamide (r = 0.943, P < 0.0001; Fig. 8k), taurine (r = 0.764, P = 0.004; Fig. 8l), and creatine (r = 0.907, P < 0.0001; Fig. 8m). Rhodococcus was positively correlated with DHA (r = 0.890, P = 0.0001, Fig. 8n) and EPA (r = 0.983, P < 0.0001; Fig. 8o). These findings indicate that the observed temporal changes in the intestinal metabolites were closely associated with those of the microbiota during S. raddei hibernation and confirmed that the gut microbiota was implicated in the metabolic regulation of hibernating S. raddei.
DISCUSSION
Hibernation is a normal physiological stage of various animal species. It usually reduces energy consumption by inhibiting metabolism (Heldmaier et al. 2004). The animal host and its intestinal microbiota are intimately connected during hibernation (Carey & Assadi-Porter 2017). The alterations that occur in the diet and environment of hibernating animals induce adaptive changes in the intestinal microbiota. Here, we observed that the intake of exogenous food by Strauchbufo raddei was interrupted during hibernation. Consequently, the richness and diversity of its gut microbiota significantly decreased at the same time. Furthermore, the composition of the intestinal microbiota markedly differed between hibernating and active S. raddei. This finding suggests that hibernation reconstructed the gut microbiome and, therefore, the metabolic processes in this amphibian.
Pseudomonas spp. are pathogenic bacteria. Certain hibernating mammals nonetheless harbor members of this genus (Tong et al. 2019; Xiao et al. 2019; Song et al. 2021). Hence, Pseudomonas may have unique functions in the intestines of hibernating animals. Pseudomonas spp. are psychrophiles that can grow and thrive at −5°C (Rashid et al. 2001) and could, therefore, enable their hosts to adjust to cold environments. Pseudomonas spp. degrade urea during hibernation (Wiebler et al. 2018) and furnish the host with a nitrogen source. In the present study, Pseudomonas spp. were significantly correlated with stearic and palmitic acids. Certain Pseudomonas spp. harbor genes encoding fat-digesting lipases that retain their catalytic activity at temperatures < 5°C (Tanaka et al. 2012; Yamashiro et al. 2013). Pseudomonas spp. may participate in the energy metabolism of hibernating S. raddei by secreting cryotolerant lipase. We observed that Vibrio spp. and Rhodococcus spp. are also active in low-temperature environments. DHA and EPA were produced by certain Vibrio spp. isolated from marine organisms inhabiting cold waters (Abd Elrazak et al. 2013; Estupinan et al. 2020). Rhodococcus spp. generate fatty acids under various harsh conditions (de Carvalho 2012; de Carvalho et al. 2014). Here, the gut microbiota of hibernating S. raddei was enriched with various functional categories of bacteria associated with lipid metabolism. In this manner, the gut microbiota might facilitate metabolic energy generation in the host. These discoveries suggest that gut microbiota may mediate various types of metabolic activity in hibernating S. raddei. However, future studies should perform shotgun metagenomics sequencing to characterize the functions of the gut microbiota during S. raddei hibernation.
Firmicutes was the most abundant phylum in the intestines of non-hibernating (active) S. raddei and other amphibian taxa (Xu et al. 2020; Huang & Liao 2021). Most amphibians have similar predatory behavior and living habits. Obesity and lipid storage are associated with a high relative abundance of Firmicutes in the gut (Turnbaugh et al. 2008; Carey & Assadi-Porter 2017). High-fat diets increase the relative abundance of intestinal Firmicutes (Daniel et al. 2014; Schulfer et al. 2019). Strauchbufo raddei accumulates fat during predation and maintains its energy homeostasis during fasting through lipid metabolism. In the intestines of many animal species, the relative abundance of Bacteroidota increases during hibernation as these bacteria degrade endogenous substances (Sommer et al. 2016; Tang et al. 2019; Tong et al. 2020). Here, however, Bacteroidota abundance nonsignificantly decreased during S. raddei hibernation. Hibernating and non-hibernating S. raddei markedly differed in terms of the profiles of their gut microbiota. Though the predominant bacterial taxa differ in the intestines of hibernating and active S. raddei, the genes of these microorganisms are nonetheless conserved under both environmental conditions/life stages.
The host retains its core gut bacteria even under various environments and at different stages of development (Tong et al. 2020; Xu et al. 2020). Though the relative intestinal abundances of Firmicutes, Bacteroidota, and Proteobacteria differed between hibernating and non-hibernating S. raddei, they nonetheless predominated at all times. We hypothesized that the host and gut microbiota were significantly related and S. raddei selected for the most suitable gut microbiome during evolution to facilitate their adaptation to environmental changes. The gut microbiota of hibernating S. raddei was more stress-resistant and had significantly higher biofilm formation capacity than that of active S. raddei. The biofilm secreted by certain bacteria enables them to cope with extreme environments (de la Fuente-Nunez et al. 2013; Shi et al. 2020). In the present work, the microbiota structurally adjusted to the harsh physical conditions within its hibernating S. raddei host.
As hibernating animals lack exogenous food, they must rely on endogenous substances and lower their metabolic levels to maintain energy balance. Consequently, the metabolite profiles of active and hibernating animals substantially differ. Here, 64.8% of the differentially expressed metabolites, including most amino acids and the TCA cycle intermediates succinic acid and fumaric acid, were significantly downregulated in hibernating S. raddei. The absence of exogenous dietary protein intake during hibernation ultimately leads to a decrease in the overall amino acid levels. The foregoing results suggest that metabolism was inhibited during S. raddei hibernation.
Numerous hibernating animal species accumulate abundant fat during their active periods and rely mainly on their stored fat as an energy source during fasting (Costanzo et al. 2013; Xiao et al. 2019; Blanco et al. 2021). Fatty acid biosynthesis is the first differentially expressed metabolic pathway in both hibernating and active S. raddei. Certain polyunsaturated fatty acids (PUFAs) and saturated fatty acids were significantly enriched in hibernating S. raddei. Fatty acids in general, and PUFAs in particular, are the principal fuel sources for hibernating animals as they have a low melting point and are readily metabolized even at low temperatures (Blanco et al. 2022). PUFAs may also protect mammalian hearts in cold environments. High n-6: n-3 PUFA ratios maintain cardiomyocyte contraction at low temperatures (Ruf & Arnold 2008). S. raddei abounds in certain substances such as taurine, choline, creatine, and riboflavin that support lipid metabolism during hibernation. The relative concentrations of these compounds significantly increased during S. raddei hibernation. Taurine is essential for energy metabolism in animals (Wen et al. 2019). Certain oral doses of taurine lowered the triglyceride, hepatic cholesterol, and serum total cholesterol levels in rats (Wang et al. 2020). Thus, taurine supports lipid metabolism. Dietary choline deficiency altered lipid metabolism in lactating rats (da Silva et al. 2015). Adipose tissue may require creatine for energy consumption (Kazak et al. 2015). Riboflavin is a precursor to flavin adenine dinucleotide and flavin mononucleotide which are cofactors for succinate dehydrogenase and acyl-CoA dehydrogenase during fatty acid oxidation in the TCA cycle (Yoshii et al. 2019). We speculated that riboflavin may promote fatty acid oxidation and maintain the supply of metabolic energy during S. raddei hibernation.
Hibernating animals cannot acquire their external food sources, and fasting alters the structure of the intestinal microbiota in hibernating animals (Tang et al. 2019). Hibernation may expose animals to pathogens (Weng et al. 2016). We postulated that hibernating S. raddei protect themselves against pathogenic bacteria and maintain the homoeostasis of their intestinal immunity with various immunomodulatory substances. The levels of nicotinamide and the major bile acid constituent TCDCA were significantly higher in hibernating than in active S. raddei. Nicotinamide maintains immune homoeostasis by regulating the host immunocytes with anti-inflammatory effects (Yoshii et al. 2019). TCDCA is vital for immunological and anti-inflammatory modulation (Li et al. 2019; Qi et al. 2020). Certain PUFAs such as DHA and EPA may have anti-inflammatory efficacy (Calder 2008; Calder 2015). During hibernation, the animal and gut immune systems may be suppressed and reconstituted, respectively (Bouma et al. 2010; Reitsema et al. 2021). S. raddei may have developed adaptive strategies to cope with external pathogens and weakened immunity during hibernation. Nevertheless, the specific immune responses in hibernating S. raddei remain to be clarified by detecting inflammatory factors in the serum and gut.
CONCLUSIONS
The present work used an artificial hibernation model to explore the adaptive changes that occur in the gut microbiota of hibernating S. raddei. There were significant differences between hibernating and active S. raddei in terms of the diversity and composition of their intestinal microbiomes. Furthermore, hibernation significantly inhibited intestinal bacterial metabolism in S. raddei. We observed a significant positive correlation between the gut microbiota and their metabolites during hibernation. Hence, intestinal bacteria might play a vital role in the metabolic activity of hibernating S. raddei. Nevertheless, future investigations should endeavor to elucidate the specific metabolic and other functions of the gut microbiota during S. raddei hibernation. To the best of our knowledge, the present research is the first to (1) clarify how the gut microbiota and intestinal metabolites of S. raddei respond to changes in the external environment, and (2) provide insights into gut microbiota–host co-evolution in amphibians.
ACKNOWLEDGMENTS
The funding of this work was supported by the National Natural Science Foundation of China (Grant No. 31471953).


