Genetic diversity of Riptortus pedestris (Hemiptera: Alydidae) populations in the Republic of Korea based on COI sequence
Abstract
Riptortus pedestris (Fabricius) has caused severe agricultural damage in Asian regions. To clarify genetic relationships among different populations of R. pedestris in Korea, 294 COI sequences were generated from 294 individual samples collected in 42 local regions. In total, 36 haplotypes were detected from the 294 COI sequences, and the genetic distances among the 42 local populations ranged from 0.00 % to 1.50 %. In the AMOVA results, a variability of more than 98 % was observed within populations, and the median joining (MJ) networks revealed that R. pedestris has expanded by crossing the nine geographical groups. Most of the samples shared one haplotype, H2; however, some samples obtained from the same regions displayed slight genetic differences. These results indicate that R. pedestris have undergone a series of genetic variations.
Introduction
The soybean bug, Riptortus pedestris (Fabricius 1775) (Hemiptera: Alydidae), is one of the most important pests in soybean crops and is widely distributed in Asian regions including Korea, Japan, China, Taiwan, Thailand, Indonesia, Malaysia, Sri Lanka, Myanmar, and India (Kikuhara 2005). This species has been known to feed on a wide range of host plants (Chung et al. 1995; Son et al. 2000; Lim & Mahmoud 2009) and overwinter as an adult in the litter layers of deciduous plants. In addition, two or three generations are possible according to climate and host plants conditions (Lee et al. 1997; Tabuchi & Ito 2004; Moriya 2005). Recently, population genetic studies have provided useful information in designing pest control and management programs (Roderick 1996; Meeyen et al. 2014). For example, the sterile insect technique (SIT) generally uses the mass release of sterile insects to compete for mating with the fertile wild population and thus reduces abundance of the next generation of the target pest (Meeyen et al. 2014). For successful implementation of SIT, it is important to know information about individual movement across populations and effective population size, which can be deduced from population genetic studies (Aketarawong et al. 2011; Karsten et al. 2013; Meeyen et al. 2014). Currently, a limited number of nucleotide sequences have been reported for R. pedestris. It indicates that there is no available information to estimate genetic variation and structure of R. pedestis that can be applied for designing pest control and management programs.
In Korea, one species, R. pedestris, has been recorded in the genus Riptortus Stål, 1859. However, because this genus has an abundance of intraspecific variations and sexual dimorphism, it is difficult to identify Riptortus species, inducing complex taxonomic histories in Riptortus spp. such as R. pedestirs (Fabricius 1775; Thunberg 1783; Fabricius 1798; Stål 1868; Stål 1873; Distant 1902; Hsiao 1964). Thus, it would be necessary to re-examine morphology of the R. pedestris in Korea and may require molecular studies to understand genetic variation among and within populations.
Currently, the DNA barcode is considered to be the most advantageous for species identification in hemipteran groups (Armstrong & Ball 2005; Lee et al. 2011; Lee et al. 2012; Lee et al. 2013; Lee & Akimoto 2015), and cytochrome oxidase subunit I (COI) sequences have been also commonly applied to elucidate the genetic structure and phylogenetic relationships among members in insect groups (Meeyen et al. 2014). Thus, in this study, 294 individual samples collected from 42 local regions were re-identified based on morphological characteristics and 294 COI sequences were newly analyzed for examining genetic diversity of this species in Korea.
Materials and methods
A total of 294 individual samples had been collected at 42 localities in South Korea during 2012 and 2013 (Supporting information, Table S1). Sampling was conducted by aggregation pheromone trap for over-wintered population of R. pedestirs from late-March to mid-June. The cylindrical fish net (diameter 14 cm, length 28 cm) and commercial lure (Greenagrotech, Korea) was used for making an aggregation pheromone trap. The composition of (E)-2-hexenyl (Z)-3-hexenoate (E2HZ3H), (E)-2-hexenyl (E)-2-hexenoate (E2HE2H), Tetradecyl isobutyrate (TI), and octadecyl isobutyrate (OI) was 5.5, 27.6, 38.7, and 14.3 % respectively. The pheromone trap was installed 1.2 m above the ground with plastic pole and adults caught in the trap were collected 2–4 weeks later. All 294 individual samples were identified based on morphological characteristics (Kikuhara 2005).
Genomic DNA extraction was performed using DNeasy Blood & Tissue Kit (QIAGEN Inc., Dusseldorf, Germany), according to the manufacturer's protocol. Samples for extraction consisted of single individual from the same colony. PCR amplification was conducted with one primer set, Primer F (5′-GGA ATA GTA GGA TCA TCT TTA AG-3′) and Primer R (5′-TCC ACC TCC TGT TGG GTC AAA-3′) (designed in this study), using AccuPower PCR PreMix (Bioneer, Seoul, Korea). The first round of amplification employed touchdown PCR using an initial denaturation step at 94°C for 5 min, followed by 21 cycles at 94°C denaturation for 1 min, 60°C to 50°C annealing for 1 min (the temperature was reduced by 0.5°C after each cycle), and 72°C elongation for 1 min. An additional 19 cycles at 94°C denaturation for 1 min, a constant annealing temperature of 55°C, and 72°C elongation for 1 min were performed prior to the final extension step at 72°C for 10 min. PCR products were visualized on agarose gels after electrophoresis. Single bands were purified using a QIAquick PCR purification kit (QIAGEN). PCR products were sequenced in both directions by ABI 3730xl sequencer (Applied Biosystems, Foster City, CA, USA). Resulting chromatograms were evaluated for miscalls and ambiguities and assembled into contigs in SeqManTMPro (version 7.1.0, 2006; DNAstarInc., Madison, WI, USA). The sequences were visually checked individually for protein coding frame-shifts to avoid pseudogenes (Zhang & Hewitt 1996). Consensus files were aligned using Clustal X 1.83 (Thompson et al. 1997). All sequences are deposited in the GenBank (http://www.ncbi.nlm.nih.gov/genbank) (accession numbers given in Supporting information, Table S1).
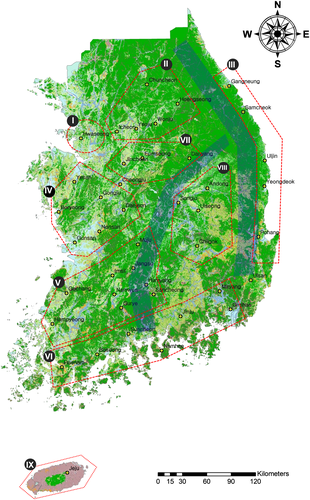
The alignment of COI sequences was conducted by Clustal X 1.83 (Thompson et al. 1997) at the default parameter settings. Small changes were made to the alignment. The hyper-variable regions were excluded from further analysis because of the ambiguity of the alignment (Swofford et al. 1996). Pairwise sequence divergences between the 294 COI sequences for each were calculated using a Kimura's 2-parameter (K2P) distance model (Kimura 1980) in MEGA 5.0 (Tamura et al. 2011). Unique haplotypes were identified using ARLEQUIN ver. 3.5. Descriptive statistics (number of variable sites, number of haplotypes, haplotype diversity, nucleotide diversity, and average number of nucleotide differences between haplotypes) were calculated using DNASP ver. 5.0. An AMOVA hierarchical analysis of variance was performed using ARLEQUIN to partition the total variance in its components among groups, among populations, and within populations based on the groups inferred by the AMOVA analysis. The 42 localities' populations were clustered as nine groups (I-IX) categorized based on geographical features and climate regions in the South Korea, which was suggested by Park and Hyun (1990) (Fig. 1): I (Hwaseong), II (Chuncheon, Wonju, Hoengseong, Icheon, and Yeoju), III (Gangneung, Pohang, Samcheok, Uljin, and Yeongdeok), IV (Boryeong, Daejeon, Gongju, Gunsan, Nonsan, Yesan, and Cheongwon), V (Gochang, Gurye, Hampyeong, Hamyang, Imsil, Jangsu, Muju, Namwon, and Sancheong), VI (Boseong, Gimhae, Haenam, Jinju, Namhae, Suncheon, and Miryang), VII (Jincheon, Danyang, and Eumseong), VIII (Andong, Chilgok, Sangju, and Uiseong), and XI (Jeju). To examine genetic relationships among haplotypes, the median joining (MJ) networks of the haplotypes of the COI sequences was constructed using NETWORK ver. 4.6.

Results and Discussion
A total of 294 COI sequences were successfully amplified from the 294 samples of R. pedestris populations. Several base pairs were removed because of ambiguous alignment, which resulted in a final count of 402 bp. From the 294 COI sequences, 36 variable sites were observed at nucleotide positions (15, 30, 34, 39, 42, 54, 58, 60, 84, 87, 111, 132, 136, 156, 159, 160, 171, 198, 200, 213, 215, 234, 251, 252, 258, 273, 351, 357, 358, 366, 370, 372, 377, 381, 387, and 393) (Supporting information, Table S2).
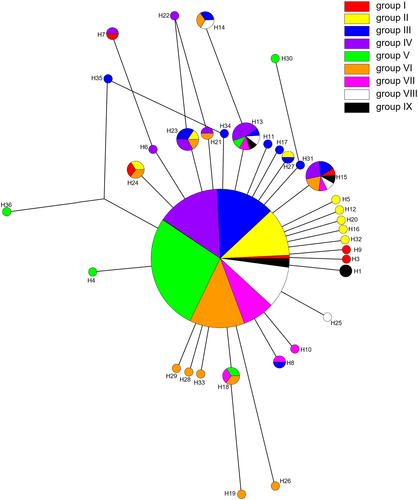
In total, 36 COI haplotypes were detected from the 294 COI sequences. In this study, the 42 localities' populations were clustered as nine geographical groups (I–IX) categorized based on geographical features and climate regions, which was suggested by Park and Hyun (1990) (Fig. 1; Supporting information, Table S3): I (Hwaseong), II (Chuncheon, Wonju, Hoengseong, Icheon, and Yeoju), III (Gangneung, Pohang, Samcheok, Uljin, and Yeongdeok), IV (Boryeong, Daejeon, Gongju, Gunsan, Nonsan, Yesan, and Cheongwon), V (Gochang, Gurye, Hampyeong, Hamyang, Imsil, Jangsu, Muju, Namwon, and Sancheong), VI (Boseong, Gimhae, Haenam, Jinju, Namhae, Suncheon, and Miryang), VII (Jincheon, Danyang, and Eumseong), VIII (Andong, Chilgok, Sangju, and Uiseong), and XI (Jeju). Among the nine groups, group III and group VI included the highest number of 12 haplotypes ((H2, H8, H11, H13–15, H17, H23, H27, H31, and H34–35) and (H2, H14–15, H18–19, H21, H23–24, H26, H28–29, and H33), respectively), and nine haplotypes (H2, H5, H12, H16, H20, H23–24, H27, and H32) were detected from one group II. Among the 42 local populations, three populations, Hwaseong, Chuncheon, and Daejeon, shared six haplotypes ((H2–3, H7, H9, H15, and H24), (H2, H5, H23–24, H27, and H32), and (H2, H6–7, H13, H15, and H21), respectively). In addition, two populations, Pohang and Namhae, included five haplotypes ((H2, H14–15, H17, and H23) and (H14, H19, H21, H24, and H33), respectively). Totally, 29 populations had more than two haplotypes; whereas, the remaining 13 populations (of Yeoju, Wonju, Hoengseong, Uljin, Nonsan, Hamyang, Hampyeong, Imsil, Jangsu, Sancheong, Gimhae, Haenam, and Uiseong) included only one haplotype, H2. The H2 was detected in all local populations of the nine geographical groups.
The H2 was the predominant haplotype in Korea with a frequency of 0.765 (Supporting information, Table S4). On the other hand, 24 haplotypes (H3–6, H9–12, H16–17, H19–20, H22, H25–26, and H28–36) had the lowest frequencies of 0.003. Among the 42 populations, Miryang population had the highest haplotype diversity (1.000), and Hwaseong population had the highest nucleotide diversity (0.00452). The average number of nucleotide differences from the 294 COI sequences was 0.550 for this species. The genetic distances among the various populations varied from 0.00 % to 1.50 %, with an average value 0.14 %. These results revealed that R. pedestris had genetic differentiation among the populations in Korea.
The AMOVA revealed that a portion of genetic differentiation was partitioned among groups (0.97 % based on COI sequences) and among populations within groups identified (0.30 %), whereas excessive genetic differentiation was observed within populations (98.73 %) (Table 1). Differentiation was highly significant within populations (FST).
| Source of variation | d.f. | Sum of squares | Variance components | Percentage of variation | Fixation indices |
|---|---|---|---|---|---|
| Among groups | 8 | 2.895 | 0.00266 Va | 0.97 | FCT = 0.00967 |
| Among populations within groups | 33 | 9.162 | 0.00083 Vb | 0.3 | FSC = 0.00304* |
| Within populations | 252 | 68.525 | 0.27193 Vc | 98.73 | FST = 0.01268** |
| Total | 293 | 80.582 | 0.27542 |
- * P < 0.05;
- ** P < 0.01.
The MJ networks were analyzed from the 36 haplotypes (Fig. 2). Among the 36 haplotypes, H2 was detected from all nine geographical groups; whereas, H15 and H13 were observed in seven groups (I, III, IV, and VI–IX), and six groups (III–V and VII–IX), respectively. On the other hand, H14, H18, H24, and H23 were detected from three or four geographical groups in each, and the rest 29 haplotypes were found from one or two groups, respectively.

This study is the first to report genetic information of R. pedestris distributed in Korea by using the COI sequences. From the 294 individual samples, a total of 36 COI haplotypes were characterized by 36 variable sites, and the 294 COI sequences revealed genetic variations ranged from 0.00 % to 1.50 %. In the AMOVA results, a variability of more than 98 % was observed within populations, and the MJ networks revealed that R. pedestris has expanded by crossing the nine geographical groups. Most of the samples shared one haplotype, H2; however, some samples obtained from the same regions displayed slight genetic differences. These results indicate that R. pedestris has undergone a series of genetic variations.
In this study, we tried to examine genetic structures of R. pedestris in Korea by a large scale of collections. However, to understand the in-depth genetic differentiation and structure of the species, we should collect more samples from all regions in Korea where R. pedestris exist and use more types of markers. These studies will help us understand the spread history, spread pattern, and source of R. pedestis populations in Korea. In addition, this molecular evolution and ecological information of R. pedestris may help us elucidate the speciation pathway.
Acknowledgments
This study was carried out with the support of Cooperative Research Program for Agricultural Science & Technology Development (Project No. PJ 011756), Rural Development Administration, Republic of Korea.


