Comparison Between the Internal and External Pressure Filtration Method of Cell-Free and Concentrated Ascites Reinfusion Therapy Using the Same Cancerous Ascites
Abstract
Cell-free and concentrated ascites reinfusion therapy (CART) by internal filtration pressure method (internal method) and external filtration pressure method (external method) using the same cancerous ascites was performed. The rate of rise in circuit pressure and recovered components were compared between the two methods. The factors related to circuit pressure rise were also researched. In both methods, circuit pressure rose in 50% of cases. The recovery rates of IgG, IgA, IgM, and haptoglobin were significantly higher for the internal method than for the external method, whereas the recovery rate of α1-antitrypsin was significantly lower in the internal method than in the external method. The levels of IL-6, haptoglobin, α1-antitrypsin, and fibrinogen/fibrindegradation products (FDP) in the original ascites were significantly higher in the group wherein circuit pressure rose than in that without circuit pressure rise. These proteins might be related to the rise in circuit pressure.
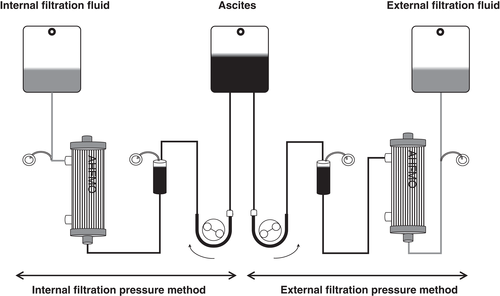
Cell-free and concentrated ascites reinfusion therapy (CART) is one of the treatments for refractory ascites. Symptoms caused by ascites may be relieved and the urinary volume could be increased by CART 1-4. Clogging of the filter is one of the major problems associated with CART. Modification of the circuit design or washing of the membrane has been used to avoid clogging 5. CART is classified based on the filtration method and the driving force. The filtration method includes internal pressure filtration method (internal method) and external pressure filtration method (external method), and the driving force includes negative pressure, pump, and gravity. Few studies comparing the different methods using the same ascites have been reported 6. In this study, we performed CART by the internal and external methods using the same cancerous ascites and compared the circuit pressure and the solute recovery rate.
PATIENTS AND METHODS


Data analyses were performed using the Statistical Package for Social Science (spss), version 25.0 for Windows (SPSS, Chicago, IL, USA). Continuous data were expressed as median and interquartile range. Continuous data were analyzed by Mann–Whitney’s U-test or Wilcoxon’s signed-rank test, whereas categorical data were analyzed by chi-square test. P value less than 0.05 was considered significant.
Our study was approved by the ethics committee of Fujita Health University School of Medicine (UMIN registration number UMIN000025382).
RESULTS
Characteristics of the participants
Table 1 shows the patient backgrounds and details of the original ascites. The cancer types included 12 gynecological cases, two gastrointestinal cases, one pancreatic case, and one peritoneal case. The weight of the original ascites was 3146 (2493–3778) g.
| Patient backgrounds (N = 11) | |
|---|---|
| Male/Female | 1/10 |
| Age (years) | 67.0 (52.5–74.0) |
| Types of cancer | Gynecological, 7 patients; gastrointestinal system, 2 patients; pancreas, 1 patient; peritoneum, 1 patient |
| Details of original ascites (N = 16) | |
| Weight (g) | 3146 (2493–3778) |
| Types of cancer | Gynecological, 12 cases; gastrointestinal system, 2 cases; pancreatic, 1 case; peritoneal, 1 case |
| Appearance | 9 bloody, 7 nonbloody cases |
| Total protein (g/dL) | 3.8 (3.1–4.0) |
| Albumin (g/dL) | 1.34 (1.25–1.73) |
| IL-6 (pg/mL) | 21 700 (6000–37 425) |
| IgG (mg/dL) | 546 (438–674) |
| IgA (mg/dL) | 102 (89–134) |
| IgM (mg/dL) | 25 (19–35) |
| FDP (μg/mL) | 1935 (1288–2673) |
| Haptoglobin (mg/dL) | 132 (62–205) |
| α1-Antitrypsin (mg/dL) | 216 (160–364) |
| Fibrin monomer complex (μg/mL) | 180 (143–198) |
- FDP, fibrinogen/fibrindegradation products.
Solute recovery rate of each filtration method
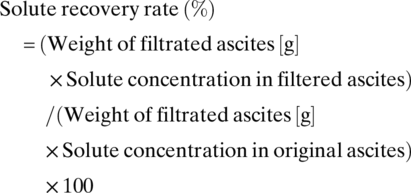
The filtrated weight was 1514 (1175–1749) g for the internal method and 1496 (1170–1683) g for the external method, and no significant difference was observed between the two filtration methods (P = 0.605). The solute recovery rates of each filtration method are shown in Table 2. The recovery rate of albumin was 66.7% (57.9–70.3%) for the internal method and 62.6% (50.1–66.8%) for the external method; thus, there was no significant difference (P = 0.24). The recovery rate of immunoglobulin fraction protein was as follows: IgG, internal method 59.1% (46.1–63.9%) and external method 54.8% (42.5–59.2%) (P = 0.003); IgA, internal method 62.1% (48.2–65.3%) and external method 55.5% (43.5–59.6%) (P = 0.005); and IgM, internal method 47.8% (38.3–55.1%) and external method 37.2% (29.6–43.7%) (P = 0.001). Thus, concerning immunoglobulin, the recovery rates by the internal method were significantly higher than those by the external method. The recovery rates of fibrinogen/fibrindegradation products (FDP) and haptoglobin were also higher by the internal method than by the external method (P = 0.006 and P < 0.001, respectively). On the contrary, the recovery rate of α1-antitrypsin by the internal method was 12.7% (8.7–13.7%) and was significantly lower than that by the external method 62.0% (53.0–65.7%) (P < 0.001).
| Recovery rate (%) | |||
|---|---|---|---|
| Internal filtration pressure method (N = 16) | External filtration pressure method (N = 16) | P-value | |
| Total protein | 57.2 (45.8–61.9) | 52.6 (44.4–58.7) | 0.32 |
| Albumin | 66.7 (57.9–70.3) | 62.6 (50.1–66.8) | 0.24 |
| IL-6 | 63.9 (52.7–65.1) | 62.5 (52.8–65.3) | 0.59 |
| IgG | 59.1 (46.1–63.9) | 54.8 (42.5–59.2) | 0.003 |
| IgA | 62.1 (48.2–65.3) | 55.5 (43.5–59.6) | 0.005 |
| IgM | 47.8 (38.3–55.1) | 37.2 (29.6–43.7) | 0.001 |
| FDP | 30.1 (21.5–43.6) | 26.4 (20.3–32.7) | 0.006 |
| Haptoglobin | 57.5 (40.0–61.2) | 45.5 (33.1–54.5) | <0.001 |
| α1-Antitrypsin | 12.7 (8.7–13.7) | 62.0 (53.0–65.7) | <0.001 |
As for fibrin monomer complex, the levels in the filtrated ascites were higher than those in the original ascites in 14 out of 16 cases in both filtration methods. In 11 out of 14 cases, the value was above 250 μg/mL, which is the upper limit of the measurable scale, and therefore, the recovery rate could not be calculated for the fibrin monomer complex.
Sieving coefficient of solute
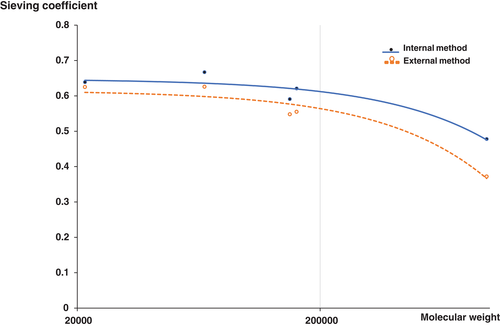
Figure 2 shows the sieving coefficient of solutes obtained based on the results for albumin, IL-6, IgG, IgA, and IgM. There were differences in the sieving coefficient between the internal and external methods as molecular weight increased.

Changes in circuit pressure
Figure 3 shows the flow diagram according to the circuit pressure. The circuit pressure rose above 100 mmHg in eight of 16 cases. For four of eight cases, the circuit pressure rose earlier in the internal method than in the external method. For the remaining four cases, the circuit pressure rose earlier in the external method than in the internal method. When the circuit pressure in the internal method rose above 100 mmHg first, the circuit pressure in the external method also rose above 100 mmHg subsequently. On the other hand, when the pressure in the external method rose above 100 mmHg first, only one case from the internal method showed a rise in circuit pressure above 100 mmHg subsequently. In the remaining three cases, the rise in the circuit pressure was below 100 mmHg.

Comparison between rise group and nonrise group
Backgrounds and details of original ascites in the rise group and nonrise group were compared (Table 3). Seven cases in the rise group and two cases in the nonrise group were of bloody ascites (P = 0.042). There were no significant differences in cell counts, albumin, and immunoglobulin between the two groups. The levels of total protein, IL-6, FDP, haptoglobin, and α1-antitrypsin were significantly higher in the rise group than in the nonrise group. Total protein, 3.8 (3.7–5.0) g/dL versus 3.1 (2.5–3.8) g/dL, P = 0.028; IL-6, 31 900 (21 550–38 025) pg/mL versus 5950 (2608–21 905) pg/mL, P = 0.008; FDP, 2575 (2043–3220) μg/mL versus 1205 (661–1868) μg/mL, P = 0.021; haptoglobin, 216 (115–307) mg/dL, 60 (31–135) mg/dL, P = 0.046; α1-antitrypsin, 414 (231–569) mg/dL versus 154 (102–199) mg/dL, P < 0.001, rise group versus nonrise group, respectively. In contrast, the levels of fibrin monomer complex in the rise group (139 [122–175 μg/mL]) were significantly lower than those in the nonrise group (201 [186–250] μg/mL) (P = 0.001).
| Nonrise group (N = 8) | Rise group (N = 8) | P-value | |
|---|---|---|---|
| Gender (M/F) | 1/7 | 0/8 | 1.000 |
| Age (years) | 67.5 (57.5–74.3) | 55.0 (50.0–55.0) | 0.138 |
| Gynecological, N = 5 | Gynecological, N = 7 | ||
| Gastrointestinal tract, N = 1 | Gastrointestinal tract, N = 1 | ||
| Pancreatic, N = 1 | |||
| Peritoneal, N = 1 | |||
| Filtrated ascites weight (g) | 1605 (1528–1696) | 1247 (1149–1436) | 0.115 |
| Appearance | Bloody, N = 2 | Bloody, N = 7 | 0.042 |
| Non bloody, N = 6 | Non bloody, N = 1 | ||
| Cell counts (/μL) | 502 (128–913) | 613(248–722) | 1.000 |
| Total protein (g/dL) | 3.1 (2.5–3.8) | 3.8 (3.7–5.0) | 0.028 |
| Albumin (g/dL) | 1.30 (1.11–1.70) | 1.40 (1.24–1.74) | 0.645 |
| IL-6 (pg/mL) | 5950 (2608–21 905) | 31 900 (21550–38 025) | 0.008 |
| IgG (mg/dL) | 540 (317–942) | 546 (469–614) | 1.000 |
| IgA (mg/dL) | 94 (55–135) | 108 (97–138) | 0.279 |
| IgM (mg/dL) | 20 (11–37) | 27 (23–39) | 0.234 |
| FDP (μg/mL) | 1205 (661–1868) | 2575 (2043–3220) | 0.021 |
| Haptoglobin (mg/dL) | 60 (31–135) | 216 (115–307) | 0.046 |
| α1-Antitrypsin (mg/dL) | 154 (102–199) | 414 (231–569) | <0.001 |
| Fibrin monomer complex (μg/mL) | 201 (186–250) | 139 (122–175) | 0.001 |
- FDP, fibrinogen/fibrindegradation products.
DISCUSSION
Here, CART by internal and external filtration pressure methods using the same cancerous ascites was performed. Previously, Hata et al. compared the two filtration methods using the same ascites from hepatic cirrhosis patients 6. This is the first report comparing internal method and external method using the same cancerous ascites. No difference was found in the rate of circuit pressure rise, while the recovery rate of solutes was different between the two methods. The recovery rates of haptoglobin and immunoglobulin were significantly higher for the internal method than for the external method. As shown in Figure 2, the pore distribution is different between the internal method and the external method, despite the fact that the same membrane was used. This might be related to the difference in the recovery rate. The recovery rate of α1-antitrypsin by the internal method was significantly lower than that by the external method. α1-Antitrypsin is a low molecular weight protein, with a molecular weight of 51 KD and a serine protease inhibitor 7. The levels of α1-antitrypsin might decrease in the filtrated ascites because it bound to serine protease. If α1-antitrypsin bound to neutrophil elastase 8, one of the serine proteases, the levels of elastase in the filtered ascites would have decreased. Examining the levels of elastase is the focus of our future studies. In both methods, the levels of FDP were lower and soluble fibrin monomer complex were higher in the filtrated ascites than in the original ascites. Upregulation of coagulation system and downregulation of fibrinolysis might be triggered during the filtration process. Another possibility is that a portion of the FDP was captured by the fibrin clots.
We set the cut-off value of rise group as 100 mmHg because the filtration pressure is recommended to be maintained under 100 mmHg in the case of bloody ascites according to the attached document. In a comparison between the rise group and nonrise group, the levels of acute phase proteins such as haptoglobin, α1-antitrypsin, and the inflammatory cytokine, IL-6 were higher in the rise group than in the nonrise group. As a result of the inflammatory reaction, these acute phase proteins increase, leading to a high total protein concentration, which might be related to clogging and a rise in circuit pressure. As for the coagulation fibrinolysis system, the levels of FDP were higher and fibrin monomer complex were lower in the rise group. Elevated FDP might reflect elevated levels of fibrinogen and fibrin, which cause clot formation. Other markers such as fibrinogen, thrombin antithrombin complex, and plasmin-alpha2-plasmininhibitor-complex will be needed to evaluate the coagulation fibrinolysis system correctly. Although heparin was not used in this study, heparin was added to the collection bag at a frequency of 26.6% in postmarketing surveillance 1. Since the coagulation system is suppressed by adding heparin, the increase in the fibrin monomer complex might be suppressed.
CONCLUSIONS
From this study, either method will lead to similar effects in terms of the circuit pressure rise and albumin recovery rate. The internal pressure method might be preferable under conditions where γ-globulin is decreased, while the external method might be preferable under conditions where α1-antitrypsin is decreased.
Conflict of Interest
Asahi Kasei Medical Co., Ltd. partly helped with the ascites component analysis and examination fee.


