Observations of Local-Distance P/S Amplitude Ratios from Deep Mine and Natural Seismic Sources: Implications for Seismic-Source Discrimination
ABSTRACT
For this investigation, we exploit local-distance P- and S-wave observations generated by mining-related and small-magnitude events in the Klerksdorp, Orkney, Stilfontein and Harteesfontein (KOSH) mining region of South Africa to explore the robustness and variability of low-yield P-to-S-wave amplitude ratios. P/S amplitude ratios are traditionally used in discrimination studies between earthquakes and explosions recorded at regional and teleseismic distances ( 200 km) and for relatively large magnitude events. Few studies have explored the variability of P/S amplitude ratios using data recorded at local distances, distances 200 km, where more scrutiny of wave propagation, near-surface geology, and source and strain release patterns is required. We took advantage of the dense surface accelerometer cluster network, KOSH, for our variability analysis. Final results show that most of the locally recorded low-magnitude events in the Klerksdorp region have comparable shear wave energy to low-magnitude earthquakes. Consequently, our time-domain rms-based P and S amplitude measurements result in stable event average P/S ratios likely to separate from explosive sources. We demonstrate the expected variability of the ratios with smaller network simulations (three-, five-, seven-station) to show that ratios remain relatively stable between 1 and 30 Hz.
1 Introduction
Discriminating explosions, also referred to as controlled blasts, from other seismic source types have been investigated at great length throughout the history of seismic monitoring. Although each seismic event is to some extent unique, predictable waveform characteristics allow us to classify broad categories of seismic source types (e.g., earthquake, explosion). Many earthquake–explosion discriminants rely on the amplitude ratio of P- and S- waves, which differ as a result of the strong shear-wave energy radiated by earthquakes and the weak shear-wave energy radiated by explosions. Such P/S amplitude ratios have proved a useful discriminant for high-yield events recorded at regional and teleseismic distances (Sykes and Evernden 1982; Taylor et al. 1988; Koper 2019), but fewer studies have tested the P/S discriminant performance on smaller, low-yield events observed at local distances ( 200 km), we adopt the definition of local distance used by Jost and Herrmann (1989). At these shorter distances, seismic signals exhibit substantial variability and suffer less attenuation and path averaging effects (Pyle and Walter 2019), which makes it difficult to attribute discriminant performance to propagation differences or to source effects (Zhang et al. 2002). Studies that have emerged in recent years (O'Rourke et al. 2016; Pyle and Walter 2019) suggest that source and propagation effects at local distances are complex and require additional investigation. Local distance discrimination may also need to be customized for different regions (Koper 2019). Thus, the procedures that have been historically used and work well at regional and teleseismic distances must be re-evaluated as we move to small event thresholds that can only be observed from short-distance and short-period observations.
Seismic sources in active mining regions are often categorized with in-mine observations and high-frequency S-to-P-wave energy ratios (e.g., Gibowicz 1996; Masethe et al. 2023; Kwiatek and Ben-Zion 2013), again relying on the fact that shear-faulting events radiate larger shear waves than compressional waves. Theoretically, provided that attenuation effects are not significant, the average radiated shear-wave energy (amplitude squared) could range from about 5–25 times the P-wave energy (Kwiatek and Ben-Zion 2013). For in-mine analysis, an value 10 is usually accepted to indicate tensile fracturing, a ratio between 10 and 20 to indicate mixed fracturing and a ratio value greater than 20 to indicate shear fracturing (e.g., Li et al. 2007). The spread in the values of these ratios is substantial, and the categories do not have strict boundaries. For events large enough to estimate moment tensors, the relative sizes of the isotropic, double-couple and compensated linear vector dipole source components of the source can also be used to classify events. Earlier focal mechanism and more recent moment–tensor investigations indicate that the mining-related seismic events are generally variable combinations of shear and non-shear failure (e.g., Gibowicz and Kijko 1994; Julia et al. 2009; Boettcher et al. 2015).
Every mining region is a source of shallow explosions and usually mine-related tremors, which can include cavity collapse, pillar crush, tensional faulting and shear failure (Malovichko 2020), but often nearby earthquakes are deeper. This makes it difficult to distinguish source type differences from source-depth differences (e.g., Kintner, Cleveland, et al. 2020). Machine learning approaches have been applied to seismic data over the last several decades to assist with seismic event classification (Anikiev et al. 2023; Mousavi and Beroza 2023; Wang et al. 2023; Yavuz et al. 2023). Such approaches show promise in automating classification, but still require additional testing and training data to be constructed. However, a common problem in explosion-monitoring investigations is the limited existence of datasets that contain shallow earthquakes in the vicinity of shallow explosions. Given an opportunity to examine multiple event types (the 5 August 2014 Orkney earthquake, associated aftershocks and mining-related tremors), we investigate source differences between each using P-over-S (P/S) amplitude ratios. Although seismologists have worked with P- and S-wave amplitudes in local-distance analyses for many decades, an examination of the variability of P/S amplitude ratios across a dense network recording shallow sources (mine tremors and/or earthquakes) can provide useful information to help guide future studies with more limited data.
The objective of this study is to investigate the variability of low-yield earthquake and mining-related event P/S amplitude ratios recorded at local distances. Although we have no data from explosions, the mixture of earthquakes and mine-tremor sources and especially the shallow source depths makes the results of our analyses informative, but not definitive for explosion monitoring. The variability in frequency-domain P/Lg amplitude ratios measured by Pyle and Walter (2019) for distance ranges closer than 100 km was substantial. Propagation corrected relative amplitudes scattered over a range of 1.5 log units (for earthquakes) at close distances, but the variability decreased with distance out to 300 km. We examine the variability of time-domain measurements in a closer distance range with and without propagation corrections. Specifically, we utilize a catalogue of local-distance ( km) seismic events recorded by a dense three-component surface accelerometer network (Figure 1) distributed across the Klerksdorp gold field located in the North West and Free State mining regions of South Africa (Midzi et al. 2020). The dataset is comprised of earthquakes that include the 5 August 2014 Orkney earthquake, associated aftershocks and mining-related events. The richness of the data allows us to explore the variability in P/S amplitude ratios using seismograms recorded at 15–25 stations located within of the source. Something as simple as a P/S amplitude ratio observed at Earth's surface kilometres from the source is unlikely to allow us to distinguish between mine tremors and shear-faulting events, so instead we explore the patterns in the amplitude ratios to see whether from an explosion identification point of view, the mining-related and earthquake sources can be considered one population.

2 Tectonic Setting
With a few notable exceptions, South Africa is a region of relatively low tectonic deformation with spatially and temporally dispersed seismicity similar in character to other intraplate regions (Singh et al. 2011; Manzunzu et al. 2019; Midzi et al. 2020). Among the exceptions are the deep gold mining districts that exhibit a relatively high rate of small-to-moderate magnitude seismicity. The mines are located within the Witwatersrand Basin on the Archean Kaapvaal Craton (2.7–3.7 Ga). Seismicity in the mine districts is monitored by industry-operated in-mine networks and by the surface sensors of the regional and cluster networks operated by the Council for Geosciences, South Africa. After more than 10 years of observation in regions of regular small-magnitude seismicity, the networks are well calibrated and provide substantial high-quality observations for the investigations of mining and natural seismicity (Mulabisana et al. 2019; Midzi et al. 2020).
The Klerksdorp Mining District contains northeast-striking listric normal faults that affect the mine configuration (Gay et al. 1984; McGarr et al. 1989) and is monitored locally by the Klerksdorp–Orkney–Stilfontein–Hartebeesfontein (KOSH) cluster network (Figure 1). In the Klerksdorp region, the network records daily activity and typically locates roughly 150 events per month (Midzi et al. 2015). The mines extend to a depth of roughly 3.5–4.0 km below the surface, and the seismicity occurs at depths above 10 km (Figure 1). Most of the mine-related seismicity occurs near the front of a stope on newly created fractures that result from the stress changes following small-magnitude production blasts. Larger seismic events occur along existing faults and are sometimes associated with dykes that also transfer stress within the environment (Masethe et al. 2023).
Based on broad seismicity patterns, the region is believed to be in an east-northeast extensional domain (Manzunzu et al. 2017; 2019). On 5 August 2014, an earthquake occurred beneath the Klerksdorp district, immediately under the Moab Khotsong Mine (Voosen 2017). Teleseismic analyses suggest a near-vertical left-lateral strike-slip faulting geometry with a seismic moment of (, Global Centroid Moment Tensor Project). The event triggered aftershocks and seismicity within and beneath the district's gold mines. The in-mine seismic network provided a clear view of the nearby seismicity associated with the roughly north-striking vertical strike-slip earthquake (Ogasawara 2019). The regional surface-network provided a view of a roughly 6-km long north-south trending aftershock pattern (Figure 1) and suggested the aftershocks were deeper to the south ( km) than the north ( km) of the epicentre (Manzunzu et al. 2017). Based on the in-mine aftershock locations, the mainshock rupture is believed to have extended from roughly 3.5–7 km depth (below the surface), within a few hundred metres of the deepest mine tunnels (Ogasawara 2019). The exact relationship between the strike-slip faulting and mining activity is not yet known. The region is generally thought to be an area of extension – many of the mine tremors include a dip-slip component on NW-SW striking normal faults (Durrheim 2015). Efforts to drill into the rupture zone from the mine were successfully completed in 2017–2018 (Ogasawara 2019).
3 Seismic Data
We analysed strong motion seismograms from the KOSH (KO) cluster network (Durrheim et al. 2012; Ogasawara 2014) located in the Klerksdorp gold mining region of South Africa. The strong-motion seismograph network was deployed in the Klerksdorp area following the 2005 Stilfontein earthquake (Durrheim et al. 2006) and is operated by the South Africa Council for Geoscience. The network includes 26 three-component surface accelerometers recording at 200 samples per second with a network aperture of roughly 25 km. The network operators provided a small catalogue of non-explosion event locations and associated waveform data recorded on the surface accelerometer network between 2013 and 2014. We used the locations listed in the catalogue for this study, which were determined by the network operators using the mine location algorithms, but the dataset did not have additional ground truth information. As a result, we used the depth extent of the deepest mine, Moab Khotsong (Voosen 2017), and the extent of the Orkney earthquake rupture, from 3.5 to 7 km depth (Ogasawara 2019), to categorize the events listed in the catalogue. We declared all events greater than 4 km as suspected earthquakes, and any events occurring at less than 4 km as suspected mining-related events, which possibly include cavity collapse, pillar crush, tensional faulting, shear failure, and aftershocks of the Orkney earthquake. Our sample of non-classified network observations contained waveforms from 248 seismic events ( 5.5).
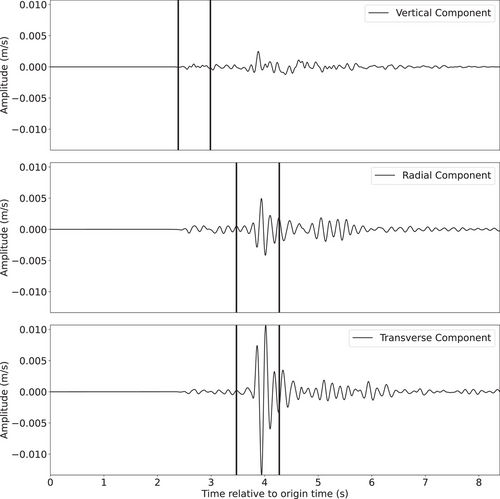
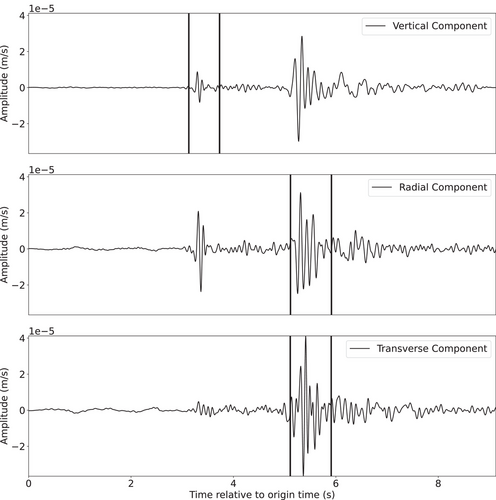
With a dense accelerometer network located above the local mines, as close as a few hundred metres from the sources, the seismic wave amplitudes were generally recorded above the background noise. Example seismograms are shown in Figures 2, 3 and S1. A seismogram from the largest suspected mining event (located shallower than 4 km) is shown in Figure 2. The signal is rich in shear-wave energy but relatively low-frequency given the event size (). A seismogram from the deepest event beneath the mine (an earthquake located deeper than 4 km) is shown in Figure 3. The event was of small magnitude, so some noise is present, but the high frequencies are well recorded and both P and S contain substantial energy. The seismogram shown in Figure S1 corresponds to the deepest suspected earthquake in the southwest cluster (). In general, the amount of S-wave energy relative to P-wave energy for the suspected mining events and earthquakes that occurred beneath the mines is quite large across the recorded frequency range. Nearly all events were recorded at a minimum of 12 stations and 35 events were recorded at 20 or more stations. Generally, since both mining-related and earthquake waveforms contain strong S-wave energy (relative to P-wave energy), a large separation between the two populations using P-to-S ratios is unlikely.
4 Seismic Sources and Source-Type Information
We do not know a priori which events were earthquakes and which were mine-related tremors, but based on existing analyses (Manzunzu et al. 2017; Moyer et al. 2017), depth of the events and the approximate depth ( 4 km) of the deepest mine in our catalogue region, we infer roughly 55 suspected earthquakes and 193 suspected mine tremors. A map of the events (Figure 1) contains two event clusters. A main cluster east of 26.7°E, and a small cluster to the southwest. The main cluster contains the 2014 Orkney earthquake, 193 events with mine-level depths and 45 deeper events (31 occurred after the Orkney mainshock). The smaller cluster to the southwest contains nine suspected earthquakes extending to km, two of which occurred after the Orkney mainshock (Figure 1). Although these events are on the edge of the network, one station is located relatively close to the cluster. The suspected aftershocks from the Orkney earthquake are predominantly distributed along a linear feature oriented nearly north-south that corresponds to the sub-mine Orkney earthquake strike (indicated by the arrow in Figure 1). Relative to the Orkney earthquake, many of the shallowest events occur to the north, while many of the deepest events occur to the south (Manzunzu et al. 2017; Moyer et al. 2017).
Moment–tensor solutions provided by A. Mangongolo (personal communication, 2018) for all the events within our dataset were estimated from P- and some S-wave amplitudes and polarities using the method of Ebel and Bonjer (1990). The tensor dataset is comprised of sources consistent with both double-couple and compensated linear vector dipole (CLVD) moment tensors. We did not use the moment–tensor solutions for event classification, but rather, to estimate the range of P/S amplitude ratios to expect for the dataset. We estimated the range of P/S amplitude ratios for moment–tensor solutions using numerical integration of the radiation pattern expressions in Aki and Richards (2002). Then, we examined the amplitude range using lune source-classification diagrams (Figures 4 and S2).
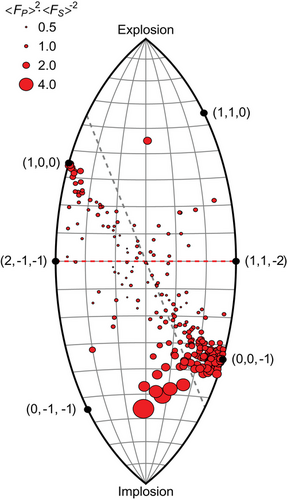
A lune source-classification diagram distinguishes seismic source types using the eigenvalues of the moment tensor (Tape and Tape 2019). Eigenvalues for a double-couple source plot at the centre of the diagram and those for a deviatoric source plot along the horizontal line across the diagram's centre. Eigenvalues for sources with isotropic components plot above and below the deviatoric line (explosive components above and implosive components below) and eigenvalues for pure CLVD sources and cracks plot at locations along the left and right edges. Each symbol in Figure 4 corresponds to a single event, and the size of the symbol corresponds to the relative size of simulated P-to-S waves. The farther from the diagram centre (a double-couple), the more enriched the event is in P-waves (relative to shear waves) and so the larger the symbol. At the vertices, the ratio would be infinite (no S-waves are radiated from an ideal explosion or implosion).
The source mechanisms for many of the mine-related events suggest processes associated with cavity collapse, pillar crush and tensional faulting. Most lie in the implosive region (below the lune's equator), and many concentrate near crack-like solutions (i.e., near (1,0,0) and (0,0,−1)). The estimated moment tensors suggest that none of the events have isotropic components exceeding one-half the total moment. Although a systematic pattern in theoretical P/S amplitude ratios is clear in the lune diagram (P/S ratios increase with distance from the lune equator), the range of ratio values is not large, so distinguishing between most of these events using event-average P/S ratios would be difficult. Still, the broad mix of source types allows a detailed examination of a diverse population of non-explosive low-yield sources (Figure 4). Thus, we use this heterogeneous mix of non-explosive sources to explore the variability in local-distance measured P/S ratios. Even though we do not expect to use average P/S amplitude ratios observed at the surface to distinguish source types, we will compare and contrast suspected earthquakes (mostly deep events) and suspected mine-related events as we explore the observations. Next, we review the approaches used to measure the P- and S-wave amplitudes and amplitude ratios, and a regression approach that we use to estimate internally consistent and propagation-corrected P- and S-wave source amplitude factors from the observed seismograms.
5 Methods
5.1 Data Processing and Quality Control
We deconvolved the instrument response from the accelerations to produce ground-velocity seismograms. We filtered the data to include signals in the frequency band from 1 to 50 Hz. We visually inspected each waveform and picked P- and S- wave arrival times for all 248 events. The maximum hypocentral distance for this dataset is km, and many of the events were recorded between 5 and 15 km from the source. All events were recorded at a minimum of 12 stations. Moyer et al. (2017) developed a simple two-layer velocity model for the region to model the 2014 Orkney earthquake using travel-time observations. The model includes only the top of the crust, a 1.4-km deep surface layer with a P-wave speed of 3.8 km/s, underlain by a halfspace with a P-wave speed of 5.8 km/s. The model ratio was fixed at 1.65 (Poisson's ratio of 0.21).
Despite its simplicity, the model is adequate for interpreting the observations made at short distances. We used a group velocity window of km/s and km/s to aid phase identification. P-wave observations were generally clear and shear-wave energy was at least three times larger than the P-wave energy for the majority of the observations. We compared the measured S-P arrival times with P-wave arrival times to ensure that all picks were consistent and generally well constrained. From a simple Wadati diagram (Figure S3) analysis, we estimate that the region's average ratio lies between 1.62 and 1.63 (Poisson's ratio of 0.19–0.20). Although low (Brocher 2005), the Poisson's ratio values are reasonably well constrained and compatible with other analyses in the region (Julia et al. 2009). Such a low Poisson ratio may be associated with the prevalence of tensile cracks in the area containing the deep mine system (Walsh 1965).
5.2 P/S Amplitude Ratio Measurements
After the P- and S-arrival times were identified, we measured amplitudes for the P- and S-phases across multiple frequency bands between 1 and 30 Hz (2–4, 4–6, 6–8 Hz, etc.). The short source-to-receiver distances required careful examination to ensure amplitude measurements were made within time windows containing the peak energy of each arrival and avoided phase overlap. Frequency bands were isolated using a two-pole, two-pass, Butterworth bandpass filter. Before measuring P- and S-wave amplitudes, we visually inspected waveform data within three source-to-receiver distance ranges ( 10, 10–20, and 20 km) to determine suitable windows for phase measurement. We identified window lengths that contained the least noise or phase contamination prior to phase onset and did not prematurely cut the waveform packet. The measurement time windows for P- and S-waves began 0.1 s prior to the measured phase onset for all distance ranges. For source-to-receiver distances 10 km, the measurement window ended 0.3 s after phase onset for both P- and S-waves. For distances between 10 and 20 km, the windows extended to 0.5 s after the P-wave arrival and 0.7 s after the S-wave arrival. Measurement windows for source-to-receiver distances greater than 20 km were extended to 0.7 s after the P-wave arrival and 1.0 s after the S-wave arrival. Peak amplitudes and root-mean-square (RMS) amplitudes were measured for each component in addition to the three-component vector RMS amplitude across the measurement time window. Our preferred amplitude metric was the vector RMS amplitude, which avoided issues associated with the large range of incidence angles (from near-vertical to near-horizontal) intrinsic to local-distance observations of shallow seismic events. We examined synthetic seismograms computed with the Moyer et al. (2017) model to explore possible free-surface effects for wide-incidence angles. The calculations showed that the effects were minimal for a range of (fundamental) source types and depths. In the synthetics, the near-surface layer produces a train of waves for each P and S arrival, effectively smoothing out the effect. We did not notice any unusual effects in the data either. On the Earth, scattering and the decrease in speed near the surface appear to reduce any theoretical issues with wide-angle incidence at the surface.
5.3 A Model of Seismic Wave Amplitudes
Earlier researchers (Taylor and Hartse 1998; Walter and Taylor 2001; Taylor et al. 2002) developed approaches to account for factors in the seismic waves that are not related to the underlying source type. One approach to equalizing source size and distance effects is the magnitude and distance amplitude correction (MDAC), and it has been applied extensively on regional distance seismograms and to a lesser extent on local to near-regional distance observations (e.g., Pyle and Walter 2019). We use a regression-based approach on the local-distance ( km) observations from the Klerksdorp mine region. Regression allows us to assess the importance of frequency-dependent P- and S-wave attenuation differences and estimate independent P- and S-wave excitation and site factors. The regression is based on the convolutional model of seismic wave excitation and propagation (e.g., Ammon et al. 2020).
6 Analysis
6.1 Direct P/S Amplitude Ratios
We computed P/S amplitude ratios over multiple frequency bands to explore trends present in the data and examine the variability in local-distance P/S amplitude ratios. P- and S-wave amplitude measurements were made with single-component peak and RMS and vector (three-component) RMS amplitudes. Our preferred amplitude metric is the vector RMS amplitude. To centre the logarithms of the amplitude ratios near zero (a ratio of 1.0), we apply a few simple multiplicative factors to all measurements. We corrected each event average ratio using Equation (3), which should centre the ratios of deviatoric sources about a logarithmic value of zero.
Individual P/S amplitude ratios for the 2–4 Hz frequency band are shown as a function of hypocentral distance (refer to Figure 5 and Figure S4 for additional frequency bands). Since we applied the multiplicative corrections for average P and S radiation patterns and wave speeds, we expect the values to centre on a log value of zero, which they do. The closest data are most sensitive to location errors (through distance) and are relatively few in number. The number of observations increases for distances beyond 5 km and then gradually decreases for distances more than 15 km. For display, we grouped the measurements by suspected source type, but all source-type populations greatly overlap. Even the deep sources in the southwest cluster exhibit the same pattern as deep and shallow events beneath the local mines. The spread of values ranges from roughly log unit and is maximal in the distance range from roughly 10–20 km. The spread decreases for distances greater than about 15 km, but there are also fewer observations at the greater distances. In general, the spread is comparable to those observed in earlier studies (e.g., Pyle and Walter 2019). The 2014 Orkney earthquake is the largest event in the dataset (M 5.5) and has lower P/S amplitude ratios than the other event types due to its significant difference in source size (and lower corner frequencies).
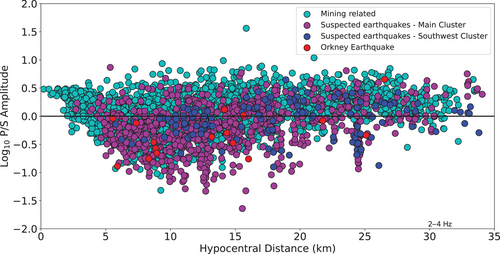
Event-type separation is unlikely to be clear when looking at the individual measurements that are variably affected by radiation patterns and propagation. Event averaging is the most common way to reduce these effects (Taylor et al. 1988; Kim et al. 1993; O'Rourke et al. 2016; Kolaj 2018; Pyle and Walter 2019). For each frequency band, we averaged all three-component P/S amplitude ratios for each event and then averaged all events in each suspected event-type category. Figure 6 is a plot of the averaged P/S vector RMS amplitude ratios for events across frequency bands between 1 and 50 Hz (e.g., 2–4, 4−6, 6–8 Hz, etc.). We explored four variants of P/S amplitude ratios as a function of frequency: (a) event averages using all observations, (b) using the five closest observations, (c) using the 10 closest station observations, and (d) for events with 20 or more station observations. The error bars indicate the spread in observed event averages for each category. The error bars are largest for observations with 20 or more stations (d) because there are fewer events in each category. But even the events with the most number of observations show the same trends in the averages. In each case, there is a small average separation of event types but the overlap between the event categories is substantial. The averages also do not indicate higher values for suspected mining-related events than earthquakes, as might be expected. As mentioned above, this is not completely unexpected since our observations are quite far from the sources and true event-type classifications are not known – they are inferences from incomplete data (depth, geographic location, P-wave first-motion moment–tensor estimates, etc.). The 2–4 Hz passband shows the most separation between the mine-related and suspected earthquake populations (a,b,c). We observe a gradual increase in the average P/S amplitude ratios between 28 and 50 Hz; the highest P/S amplitude ratios corresponding to events in the cluster southwest of the mine. We suspect that this behaviour may result from a greater S- than P-wave attenuation (attenuation effects should become more apparent with increasing frequency). That would be consistent with the results for the southwest cluster, which corresponds to some of the deepest events and the longest wave travel paths and shows the greatest P-wave enrichment. Another factor may be the fact that these frequencies may be above the P and S corner frequencies. If the P corner is higher than the S, the P/S ratios would be higher (Kwiatek and Ben-Zion 2013). Although we observe a decrease in the spread of the ratios at the higher frequencies, we note that the results at the highest frequencies are based on observations with significantly lower signal-to-noise ratios. For this reason, we focused attention on narrow bands between 2 and 30 Hz band.
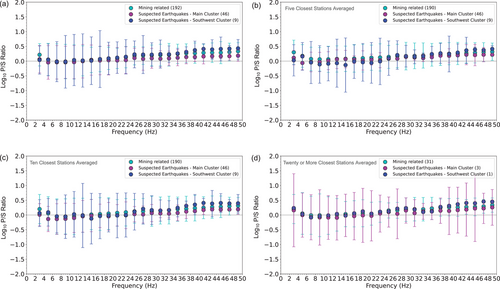
We examined the event-category average ratios for a suite of distance ranges to explore the idea that our simple correction assumptions may be more appropriate for a specific distance range. But we did not see any systematic pattern in the increase in the spread of the ratios with observation distance. Quantifying the effect is complicated by the variable number of observations associated with each distance range. An interesting pattern in all variants of the simple P/S amplitude ratios is an increase in the spread of the ratios in the 10–20 Hz band (roughly). The increase is not easily attributed – the data in that range have good signal-to-noise ratios and they are plentiful. As discussed earlier, as the distance range increased, the data indicated a modest enrichment in P-wave energy for all event types, suggesting attenuation effects.
To explore the spread in event P/S amplitude ratios when we account for distance-based attenuation and site effects, we use a linear regression that enables us to correct P and S amplitudes for propagation effects empirically and independently. The results of the regressions include independent estimates for P and S source excitation factors that can be used to construct more completely propagation-correct S/P amplitude ratios.
6.2 Linear Regression Analysis
To use the observations to estimate optimal values of the source, site, and propagation factors, we formed and solved the regression system (Equation 5) using the observed vector RMS P- and S-wave ground velocities (independent regressions for each wave type). Sample P-wave regression fits for the 2–4 Hz frequency band are shown in Figure S5. The resulting models fit the data reasonably well, matching about 88 of the P-wave amplitudes and 87 of the S-wave amplitudes (the percentage values are one minus the sum of the squared residuals divided by the sum of the squared signal amplitudes). Most of the P-wave residuals lie in the range of logarithmic units. The dominant contribution to the data fit for both P- and S- wave observations is from the source excitation and distance factors. These source-size factors are reasonably well accounted for in a simple P/S ratio. Site amplification contributes to the fits but does not strongly influence the variability in the observed amplitudes. We discuss each part of the regression model individually.
6.2.1 P- and S-wave Source Excitation Terms
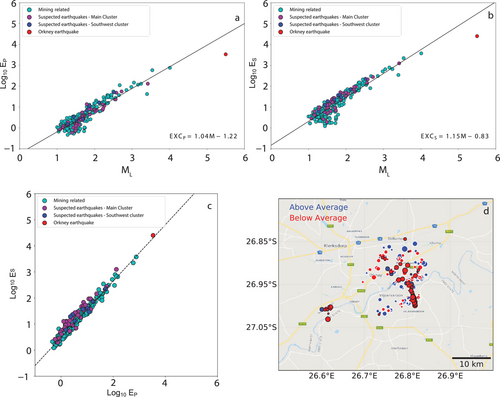
Figure 7 is a summary of the 2–4 Hz P- and S-wave source excitation factors estimated for all the events. P- and S-wave source terms for additional frequency bands are shown in the Supporting Information (Figures S6–S8). Figure 7a shows the P-wave factors colour coded by event type. The horizontal axis is local magnitude and as expected, the correlation of the event terms with magnitude is quite strong. For some small events, , the source terms deviate slightly from the trend, but the overall scatter of the data is low. The Orkney event falls off the trend as a result of longer source duration for this larger event – we do not correct for the fact that we are measuring amplitudes beyond the corner frequency of the event. For the most part, the suspected event types mix. Figure 7b shows an analogous plot for the S-wave source factors, which also show a good correlation with local magnitude (recall that the P and S-wave regressions are performed separately and independently). Interestingly, the S-wave excitation factors for the suspected earthquakes in the main cluster are slightly, but systematically higher than the suspected mine tremors. Direct comparison of P- and S-wave source excitation factors (Figure 7c) shows more consistency than the comparison with . The relationship has a slope of one (where and ). For the most part, the earthquakes in the main cluster tend towards higher S-to-P ratios (refer to the Supporting Information for additional frequency bands). Figure 7d is a map of the estimated P/S amplitude ratios corrected for distance and site effects (refer to Figures S10 and S11 for additional frequency bands). The source factors are colour-coded to separate those that are above (blue) and below (red) the average value. We see below-average P/S amplitude ratios along the Orkney earthquake fault strike for all frequency bands and below-average P/S amplitude ratios for events in the southwest cluster for most frequency bands. These suspected earthquakes are relatively enriched in shear-wave energy, as we would expect. Events within the broader region of the mines exhibit a mix of above and below-average ratios, suggesting that many, but not all, of the shallow events resemble earthquakes. The analysis seems to indicate that many of the suspected earthquakes were enriched in shear-wave energy relative to the suspected mining-related events.
6.2.2 The Distance Attenuation Factor
The geometrical spreading and attenuation factor was parameterized using a piecewise linear function over a set of nodes located at fixed source-to-receiver distances spanning the distance range of the measurements. Although a portion of our data is only a few wavelengths from the source, synthetic seismograms tests suggest that working with ground velocities minimizes any potential influence of near-field deformation with a different geometrical spreading function. We finely sampled the nodes at distances 5 km and incremented by a larger range (5 km) for source–receiver distances greater than 10 km. The 12 nodes used in the regression were 0.1, 1.1, 2, 3, 4, 5, 10, 15, 20, 25, 30 and 35 km. The sampling is crude at distances 1 km (where the function changes rapidly), but we have few data in that distance range. An unconstrained estimate of the distance factor was generally well behaved but showed a small, nonphysical increase in amplitude with distance for distances greater than 15 km. To stabilize the behaviour at larger distances, we constrained the function to approximate an dependence. The change in fit to the observations was only a few percent. Both the P- and S-wave ground motions were well modelled by the simple dependence and the fit improves only by a few percent when the function is allowed to deviate from the expected pattern. We evaluated differences in our geometrical spreading and attenuation function over a range of frequency bands (between 1 and 30 Hz) to determine if attenuation strongly influenced our distance and attenuation curve as the frequency increased (and the effects of attenuation were expected to be more important). Somewhat surprisingly, we observed no effects of attenuation: the distance dependence for the P- and S-wave inversions worked well over the full frequency range.
6.2.3 The Site Factors
We required the site factors to sum to zero in our regression, so our estimates represent relative, not absolute site responses. For most frequencies, the site amplification factors ranged roughly from 0.5 to 2.5. An examination of the relative P-wave and S-wave site amplifications for the 2–4 Hz frequency band (Figure S9) reveals a pattern of site amplifications that is not simple. However, for all frequency bands between 1 and 30 Hz, the S-wave and P-wave site amplification factors showed a consistent and positive correlation. Visual inspection of the waveforms corresponding to sites with strong relative amplification revealed S-wave resonances at several stations (VRCP, VRVW, MOAB) along and near the Vaal River, which is oriented southwest to northeast along the southern edge of the KO network. This feature was prominent on the horizontal channels and showed amplitudes about three times larger than those recorded on the vertical component.
7 Discussion
Our examination of the P/S ratios computed using surface sensors at local ( km) distances in the Klerksdorp mining district suggests that P/S amplitude ratios measured using time-domain root-mean-square (RMS) velocity measures and a distance-adaptive time window produce stable measurements across a wide range of shallow, non-explosive sources. Our analysis included a broad sample of source types (Figure 4) and depths spanning the upper crust, concentrated above 4 km, and as close to the surface as a few hundred metres. The variability in event-averaged ratios with a good local network was on the order of logarithmic units, which is a relatively tight cluster. Although we have no explosions to demonstrate a separation of the explosive and non-explosive sources, the ability to treat the mine tremors and earthquakes as a single consistent population (most events had relatively high shear-wave amplitudes) is encouraging for the explosion discrimination efforts, which should produce larger ratios as a result of weak shear-wave excitation.
We summarize measurements (logarithms of P/S amplitude ratios) of the spread of all the event P/S ratios in Table S1. The frequency band listed in the table represents the corners of the filter that was used to make individual vector RMS amplitude measurements. Each band included a measurement from all 248 events, but not all events were recorded at each station. Our measurements consist of P/S amplitude ratios for 248 events. Each event in turn has 25–30 observed P/S ratios from which we can compute an event mean P/S ratio and measure the spread of ratios for each event. We examined the variability of the event means and the variability of the individual event P/S amplitude ratio spreads. We use a simple sample standard deviation (Figure S12) to measure the variability of the measurements. The mean spread is the spread of all 248 event-average ratios. Each event also has its own spread (the standard deviation of the measurements used to compute the event average) and the spread of the spread is the spread of the individual event spreads. The minimum and maximum spread values show the range of the individual event measurements. The spread of event averages across all bands is roughly 0.3 and always lower than 0.35. The maximum spreads (a measure of the event with the most variable P/S amplitude ratios) are roughly double that, 0.7. The most consistent events are typically lower than 0.20.
We examined individual station spreads (the variability of measurements from each event) as a function of event depth, magnitude and primary gap, but no overall trend emerged to identify a dominant control on the amplitudes, which are likely affected by source radiation and all the factors.
7.1 Simulating Sparse Network Performance
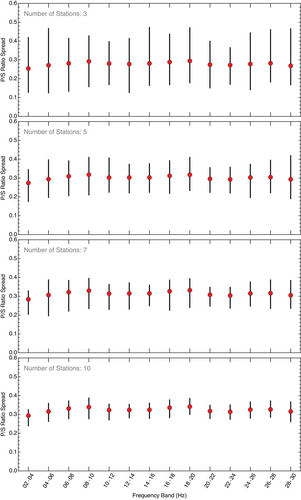
We can use our observations from the full network to simulate the performance of more limited networks on the same population of natural and mine-related sources. Specifically, we can simulate the performance of smaller networks (fewer stations) using subsets of our data. We examined the performance of 3-, 5-, 7- and 10-station networks by resampling our measurements and computing the range of event-average spreads estimated with roughly 1000 sub-networks constructed by randomly sampling the existing network. Each network included the specified number of stations, but if a particular event was not recorded at all the stations, we included it in the computation, simulating a situation where a small network has a station down. Examination of the geometry of the 100 samples indicated that we had a reasonable number of network configurations, clustered stations and sparse stations, that concentrated in different subregions of the full sensor network.
The results of the simulations are shown in Figure 8. The red circles identify the average spread from all 1000 simulated networks and are roughly similar to the average of the whole network (Figure S12). The vertical lines show the range of event-average spreads that were observed across the 1000 network simulations. As expected, the more stations in the network, the less variability in the average ratios. Although the increasing variability with decreasing station number is clear, the variability is not that bad even for a sparse network. However, we average up to 248 events, so the stability of the process, while encouraging, does not reflect the problems that arise when we have a sparse network looking at a few events. Our point is that the range of logarithmic P/S ratios obtained from a broad range of non-explosive sources that we examine on average is reasonably consistent.
7.2 The Regression Analysis
Although the simple P/S ratio measurements are quite stable with frequency, the regression approach allows us to better estimate P- and S-wave source factors by deriving and applying corrections for propagation and site factors. These can be used to compute P/S source-excitation ratios (e.g., Kintner, Ammon, et al. 2020). Calculations with the geometric spreading function in both the P- and S-wave regressions showed that using a distance attenuation function that differs from resulted in an insignificant improvement in the fit to the observed signal RMS amplitudes. Thus, assuming a standard geometric spreading dependence and ignoring attenuation effects at these short distances is a reasonable approximation. This is not surprising given the short paths and relatively high estimates of quality factor, Q, in South Africa (Birch et al. 2015; Brandt 2016). We observed a tendency for high-amplitude ratios at our highest frequencies that could be caused by differences in P- and S-wave attenuation, corner frequency differences or simply lower signal-to-noise ratios at higher frequencies. If both P- and S-wave amplitude measures reflect seismogram noise, a simple ratio of the quantities would be one. If we then apply a radiation pattern and wave-speed corrections, the P/S ratio would be boosted slightly higher, as observed.
The site terms show some patterns, such as greater amplification to the northwest (Figure S9). Individual amplification factors are only comparable in a relative sense. A common site factor is removed by requiring all factors to sum to zero (the average factor is mapped to the source term). Most of the factors are reasonable (factors of 2 or less). The correlation between P- and S-wave amplifications is good for low amplification factors. The largest factors resulting from the regression are associated with P-waves, and the corresponding S-wave values are significantly smaller. The site factors do not exhibit a strong impact on the individual amplitude misfits (Figure S5b), but their inclusion in the model contributes to very consistent source factors from the separate P- and S-wave regressions (Figures S7– S9).
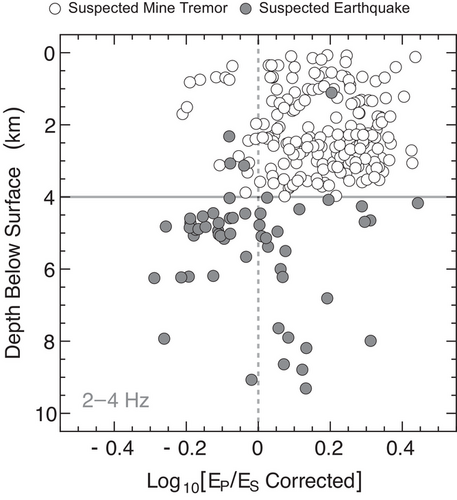
As noted in our discussion of Figure 7c, a plot of the P- and S-wave source factors hints at a separation of the event types (the suspected earthquakes plot above the one-to-one line). The apparent location of the events above the line indicated a slightly enhanced excitation of shear waves for these sources. The cause could, of course, be associated with the source type (mechanics) or location (depth). Another view of the source factors is presented in Figure 9, which is a plot of the difference in the logarithmic P- minus S-wave source factors as a function of source depth (refer to Figure S13 for additional frequency bands). We applied the correction that should centre the deviatoric sources on the plot (the correction depends on ideal radiation pattern averaging of the P and S amplitudes and a correction for the ratio of P- and S-wave speeds). The correction is identical for all the events and thus does not change the overall pattern of the observations, simply shifting the origin. Deep, suspected earthquakes (all events other than the suspected mining-related events) are mostly relatively enriched in shear-wave energy (most lie below a logarithm with a value of 0.2). Events labelled suspected mine tremors are almost certainly a mix of all event types, many also have comparable shear-wave energy to the deep events, but generally plot on the positive side, indicating a relative enrichment of P- to S-wave energy. Although in this bandwidth, deep sources show a relative enrichment in S-wave energy, so do many shallow events, many of which moment–tensor information suggests are not simple earthquakes. The pattern varies with frequency band – suspected earthquakes are all relatively enriched in S-wave energy below about 10 Hz, but scatter more or less evenly about zero for high frequencies. Suspected mine tremors (shallow events) centre on zero for frequencies about 6–10 Hz, then shift positive (enhanced P-wave energy) for frequencies higher than 18 Hz. Thus, the results are interesting and encouraging for explosion discrimination studies, but our lack of detectable explosions limits what we can infer about discrimination.
We also compared the estimated source-term differences (P/S ratios) with non-double-couple (isotropic, double-couple, and compensated linear vector dipole) components of the moment tensors shared by A. Mangongolo (personal communication, 2018), but found little correlation. Again, this was not unexpected. Our observations are quite far from the sources (kilometres to tens of kilometres) compared with the frequencies used to estimate energy ratios for source characterization with in-mine observations (tens to hundreds of metres away). Likewise, based on the moment–tensor predictions (Figure 4) and our rough amplitude resolution of log units, distinguishing the sources was expected to be unlikely. The fact that we recover some difference from the deep events at our lowest frequencies is encouraging but may not be as likely with a smaller network likely to be available for explosion identification.
8 Conclusions
We analysed P- and S-waveforms from 248 shallow seismic events (earthquakes and mine-related events) observed at local distances (less than about 35 km) to investigate the robustness of P/S amplitude ratios estimated using time-domain root-mean-square measurements of ground velocity. The ratios are reliable and show a scatter of roughly 0.35 log units with the full network of 27 seismic stations. We used the observations to explore the likely performance of more sparse seismic networks. The simulation showed the expected result that more stations are better, reducing the variability in the estimated range of P/S ratios observed for our broad sampling of non-explosive source types. A regression analysis that incorporates information from all the events simultaneously (but is applied to P- and S-waves independently) suggested that deeper sources are, on average, enriched in shear-wave energy relative to the average shallow source, but overlap between deep and shallow sources does not allow a simple discriminant based on P/S ratios. The regression also showed a standard geometric spreading of is applicable at these distances. Overall, our analysis shows that the application of a standard regional distance explosion-monitoring approach holds promise in the local distance range since a heterogeneous population of non-explosive seismic sources shows a relatively tight range of event average P/S ratios and explosive sources, which are rich in P-wave energy, should separate from such non-explosive sources.
Acknowledgements
We thank the editor, Tijmen Jan Moser, the associate editor, Leo Eisner, and the three anonymous reviewers who helped us to improve our manuscript. This work was partially supported by the Defense Threat Reduction Agency Contract No. HDTRA1-17-1-0010. The findings and conclusions do not necessarily reflect the view of the funding agency. The authors acknowledge the mining staff and support provided by the South Africa Council for Geoscience.
Open Research
Data Availability Statement
The mine data that support the findings of this study are not publicly available due to privacy restrictions.


