A first application of a marine inductive source electromagnetic configuration with remote electric dipole receivers: Palinuro Seamount, Tyrrhenian Sea
ABSTRACT
We study a new marine electromagnetic configuration that consists of a ship-towed inductive source transmitter and a series of remote electric dipole receivers placed on the seafloor. The approach was tested at the Palinuro Seamount in the southern Tyrrhenian Sea, at a site where massive sulphide mineralization has been previously identified by shallow drilling. A 3D model of the Palinuro study area was created using bathymetry data, and forward modelling of the electric field diffusion was carried out using a finite volume method. These numerical results suggest that the remote receivers can theoretically detect a block of shallowly buried conductive material at up to ∼100 m away when the transmitter is located directly above the target. We also compared the sensitivity of the method using either a horizontal loop transmitter or a vertical loop transmitter and found that when either transmitter is located directly above the mineralized zone, the vertical loop transmitter has sensitivity to the target at a farther distance than the horizontal loop transmitter in the broadside direction by a few tens of metres. Furthermore, the vertical loop transmitter is more effective at distinguishing the seafloor conductivity structure when the vertical separation between transmitter and receiver is large due to the bathymetry. As a horizontal transmitter is logistically easier to deploy, we conducted a first test of the method with a horizontal transmitter. Apparent conductivities are calculated from the electric field transients recorded at the remote receivers. The analysis indicates higher apparent seafloor conductivities when the transmitter is located near the mineralized zone. Forward modelling suggests that the best match to the apparent conductivity data is obtained when the mineralized zone is extended southward by 40 m beyond the zone of previous drilling. Our results demonstrate that the method adds value to the exploration and characterization of seafloor massive sulphide deposits.
INTRODUCTION
Seafloor massive sulphide (SMS) deposits are a potential source of base and precious metal resources, and lately interest in exploring for and economically exploiting these deposits has been increasing (Kowalczyk 2008). Transient electromagnetic (TEM) and controlled-source electromagnetic (CSEM) surveys have both played a role in the exploration and investigation of these marine mineral resources. Marine TEM methods typically employ an inductive source loop transmitter and coincident or in-loop receiver that is either mounted on an ROV or towed behind a ship. Marine TEM systems have been applied to detecting and characterizing SMS deposits (Kowalczyk 2008; Hölz et al. 2015a; Asakawa et al. 2016; Nakayama and Saito 2016). Marine CSEM systems typically employ a ship-towed electric dipole transmitter and electric dipole receivers placed on the seafloor. Marine CSEM methods have been successfully applied in detecting and characterizing SMS deposits and other small targets (Wolfgram et al. 1986; Cairns, Evans and Edwards 1996), oil and gas reserves (see Constable 2010 for a review) and gas hydrates (Yuan and Edwards 2000; Weitemeyer, Constable and Key 2006a; Schwalenberg et al. 2010a, b; Hölz et al. 2015b; Swidinsky, Hölz and Jegen 2015; Constable, Kannberg and Weitemeyer 2016).
We describe a new marine EM configuration that combines the advantages of TEM and CSEM systems. TEM systems with the receiver either coincident or concentric to the transmitter are primarily sensitive to the seafloor conductivity structure directly below or close to the system, which is a useful property when attempting to pinpoint the location of a small target. Conversely, a CSEM system with an array of remote dipole receivers covering the area of interest has a broader sensitivity to the structure of the seafloor throughout the survey area. It should also be noted that CSEM systems use galvanic (electric dipole) sources as opposed to inductive (magnetic dipole) sources, and based on the different underlying physics, have different sensitivity to subsurface structure. Our configuration, referred to as ‘Coil2Dipole’, consists of a transmitter and coincident receiver loop towed behind a ship and an array of dipole receivers placed on the seafloor (Fig. 1) (Safipour et al. 2017b). The data recorded by the towed receiver loop provide narrowly sensitive data along the towing path, while the remote receivers provide data that are broadly sensitive to the conductivity structure of the whole survey area. In addition, the remote receivers are sensitive to greater depths within the seafloor than the towed loop receiver, because of the effect of offset between transmitter and receiver. Thus, the configuration has the capability to both pinpoint the location of small targets and detect additional targets that are not close enough to the towing path or too deep to be detected by a standard TEM system. Potential targets identified in the data from the remote receivers could then be investigated in detail by towing the system directly over them in a follow-up survey.
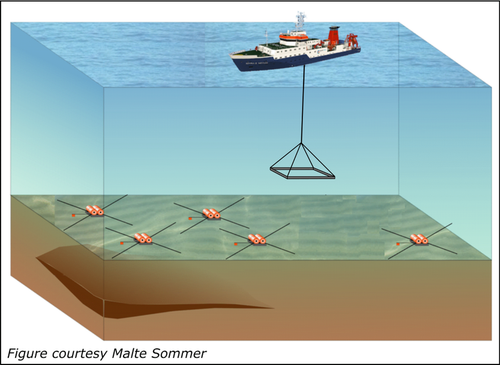
Previously, a marine system that combines a self-contained towed system with remote receivers has been tested in gas hydrate exploration; Constable et al. (2016) developed and tested a CSEM system consisting of a galvanic electric dipole transmitter and an array of self-contained three-component dipole receivers towed behind a ship with additional stationary dipole receivers placed on the seafloor. A CSEM system with a towed dipole transmitter and remote dipole receivers, but without towed receivers, was also tested for gas hydrate detection in the shallow seafloor by Weitemeyer et al. (2006a), Weitemeyer, Constable and Key (2006b). A TEM system consisting of a loop transmitter and remote electric dipole receivers has been tested in land-based applications (Macnae and Irvine 1988; Macnae, McGowan and Lamontagne 1989). However, to our knowledge, a system consisting of an inductive source transmitter and remote dipole receivers has not been tested in a marine setting prior to this study.
In a previous paper, we studied the theoretical capabilities of the configuration and briefly examined the remote receiver data from our first test of the configuration using a 1D forward modelling approach (Safipour et al. 2017b). However, a more thorough interpretation of the data requires a 3D approach, as the bathymetry of the study area and the 3D nature of the SMS target are not considered in a 1D model. In this study, we examine the theoretical capabilities of the configuration using 3D forward modelling. We compare the capabilities of the configuration using either a horizontal or vertical loop transmitter, and we examine the effect of the transmitter position relative to the edge of a buried conductive target body. Finally, we use an apparent conductivity method to interpret the data recorded by the remote receivers during the first test of the configuration.
While this study focuses exclusively on inductive source (magnetic dipole) transmitters, we note that the use of a galvanic source (electric dipole) transmitter, rather than a loop, may be advantageous when sensitivity to a greater depth of investigation within the seafloor is required. While the depth sensitivity of a loop transmitter can be improved by increasing the radius of the loop, a very large loop may be logistically difficult to deploy from a ship. Increasing the transmitter moment by increasing the number of turns of wire in the coil has the disadvantage that the ramp time at current shut-off increases, and a large number of turns in the coil is thus ineffective in time-domain EM systems. Conversely, a large electric dipole transmitter may be easier to deploy from a ship. The use of galvanic source transmitters and their comparison with loop sources is beyond the scope of our study, but it presents an interesting topic for future work.
A FIRST TEST OF THE CONFIGURATION
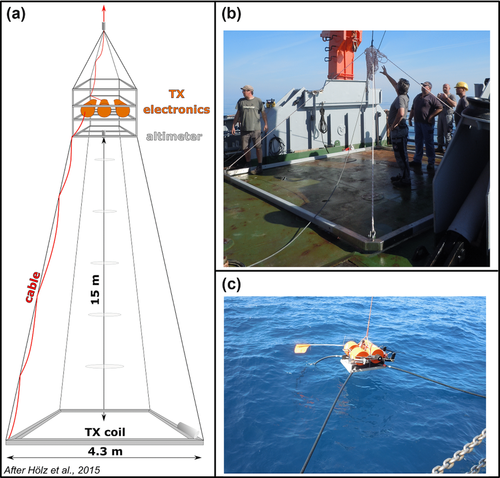
The transmitter of the configuration is a square frame 4.3 x 4.3 m containing two windings of wire with a current of 38 A that is suspended horizontally 15 m below a cubical container for the system electronics (Fig. 2(a)). The coincident-loop receiver and data logger are also affixed to the square frame. The transmitter is lowered off the back of the ship via an A-frame winch, and an on-board altimeter tracks the height of the system above the seafloor; during deployment, the cable length is constantly adjusted to maintain the transmitter altitude between 5 and 10 m. Prior to deploying the frame, ocean-bottom receivers consisting of two perpendicular arms 10 m in length with Ag–AgCl electrodes on the ends are deployed throughout the survey area (Fig. 2(c)). The ocean-bottom receivers are affixed to a titanium frame with buoyant foam blocks and are kept on the seafloor by concrete slab anchors. When the survey is complete, acoustic pings are used to signal the receivers to release their anchors and float back to the surface where they can be recovered. The electric field transients recorded by the receivers are stacked to obtain a single transient decay curve for each transmission. The system electronics are described in detail by Hölz et al. (2015a).
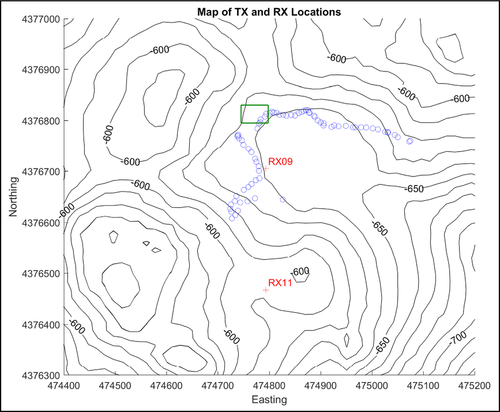
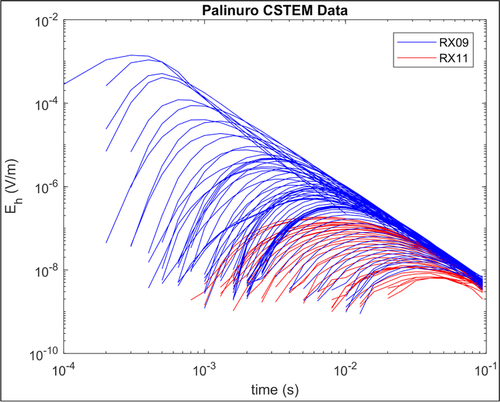
Our first test of the configuration was carried out at the Palinuro Seamount in the Tyrrhenian Sea (Fig. 3) during the research cruise POS483 (R/V Poseidon, 28 March–15 April 2015). Massive sulphide samples were first discovered at Palinuro by Minniti and Bonavia (1984) and shallow drilling carried out by Petersen et al. (2014) recovered sulphides in 11 drill cores. The drill cores indicate that the massive sulphides are typically buried under several metres of mud, making Palinuro a good test site for the exploration of a shallowly buried deposit. Gravity, magnetic, sonar backscatter reflectivity, and detailed bathymetry data had previously been collected over the area of the sulphides (Caratori Tontini et al. 2014; Ligi et al. 2014). In addition, during the POS509 research cruise in February 2017, a self-potential experiment detected high natural electric field strengths over the massive sulphide mineralization (Safipour et al. 2017a), and heat flow data collected at the site indicated elevated seafloor temperatures over the known mineralization and extending ∼35 m southward. Electromagnetic methods had not been tested at Palinuro prior to these cruises.

 , from the fields E1 and E2 recorded by the two electrode arms:
 (1)
(1)
A 3D FORWARD MODELLING APPROACH
We gained access to a finite-volume 3D time-domain EM forward modelling code produced at the University of British Columbia (Haber 2015). Using this code, we created a 3D block model of the Palinuro survey area using the bathymetry data. We assigned the seawater a conductivity of 4.6 S/m, which is consistent with the seawater conductivity measured by CTD probe during the experiment. The seafloor conductivity was set to 1 S/m to represent host rock saturated with seawater. To include the effect of the sulphides, we placed a block with a conductivity of 10 S/m with dimensions 55 m x 35 m x 30 m thick buried at 5 m below the seafloor surface at the site of the previously drilled massive sulphide mineralization, indicated by the green square in Fig. 4. The lateral dimensions of this block correspond to the extents of the area where massive sulphides were recovered from drill holes, however, the true lateral extents of the mineralization are unknown and could be larger, hence the purpose of the geophysical surveys in the area. The depth extent of the mineralization is also unconstrained by the drill holes. The burial depth of 5 m was chosen because the drill holes indicated the mineralization was buried under several metres of mud. We ran the forward model with a transmitter of 2 m radius and 50 A current located 10 m above the seafloor directly above the centre of the buried conductive block.
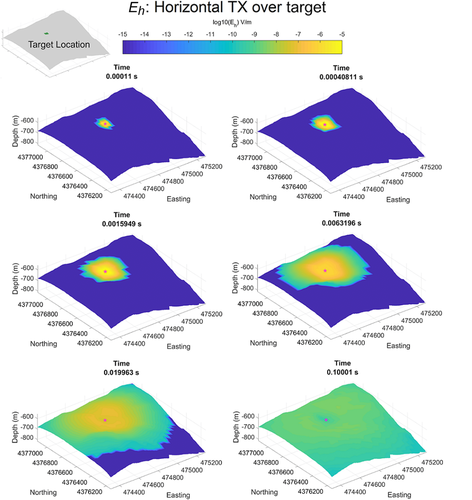
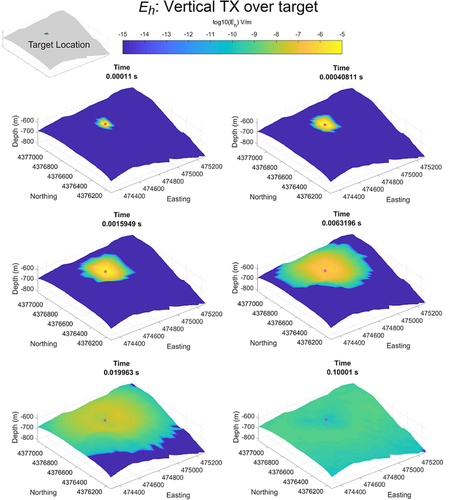
The electric fields were calculated at a grid of receivers on the seafloor surface spaced 50 m apart. In this way, we were able to model and visualize how the total horizontal electric field moves outward from the transmitter across the seafloor topography for both a horizontal transmitter (Fig. 6) and a vertical transmitter with the loop axis aligned in an E-W direction (Fig. 7). While the actual experiment at Palinuro was conducted with only a horizontal loop transmitter, modelling both a horizontal and vertical transmitter allows us to make some theoretical inferences about the relative sensitivity of the two systems. The pattern of electric field diffusion across the seafloor is similar for both the vertical and horizontal loop transmitters, although with a vertical transmitter the fields diffuse outward slightly faster in the direction broadside to the transmitter loop axis.
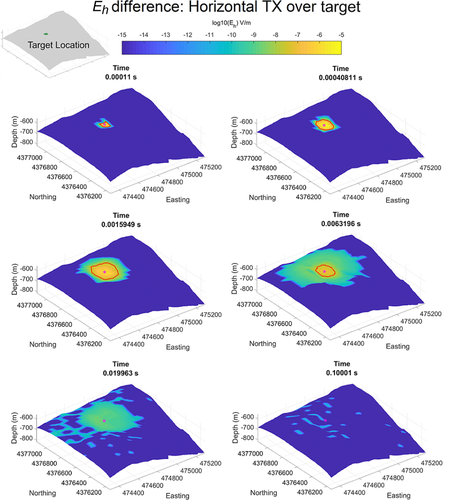
As a reference, we also modelled the horizontal electric field magnitude for a purely homogeneous seafloor. Figures 8 and 9 show the absolute difference in horizontal electric field magnitude between the homogeneous seafloor model and the model containing the 10 S/m conductive mineralized block. To assess the detectability of the target by our instrumentation, we include a red contour line on the images that indicates a field strength of  V/m, which is the approximate noise floor of our receivers. From the modelling, we see that the system is sensitive to the presence of the conductive block at distances up to ∼100 m away from the target, and the vertical loop system is sensitive to a few tens of metres farther distances than the horizontal loop system in the N–S direction. We next ran the models with the transmitter located 50 m to the east of the edge of the mineralized zone. The conductive block is still detectable, but now only at closer distances to the target (∼50 m away), and the sensitivity appears about the same for both the horizontal and vertical loop transmitters. Finally, we ran the models with the transmitter located 100 m to the east of the edge of the mineralized zone (Figs 10 and 11). For this case, the conductive block is only detectable by a receiver located directly above the mineralized zone.
 V/m.
V/m.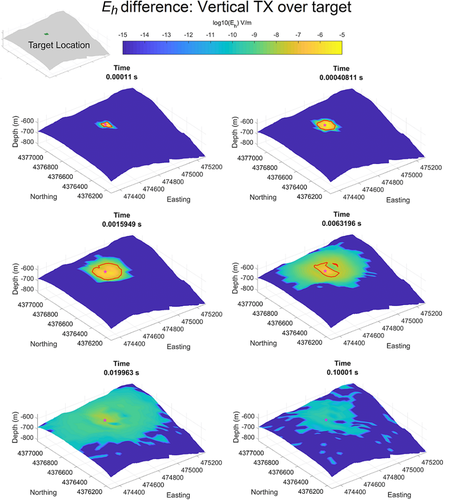
 V/m.
V/m.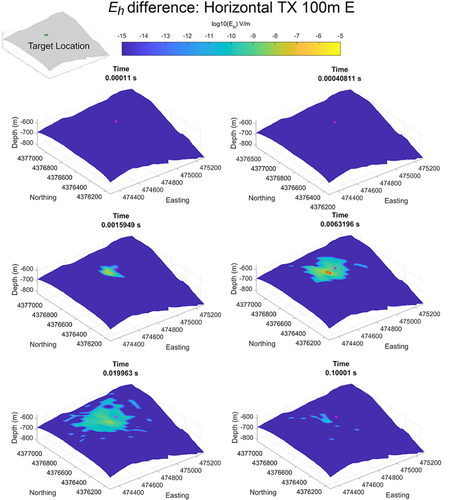
 V/m.
V/m.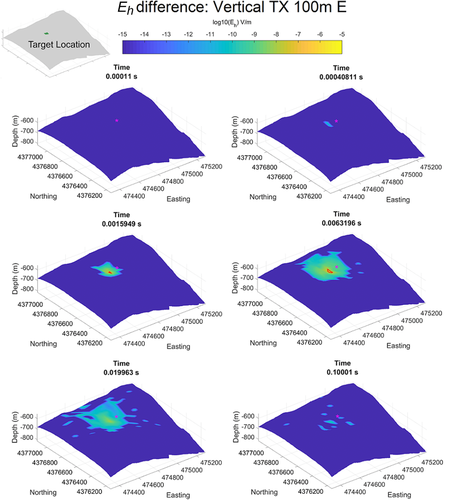
 V/m.
V/m.Safipour et al. (2017b) investigated the vertical bounds of detectability of a layered deposit using 1D analysis. With 3D modelling, we can now extend this analysis to characterize lateral bounds of detectability. In particular, we examined the horizontal electric field transients for a horizontal transmitter with a 2 m radius and 50 A current at a receiver located on the seafloor directly centred over the buried conductive block. We model the conductive target block with lateral extents confined to the drilling zone (green square in Fig. 4), and also with the eastern boundary of the conductive target extended by 20, 40, and 60 m and with the western boundary of the target extended by 20, 40, and 60 m. Figure 12(c) shows the transients when the transmitter is located 10 m above the seafloor 100 m to the east of the receiver. Due to the relatively flat bathymetry east of the target (Fig. 12(a)), the transmitter has a height of 10 m above the height of the receiver. The system cannot distinguish between the case of the target confined to the drilling zone and the extension of the target to the west, which is not a surprising result given that the system should be mostly sensitive to the seafloor conductivity structure between the transmitter and receiver. However, the system can distinguish between the drilling zone target and the target that is extended to the east by 60 m, as the difference in amplitude of the transient is greater than the approximate measurement error of the receivers at  V/m. Figure 12(d) shows the transients when the transmitter is located 10 m above the seafloor 100 m to the west of the receiver. The bathymetry is uphill to the west of the target (Fig. 12(b)), so the transmitter now has a height of 40 m above the height of the receiver, and the burial depth of the target increases to the west. In this case, the system cannot distinguish between the conductive block confined to the drilling zone and the conductive block that is extended to the west. The increased target burial depth and increased height of the transmitter above the receiver, both resulting from the bathymetry, are likely factors that cause the system to be less sensitive to the changes in the target boundaries when the transmitter is west of the target, as opposed to when it is east of the target.
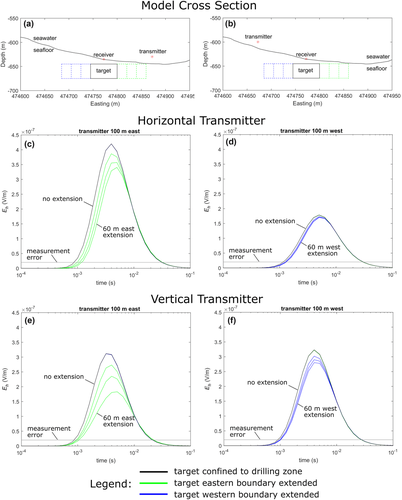
 , versus time at a receiver located on the seafloor centred over the conductive target. Green lines indicate a model with the target boundary extended to the east by 20, 40, and 60 m. Blue lines indicate a model with the target boundary extended to the west by 20, 40, and 60 m. Black lines indicate a model with the target boundary confined to the drilling zone (green square in Fig. 4). The approximate measurement error of the receivers used in the experiment,
  V/m is indicated by the grey line. (a) Cross-section of the model with transmitter located 100 m east of receiver. (b) Cross-section of the model with transmitter located 100 m west of receiver. (c) Horizontal transmitter located 10 m above the seafloor 100 m east of receiver. (d) Horizontal transmitter located 10 m above the seafloor 100 m west of receiver. (e) Vertical transmitter located 10 m above the seafloor 100 m east of receiver. (f) Vertical transmitter located 10 m above the seafloor 100 m west of receiver.
We also examine the horizontal electric field transients for a vertical loop transmitter with its axis aligned in an E–W direction with a 2 m radius and 50 A current at a receiver located on the seafloor directly centred over the buried conductive block. Figure 12(e) shows the transients for the case when the transmitter is located 10 m above the seafloor 100 m east of the receiver, and Fig. 12(f) shows the transients for the case when the transmitter is located 10 m above the seafloor 100 m west of the receiver. Unlike with the horizontal transmitter, the system can now distinguish between the conductive target that is confined to the drilling zone and the target that is extended to the west when the transmitter is located 100 m west of the receiver, and the system does a better job of distinguishing the various eastward target extensions when the transmitter is located 100 m east of the receiver. This suggests that the vertical transmitter is less sensitive to the effects of the underlying bathymetry and increased height between the transmitter and receiver caused by moving the transmitter uphill, which may result from the larger vertical component of the electric field induced by the vertical transmitter.
We also ran all of the models for the case where the transmitter is located 10 m directly above the receiver, centred over the conductive target. For both the horizontal and vertical loop transmitters, the system is unable to distinguish between any of the models with the target boundaries extended to the east or west. This is an expected result, as when the transmitter is located directly above the receiver, the system is primarily sensitive to the seafloor conductivity structure directly below the receiver and has limited lateral imaging ability.
APPARENT CONDUCTIVITY ANALYSIS
 transient. We are only interested in the apparent conductivity of the lower halfspace, which represents the seafloor, while the upper halfspace representing the seawater is assumed to be of relatively constant conductivity throughout the survey area. The apparent conductivity of the seafloor, σ, is calculated from the arrival time of the peak of the transient, τ, and the 3D separation distance between the transmitter and receiver, R, as:
 (2)
(2) , to a Z-score,
  , representing how many standard deviations the apparent conductivity is above or below the mean of the data (e.g. Singer and Kouda 2001):
 (3)
(3)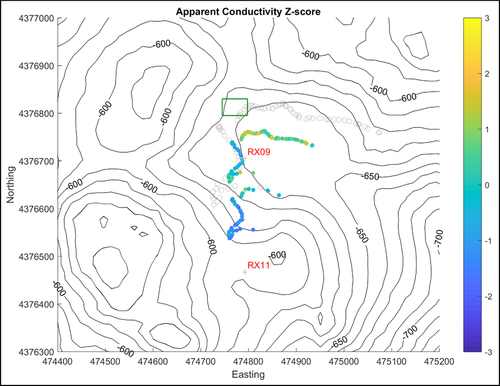
From the Z scores for RX09, we find that seafloor apparent conductivity appears to be relatively highest when the transmitter was over or near to the zone of previously drilled mineralization (green square in Fig. 13). This suggests that the conductive massive sulphides were successfully detected by the system. For RX11, the seafloor apparent conductivity is also slightly elevated when the transmitter was over the mineralization, though the effect is not as prominent as for RX09. This is likely because RX09 is located closer to the mineralization and therefore more sensitive to it.
Using the 3D forward modelling code, we calculate the expected apparent conductivities at RX09 for the 10 transmitter locations closest to the mineralized zone with a model consisting of 4.6 S/m seawater, 1 S/m seafloor, and a 30-m thick 10 S/m conductive block buried 5 m below the seafloor with lateral extents of 35 x 55 m (indicated by the solid-outlined green square in Fig. 13). This is the same model used in generating Figs 6-11. Figure 11 shows the difference in apparent conductivity Z-score between the forward modelling results and the real data. We find that the apparent conductivity Z scores generated by this model are too low when compared to the data (Fig. 14(a)). We then increased the southward extent of the conductive block in increments of 10 m; Fig. 14(b–d) indicate a southward extension of the conductive block by 20, 40, and 60 m. We find that the best match to the apparent conductivity Z scores of the real data occurs when the conductive block is extended 40 m to the south (Fig. 14(c)); when the mean absolute difference between modelled apparent conductivity Z score and data are calculated, the minimum value of 0.471 occurs when the conductive target is extended southward by 40 m. This suggests that the mineralization at Palinuro extends to the south of the drilling zone by a few tens of metres, which is consistent with the footprint of the self-potential signal measured at the mineralized zone (Safipour et al. 2017a). In addition, this southward extension of mineralization is also consistent with heat flow measurements taken of the seafloor sediment during the POS509 research cruise in February 2017, which found elevated temperatures of up to 35.6°C extending southward of the drilling zone by ∼35 m (Hölz 2017).
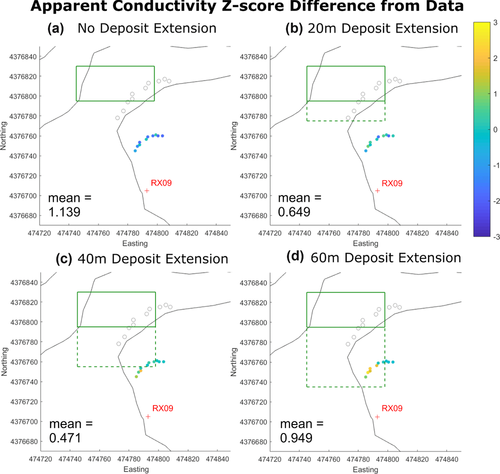
The use of Z scores in our analysis allows us to determine areas where the seafloor appears to be relatively more or less conductive compared to the background seafloor conductivity, which is useful in exploring for targets such as massive sulphides that are highly conductive compare to unmineralized rock. Matching of actual apparent conductivities in the data is a difficult exercise using a forward modelling approach; a 3D inversion of the data would be a better approach when there is a desire to estimate the actual, rather than relative, seafloor conductivity structure. However, a 3D inversion is computationally expensive compared to our approach. Furthermore, the data set analysed in this study has only two receivers and is too sparse to provide a proper base for a full 3D inversion of the seafloor conductivity structure. A second data set was collected with the configuration during the POS509 research cruise using 10 receivers; the data from that deployment is currently being processed and will form the basis of a full 3D interpretation of the seafloor structure at Palinuro (Hölz 2017).
CONCLUSIONS
We conducted a first test of the configuration, which is capable of collecting data from both a ship-towed coincident-loop receiver and remote electric dipole receivers placed on the seafloor. A 3D model of the Palinuro study area was created using bathymetry data, and 3D forward modelling results suggest that the configuration should be capable of detecting a shallowly buried 10 S/m conductive target block of dimensions consistent with a zone of previously drilled massive sulphide mineralization. The conductive target can be detected at receivers located up to ∼100 m away when the transmitter is located directly above the mineralized zone, and the use of a vertical transmitter over a horizontal transmitter would extend the sensitivity to the conductive target by a few tens of metres broadside to the transmitter loop. The sensitivity of the configuration to the conductive target decreases as the transmitter is moved away from the mineralized zone, and when the transmitter is located 100 m from the edge of the mineralization, the receivers are only sensitive to the target when they are located directly above it. The configuration is only sensitive to the conductivity structure of the seafloor between the transmitter and the receiver. When a vertical transmitter is used, the configuration is less affected by changes in height between the transmitter and receiver and target burial depth caused by the bathymetry of the study area compared to a horizontal transmitter.
Data recorded by the remote receivers during the test of the configuration at the Palinuro Seamount were analysed using an apparent conductivity method; results indicate higher apparent conductivities when the transmitter was close to the zone of previously drilled massive sulphide mineralization. Forward modelling also indicates a conductive target block that extends 40 m to the south of the drilling zone, suggesting that massive sulphide mineralization at Palinuro extends southward of the drilling zone by a few tens of metres. This southward extension of the mineralization is consistent with self-potential and heat flow data collected at the site. Our experiment at Palinuro demonstrates that a marine TEM experiment, which only offers a shallow depth of investigation, may be extended by the inclusion of remote receivers to allow for measurements in the configuration. This configuration can compliment shallow TEM soundings by increasing sensitivity to deeper structure and has useful applications in the exploration of electrically conductive massive sulphide mineral deposits on the seafloor.
ACKNOWLEDGEMENTS
We wish to thank the Newmont Mining Corporation, Eldad Haber and David Wynn for access to and assistance with the UBC forward modelling code. This project received funding from GEOMAR, The Colorado School of Mines, and the European Union as part of the Blue Mining project: grant no. 604500, ‘Breakthrough Solutions for the Sustainable Exploration and Extraction of Deep Sea Mineral Resources’. This is an EU-FP7 project.


