Practical and robust experimental determination of c13 and Thomsen parameter δ
ABSTRACT
We analysed the complications in laboratory velocity anisotropy measurement on shales. There exist significant uncertainties in the laboratory determination of c13 and Thomsen parameter δ. These uncertainties are primarily related to the velocity measurement in the oblique direction. For reliable estimation of c13 and δ, it is important that genuine phase velocity or group velocity be measured with minimum uncertainty. The uncertainties can be greatly reduced if redundant oblique velocities are measured. For industrial applications, it is impractical to make multiple oblique velocity measurements on multiple core plugs. We demonstrated that it is applicable to make multiple genuine oblique group velocity measurements on a single horizontal core plug. The measurement results show that shales can be classified as a typical transversely isotropic medium. There is a coupling relation between c44 and c13 in determining the directional dependence of the seismic velocities. The quasi-P-wave or quasi-S-wave velocities can be approximated by three elastic parameters.
INTRODUCTION
Muckrocks or shales make up about 75% of the sedimentary rocks in volume and are becoming important reservoir rocks for hydrocarbon resources. Shales are usually anisotropic in elastic properties. The anisotropic properties may have a significant effect on seismic imaging and seismic amplitude interpretations. Therefore, study of the physical properties of shales is important for seismic exploration. Laboratory velocity anisotropy measurements on shales are done routinely nowadays. Shales are often treated as transversely isotropic (TI) media. The measurement results are often reported in terms of Thomsen parameters (Vernik and Nur 1992; Johnston and Christensen 1995; Vernik and Liu 1997; Jakobsen and Johansen 2000; Sondergeld et al. 2000; Wang 2002a, b; Dewhurst and Siggins 2006; Sarout et al. 2007; Sarout and Guéguen 2008; Sondergeld and Rai 2011; Sone 2012; Sarout et al. 2014). Of the three parameters (ε, γ, and δ), δ is the most important parameter for exploration geophysicists because it describes the relation between normal moveout velocity and vertical velocity (Thomsen 1986; Tsvankin 2012). Thomsen (1986) pointed out that δ is an “awkward” combination of elastic parameters, and its physical meaning is not straightforward. In spite of a large number of laboratory measurements, our understanding of the parameter is not clear (Banik 1987; Sayers 2004). Laboratory measurement results show that δ has poor correlation with other Thomsen parameters, and even the normal data range of δ for shales is not certain. Considering the challenges and uncertainties in laboratory velocity anisotropy measurements of shales, different setups for velocity anisotropy measurement have been brought up in recent years. To acquire all the TI anisotropy parameters, traditionally, the measurements are made on three core plugs (Vernik and Nur 1992; Vernik and Liu 1997; Sondergeld et al. 2000) orientated at 0°, 45°, and 90° with respect to the vertical direction. To improve the measurement efficiency, Jakobsen and Johansen (2000) attempted conducting velocity anisotropy measurement on a vertical core plug, and Wang (2002a) designed a setup for velocity anisotropy on a horizontal core. Both setups tried to measure the oblique group velocity on the cylindrical walls of a core plug. Determining c13 and δ is most sensitive to error in the oblique velocity measurement. The oblique velocity measured on the cylindrical wall may have more uncertainty because a flat piezoelectric transducer has a line contact with the cylindrical wall of the sample. If the measurement is made on the axial direction, the whole plane of the piezoelectric transducer can contact the end surface of the cylindrical sample.
Multiple oblique velocity measurements in different directions should significantly reduce the uncertainty in estimating of c13 and δ. The velocity anisotropy measurements by Jakobsen and Johansen (2000) were based on 11 core plugs, and Sone's measurements (2012) were based on five core plugs. In practice, preparation of multiple core samples with accurate direction control from the same depth interval is a very time-consuming and thus expensive process. In actual velocity measurements, most of the time is spent on preparing the sample and putting the sample in and taking the sample out from the pressure vessel. These processes are the most error-prone. Another disadvantage of multiple core measurements is that they can introduce extra heterogeneities and complicate the result. Therefore, it is preferred that reliable velocity anisotropy measurements are conducted on a single core plug. Blum, Adam and van Wijk (2012, 2013) used laser technology to measure the elastic anisotropy based on a single horizontal core plug. In their measurement, no stress is applied to the horizontal core sample. The sample can be rotated freely for group velocity measurements at different angles. Although this technique is innovative, the first-arrival signal is not clear, and it is very challenging to build it into a pressure vessel. The estimated δ values for the two samples under study are quite unusual (i.e., −0.27 for one shale sample and 6.62 for the other). Sarout et al. (2015) tried performing multiple oblique group velocity measurements on a vertical shale sample (the bedding direction is perpendicular to the axial direction of the cylindrical sample). They applied piezoelectric transducers of 6-mm diameter on a vertical core sample with a diameter of 38 mm. Their setup has advantage in simulating the in situ stress conditions, but it may be a challenge to measure the genuine group velocity because the principle of group velocity measurement is that the signal is emitted from a “point” source and received by a “point” receiver relative to the wave travel path.
In spite of a large amount of effort made on velocity anisotropy measurements of shales, the estimation of the critical anisotropic parameter δ still needs significant improvement. In this study, we will try to demonstrate that a reliable and efficient estimation of c13 and δ can be made on a single horizontal core plug.
GROUP VELOCITY AND PHASE VELOCITY MEASUREMENT
 (1)
(1) (2)
(2)
 (3)
(3) (4)
(4) (5)
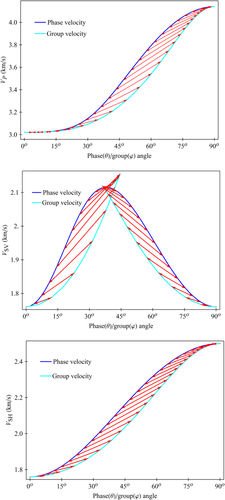
(5)The dynamic principal Poisson's ratios (νV, νHV, and νHH) will change to −0.01, −0.01, and 0.27 from their original values 0.15, 0.27, and 0.22, respectively, if the 45° group velocity is mistaken as the 45° phase velocity. For this sample, the scalar difference between the 45° group velocity and the 45° phase velocity is about 6%. This difference can cause significant error in estimating c13 and δ and lead to erroneous interpretation of the deformation behaviour of the TI medium. Yan, Han and Yao (2012) showed that 1% error in estimating of 45° P-wave phase velocity can cause significant error in estimating c13 and δ. Therefore, for reliable estimation of c13 and δ, maximum effort should be made to ensure that genuine phase velocity or group velocity is measured with minimum uncertainty.
 (6)
(6) (7)
(7) (8)
(8) (9)
(9) (10)
(10) (11)
(11) (12)
(12)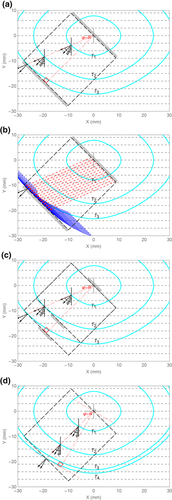
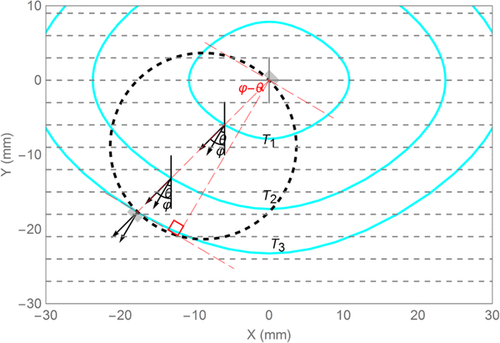
Figure 3 shows wavefront propagation modelling for the oblique velocity measurement on a horizontal core plug. The dashed disk represents the radial cross section of a horizontal shale sample with a diameter of 25.0 mm. The grey bars represent the P-wave piezoelectric transducers. The cyan curves are the wavefronts at different times issued from the centre of the transmit transducer. The basic principle for group velocity measurement is “point source to point receiver” in the sagittal plane passing the TI symmetry axis. The transducer has a point contact with the cylindrical surface of a horizontal plug in cross section and a line contact in a 3D sense. We use the diameter of the sample to divide the travel time, allowing the group velocity to be estimated. The distance travelled by the compressional wave in the corresponding phase direction is represented by the longer leg of the right triangle in red. This distance is not known before the TI elastic properties of the shale sample are estimated. For the oblique velocity measurement on a horizontal plug, if the contacting line between the flat transducer and the cylindrical wall is decomposed into numerous point sources, signals emitted from the sources will arrive on the receiver transducer simultaneously. The transducer does not need to be small enough as a “point” relative to the diameter of the sample as long as the contact between the transducer to the cylindrical wall is close to a “point” in the cross section, as shown in Fig. 3. For the oblique velocity measurement on a vertical plug, if the contacting line between the flat transducer and the cylindrical wall is decomposed into numerous point sources, the signal emitted from the point with the shortest distance to the proximal edge of the receiver transducer will be the earliest to be received. The signals from other points of the line source will be received subsequently at different times. The first-arrival signal is thus geometrically dispersed. To measure the genuine group velocity, the transducer needs to be small enough as a “point” relative to the wave travel path. If the transducer is too small, the wave signal might be too weak for reliable velocity estimation. Therefore, it is more advantageous to measure real group velocity on a horizontal plug than on a vertical plug.
EXPERIMENTAL SETUP AND METHOD
As we analysed earlier, there are significant uncertainties in the estimation of c13 and Thomsen parameter δ.The uncertainties are primarily related to the oblique velocity measurement and can be greatly reduced if multiple oblique velocities are measured. One feasible way to obtain a large amount of reliable laboratory velocity anisotropy measurement data for industrial applications is to make multiple oblique velocity measurements on a single horizontal core plug. The oblique velocities measured on the radial directions of a horizontal core plug are group velocities.
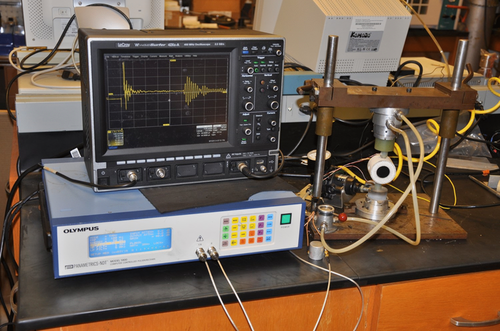
Figures 4 and 5 show the laboratory setup for rotational group velocity measurements. A uniaxial stress of about 300 psi is applied to the shale sample for good coupling between the transducer buffers and the shale sample. The stress can be easily applied and released by letting the compressed air in or out of the gas chamber located below the beam of the benchtop. After releasing the stress, the core samples can be rotated to the next direction for the next oblique velocity measurement. In order to acquire the true group velocity, the end surfaces of the transducer buffers should be flat so that rays are forced to go diametrically across the sample from one point to the other point in the cross section. In a 3D sense, the horizontal core plug has a line contact with the transducer buffers, so the first break signal can be strong enough for accurate travel-time picking. The central frequency of the P-wave piezoelectric transducer we used is about 1 MHz.
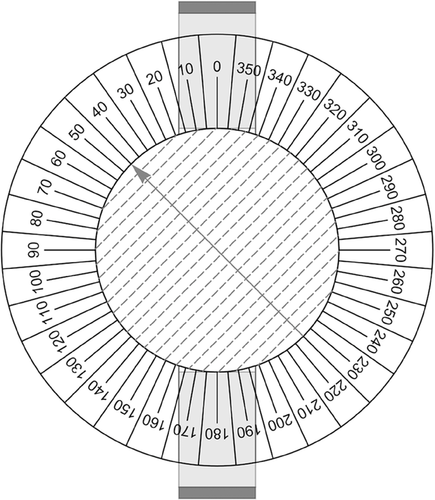
The multiple P-wave oblique velocity measurements cannot acquire all the transversely isotropic (TI) elastic constants. The ultrasonic velocity measurement on a cylindrical sample is usually conducted on the axial direction because the coupling between the transducer and the end surface of the sample is much better than the coupling in the radial direction. Three velocities (VP90°, VSV90°, and VSH90°) can be measured on a cylindrical horizontal shale sample. We did not repeat the measurement on the axial direction because the samples under study were first measured for velocity anisotropy half a year ago on our five-component (VP0°, VP90°, VSV90°, VSH90°, and VPφ45°), single-horizontal-plug velocity anisotropy measurement system (Wang 2002a; Yan et al. 2012). The earlier measurements are primarily used for comparative study. Only the information of VSV90° is used in the estimation of c13 and δ. In both measurements, no attempts were made to change the pore fluid composition, and the pore pressure is the atmospheric pressure.
After the TI elastic constants are determined, the Thomsen parameters (Thomsen 1986) can be calculated by
 (13)
(13) (14)
(14) (15)
(15)MEASUREMENT RESULTS
We made rotational group velocity measurements on two Haynesville Shale samples: sample A and sample B. Figure 6 shows the P-wave signal traces at directions from 0° to 180° with respect to the transversely isotropic symmetry axis, increasing at a 10° interval, for shale sample A. The P-wave signal at 90° (parallel to the bedding) is the usually strongest and clearest compared with the P-wave signals at other directions. For comparison, the maximum amplitude of the each trace is normalised to one. Due to the limited contact area between the buffers and the sample, the first break signal is very weak relative to the later coming signals, but the sequential time variation of the received signals is obvious and in a clear trend, as shown in Fig. 6. The signal around the first break time marked by the dashed rectangle on the trace at 90° is shown in Fig. 7. It is shown that the first-arrival P-wave signals are strong enough for confident first break time picking. The buffer time was deducted from the time axis. The recorded waveform has a time sampling rate of 2 GS/s. The error in first break time picking is less than 0.05 μs. The absolute velocity error caused by time picking can be controlled by less than 1%. By comparing and matching the first-arrival waveforms between different traces, the relative velocity error between different directions should be much smaller than the absolute velocity error. The short bar on each trace shows the first break time we picked.
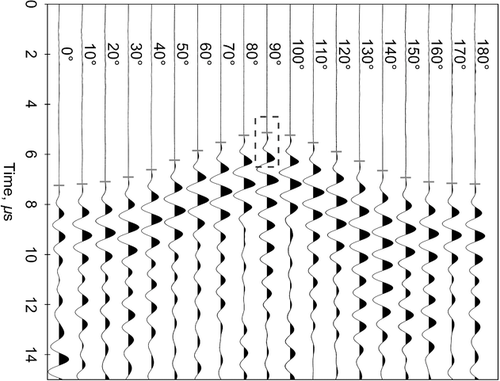
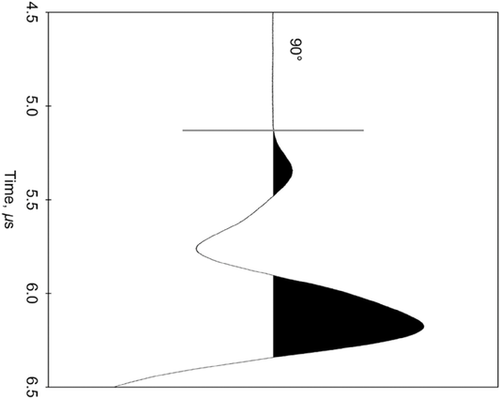
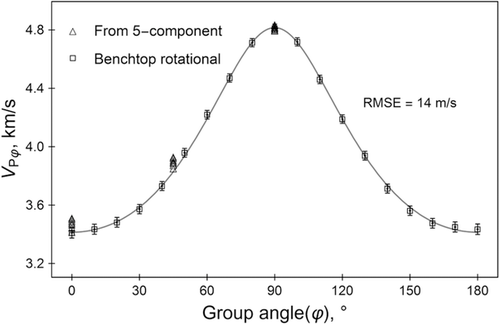
Figure 8 shows the estimated P-wave group velocities from two independent velocity anisotropy measurement systems for sample A. The data points marked by triangles are estimated from the five-component single-horizontal-plug velocity anisotropy measurement system. The different data points at the same angle are from different pressure conditions (at differential pressures from 1000 to 5000 psi). The differential pressure refers to the pressure difference between the confining pressure and the pore pressure. The unfilled squares with error bars are from benchtop rotational group velocity measurements. In spite of different stress conditions, the two independent sets of measurements are generally consistent. For this sample, the stress effect on velocity is much smaller than the directional dependence.
TRANSVERSELY ISOTROPIC ELASTIC CONSTANT INVERSION AND SENSITIVITY ANALYSIS
 (16)
(16)
 (17)
(17) (18)
(18)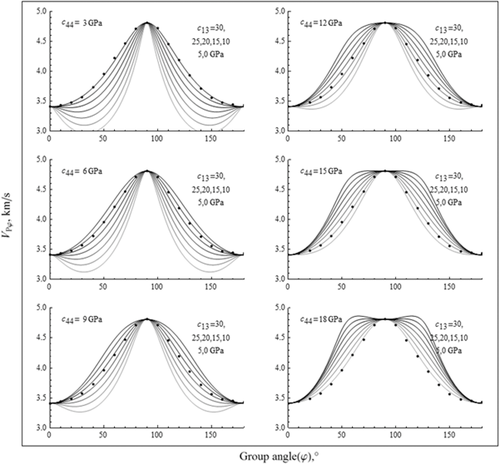
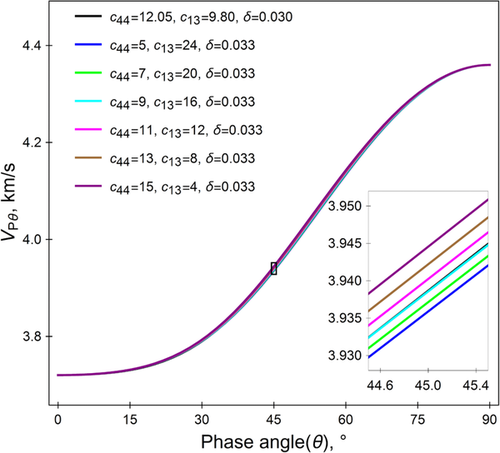
For sake of clarity, we make a further attempt to use the phase velocity, i.e., equation 16, to demonstrate the coupling relation between c44 and c13 because the relationship between the group velocity and the four TI elastic constants is not explicit. In Fig. 10, we made a similar sensitivity analysis based on velocity anisotropy measurement data of a Bakken shale sample from Vernik and Liu (1997). The black curve shows the phase velocity based on the laboratory measurements. c11 and c33 are kept constant, and c44 is varied sequentially from 5, 7, 9, 11, and 13 to 15 GPa. For each c44 value, using the hit-and-miss method, we can always find a value for c13 that can approximately match the phase velocity curve based on laboratory measurements. Although the c44–c13 pairs are drastically different, the phase velocity curves almost overlay with each other. The curves can only be differentiated with each other after significant magnification, as displayed by the inserted plot. The velocity difference is beyond resolution of common laboratory ultrasonic velocity measurements on core samples. Therefore, c44 and c13 are practically impossible to be estimated from multiple oblique velocity measurements. Although the selected c44 and c13 can have quite different values from the measured values, the estimated values of δ are close to the true value as long as the phase velocity curve fits with that based on laboratory measurements.
 (19)
(19) (20)
(20)In the derivation of equation 19, it is assumed that the vertical shear wave velocity is zero (Alkhalifah and Tsvankin 1995; Tsvankin 1996; Alkhalifah 1998). From our analysis, even if an incorrect value of zero is assigned to the vertical shear wave velocity or c44, a correct value of δ can still be obtained. The normal moveout behaviour of the reflection travel time is actually controlled by three elastic parameters: VP0°, VP90°, and δ.
Although we cannot estimate c44 and c13 simultaneously from multiple oblique velocity measurements, c44 can be estimated independently from the slow shear wave velocity measurement in the axial direction (i.e., from VSV90°). For this study, c44 is known from previous measurements (at a differential pressure of 1000 psi) on a five-component single-horizontal-plug velocity anisotropy measurement system. We can estimate c11, c33, and c13 simultaneously by fitting the measured group velocity data using equations 17 and 18. As shown in Fig. 8, the theoretical curve fits the group velocity data almost perfectly. The estimated ε is 0.50, and δ is 0.25 from the rotational group velocity measurements, which are close to the results from the previous measurement on the five-component single-horizontal-plug velocity anisotropy measurement system (ε = 0.49, γ = 0.30 at Pd = 1000 psi). From the above sensitivity analysis, if we arbitrarily give c44 a value, using least squares fitting, we might not obtain the correct value for c13, but the estimated ε and δ should almost be same as the case when the true value of c44 is given. The high-degree of fitting demonstrates that shales can be classified as a typical TI medium.
ANGLE ERROR DETECTION
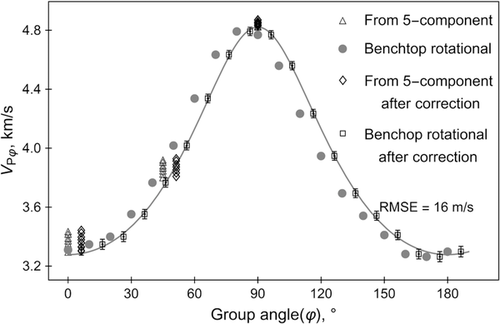
In practical laboratory measurements, it is not always straightforward to identify the bedding direction of the shale sample. If the bedding direction is not correctly marked, all the subsequent velocity measurements are wrong. Sometimes, we can discover this error because the measured data may be inconsistent and do the measurement again with a corrected reference direction. Sometimes, the angle error might not be noticed. In Fig. 11, we plot the rotational group velocity measurement data together with the measurement results from the five-component single-horizontal-plug velocity anisotropy measurement system for shale sample B. From the rotational group velocity measurements, we noticed that the group velocity at 80° is slightly higher than the group velocity at 90°, and the group velocity at 170° is slightly lower than the group velocity at 180°. This is a good indication that there may be a significant error in identifying the bedding direction. As a result, the transversely isotropic (TI) theory cannot fit the measured group velocity trend with satisfaction.
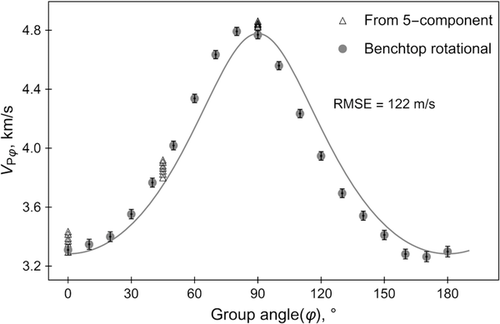
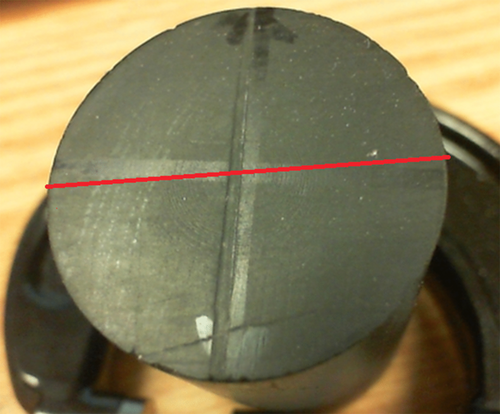
The assumed TI symmetric direction marked on the end surface of sample B was re-examined. As shown in Fig. 12, it is indeed very difficult to tell the bedding direction by a visual check, and the double arrowed black line was originally identified as the direction perpendicular to the bedding. The visible crack only cuts through the edge of the sample and does not extend to the section where oblique velocities are actually measured. It should have little effect on the measured oblique velocities. By careful observation from different viewpoints, we realised that, quite possibly, we made an error in identifying the bedding direction. The red line may be a better judgment of the bedding direction. Considering the possible angle error, we added a variable Δφ, the group angle correction, in the least squares fitting. As shown in Fig. 13, after angle correction, the measured group velocity data can be fitted with the TI theory much better, and the root-mean-square error decreases from 122 to 16 m/s. The estimated Δφ is 6.3°. The velocity data from the five-component single-horizontal-plug velocity anisotropy system are also based on the wrong bedding direction, but only VP0° and VPφ45° are needed to be shifted by the angle correction. VP90° is not shifted because it is measured on the axial direction of the horizontal plug. The Thomsen parameter δ estimated from the five-component single-horizontal-plug velocity anisotropy system is 0.44; it is 0.36 from the rotational group velocity measurements and 0.33 after angle correction. The angle error does not cause significant difference in the estimation of δ for this sample, but as shown by Yan et al. (2012), a 5° angle error can cause greater error in c13 and δ in some cases. Identification and correction of possible angle error is another important reason that justifies the necessity for multiple oblique velocity measurements.
DISCUSSION
As shown in Figs. 6 and 7, the first-arrival signals in the rotational group velocity measurements are very weak relative to the late-arriving signals. The P-wave transducers are made of economical piezoelectric ceramic disks with a central frequency of 1 MHz. They are stuck to PEEK buffers, without any damping material or design to improve the quality of the first-arrival signal. If the transducers are commercially made, the quality of the first-arrival signal can be significantly improved. The stress condition of the rotational group velocity measurement on the benchtop is far from that in situ. If the shale sample has visible cracks along the bedding, the wave signal in the direction perpendicular to the bedding may be too weak for first break time picking, and the sample can easily be broken under uniaxial stress of hundreds of psi. It is preferred that the multiple oblique velocity measurement unit be built into a pressure vessel. It is too expensive and technically challenging to build a rotating mechanism into the pressure vessel. A practical way is to add more P-wave transmission–receiver pairs on the jacket in radial directions based on the five-component single-horizontal-plug velocity anisotropy measurement setup (Wang 2002a). Limited by the circumference of the core plug or jacket, the P-wave transmission–receiver pairs can be separated into three groups located on different positions along the axial direction of the sample or jacket. Each group can have three or four pairs of P-wave transmission–receiver pairs in the radial cross section, and therefore, 9 or 12 P-wave velocities can be measured in different directions with respect to the TI symmetry axis. It should be noted that this system is limited to velocity anisotropy measurements under hydrostatic stress conditions. The measurement results might not directly apply to the subsurface scenarios when the vertical stress is not equal to the horizontal stresses.
CONCLUSIONS
The rotational group velocity measurement results show that shales can be classified as a typical transversely isotropic (TI) medium in terms of elastic properties. It is feasible and necessary to make multiple oblique P-wave velocity measurements on a single horizontal core plug to reduce the uncertainty in estimating c13 and Thomsen parameter δ. There is a coupling relation between c44 and c13 on the directional dependence of the seismic velocities in TI hydrocarbon source rocks. The coupling relation confirms the theoretical soundness of estimating the anisotropy parameters from seismic data using the velocity analysis technique.
ACKNOWLEDGEMENTS
This study is sponsored by the Fluids/DHI Consortium of Colorado School of Mines and the University of Houston. Special thanks are given to Joel Sarout for his critical review and many constructive suggestions. The authors would like to thank two anonymous reviewers for their generous help in improving this paper.


