Integrating basin modeling with seismic technology and rock physics
ABSTRACT
We explore the link between basin modelling and seismic inversion by applying different rock physics models. This study uses the E-Dragon II data in the Gulf of Mexico. To investigate the impact of different rock physics models on the link between basin modelling and seismic inversion, we first model relationships between seismic velocities and both (1) porosity and (2) effective stress for well-log data using published rock physics models. Then, we build 1D basin models to predict seismic velocities derived from basin modelling with different rock physics models, in a comparison with average sonic velocities measured in the wells. Finally, we examine how basin modelling outputs can be used to aid seismic inversion by providing constraints for the background low-frequency model. For this, we run different scenarios of inverting near angle partial stack seismic data into elastic impedances to test the impact of the background model on the quality of the inversion results. The results of the study suggest that the link between basin modelling and seismic technology is a two-way interaction in terms of potential applications, and the key to refine it is establishing a rock physics models that properly describes changes in seismic signatures reflecting changes in rock properties.
INTRODUCTION
Basin and Petroleum System Modelling (BPSM) is a powerful tool in hydrocarbon exploration because it allows testing different geologic scenarios and their associated potential for oil generation, migration, and accumulation. Sedimentation, erosion, subsidence, and uplift in the geologic history of the basin are modelled while simultaneously simulating the evolution of thermal and pressure history (Hantschel and Kauerauf 2009; Peters 2009). BPSM dynamically models changes in rock properties through geologic time by numerically solving coupled partial differential equations with moving boundaries on discretized temporal and spatial grids. BPSM outputs many different rock properties, including properties such as vitrinite reflectance, temperature, effective stress, and porosity (Hantschel and Kauerauf 2009; Peters 2009). Calibration of geologic scenarios is typically accomplished by adjusting basin modelling inputs so that the outputs match with the existing data. Most calibration data such as vitrinite reflectance (a measure of source rock thermal maturity), temperature, and porosity are available just in the borehole vicinity. Seismic attributes, on the other hand, cover a spatially extensive area. Therefore, they offer a potentially more spatially exhaustive and complementary calibration of the basin modelling results away from wells by comparison of basin model estimates and actual seismic data. However, the challenge here is that we need to combine BPSM outputs such as porosity, pore pressure, effective stress, and pore fluid saturations with appropriate rock physics models to estimate seismic attributes from BPSM results.
Extracting seismic attributes such as impedance from seismic impedance inversion requires appropriate controls on the low-frequency background trends. Although low-frequency components of seismic data below 10 Hz experience less attenuation than high-frequency components and hence they can penetrate to deeper targets (Dragoset and Gabitzsch 2007; Brown 2010), such low-frequency components are missing in general seismic data. Consequently, it is a common practice to recover low frequencies when inverting them by combining seismic data with low-frequency background models generated from well logs as depth trends (Tarantola 1987; Cerney and Bartel 2007; Brown 2010). The fidelity of low-frequency models becomes questionable when well-log data are sparsely located or even absent and when the quality of the seismic velocity estimate is low. Seismic impedance trend derived from the integration of basin modelling outputs with appropriate rock physics models may provide additional adequate constraints to generate the background models for seismic inversion.
Rock physics models are key elements in establishing the link between basin modelling and seismic attributes. This study explores the impact of applying different rock physics models to generate BPSM outputs and their associated seismic attributes. We start by assessing the impact of applying different rock physics models on the BPSM estimates of seismic velocities. After this, we explore how the BPSM outputs can be utilized to constrain background models for seismic inversion.
STUDY AREA
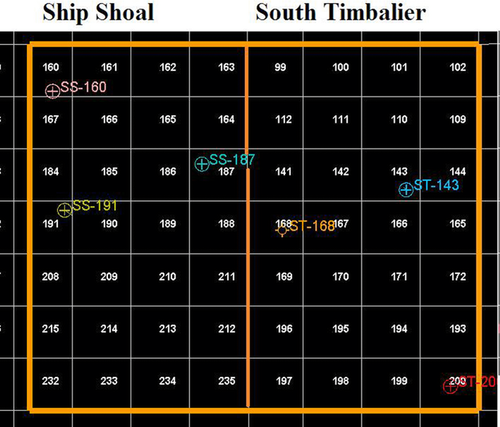
The study area is located in the north-central Gulf of Mexico basin off the coast of Louisiana and includes blocks of both Ship Shoal and South Timbalier fields, as illustrated in Fig. 1. The Gulf of Mexico basin is an ocean basin between the North American plate and the Yucatan block that formed as a result of an episode of extension and seafloor spreading during the Mesozoic break up of Pangaea (Galloway 2008). The structural framework of the basin is dominated by key features like mini-basins and growth faults that are mainly formed by the dynamic interaction between sediment load and salt movement that was deposited in the Jurassic as a large salt sheet known as the Louann Salt. The depositional environment of the basin during Cenozoic was dominated by fluvial systems and wave-dominated deltas and was characterized by high sedimentation rates resulting from formation of the uplands by the Laramide Orogeny (Galloway 2005).

This study uses the E-Dragon II data. It includes 3D seismic data and well-log data, as shown in Fig. 2. The 3D seismic data include post-stack seismic volume, partial angle stack seismic volumes, velocity cubes for depth conversion, and an acoustic impedance cube. The well-log data include standard logs such as gamma ray, sonic, bulk density, resistivity, and neutron porosity logs. The dataset is supplemented with interpreted horizons for the tops of Pliocene and Miocene and biostratigraphic data.
OVERVIEW OF THE METHODS
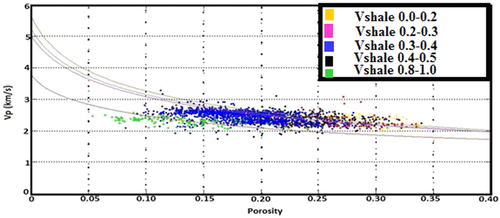
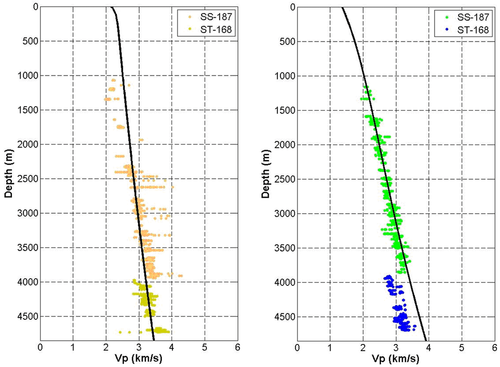
The study consists of three major parts: (a) rock physics modelling; (b) Basin and Petroleum System Modelling (BPSM); and (c) seismic impedance inversion. We started the study with rock physics modelling. In this part, we modelled relationships that describe how seismic velocities, Vp and Vs, change with porosity, effective stress, and pore pressure. We first modelled the relationship between Vp and Vs using sonic log data at ST-168 that has both P- and S-wave logs. Then, we modelled Vp-porosity relationships at well SS-187 for the different lithofacies associated with different volume fractions of shale (Vshale). This well was selected because it has extensive P-wave sonic log and neutron porosity log. The details of this modelling are given in the following sections. Finally, we characterized changes of Vp with effective stress by modelling the normal compaction trends of Vp with depth for both sandstone and shale at two wells SS-187 and ST-168.
The next part of the study is basin modelling at wells SS-187 and SS-160 where we had reasonable age control and calibration data for the basin models. We examined the effect of applying different rock physics models on estimating Vp and Vs from BPSM. The goal is to calibrate the basin models to available sonic Vp and Vs data. Following an initial calibration step based on porosity and drilling mud weight data, we used three different methods to estimate Vp and Vs from basin modelling results. This gives us additional calibration and can be used potentially to calibrate basin models away from the wells using Vp- and Vs-related seismic attributes. It can be also used to calibrate at wells that do not have geochemical calibration data but have sonic logs available.
The last part is angle-dependent inversion (Anderson and Bogaards 2000; Jarvis, Folkers, and Mesdag 2004) of near angle partial stack seismic data into near angle elastic impedance. In this part, we first explored the impact of the background model on the inversion results by running different inversion scenarios in which we varied the inversion algorithm and the weight assigned to the background model. After running the inversion scenarios, we tested how BPSM estimates of seismic velocities and density can help constrain the low-frequency background model for seismic impedance inversion.
ROCK PHYSICS MODELLING
In this section, we present the result of modelling the rock physics relations, which can be divided into three major parts: (a) Vp–Vs modelling; (b) Vp-porosity modelling; and (c) Vp-effective stress modelling. We also provide some background information about the rock physics models we used.
 MODELLING
 (1)
(1) (2)
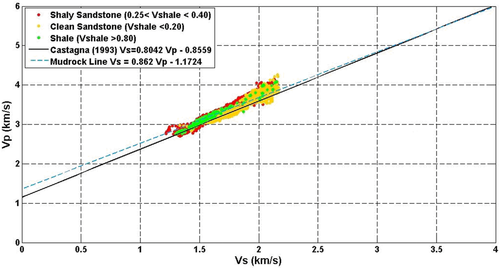
(2)We fitted the entire well-log data of Vp and Vs measurements for clean sandstone, shaly sandstone, and shale at well ST-168, as shown in Fig. 3 with these two relationships. The relationship in equation 1 is a fair fit for the clean sandstone data yielding a correlation coefficient of 0.88. The shale and the shaly sandstone are generally better fitted with the mudrock line in equation 2 with correlation cofficients of 0.85 and 0.82, respectively. These results suggest that the estimated S-wave logs in other wells using equation 1 are overall an acceptable estimation. In later parts of the study, we volumetrically averaged equations 1 and 2 when estimating Vs from Vp according to Vshale values.
 -POROSITY MODELLING
 and shear
  moduli for a dry rock at the critical porosity φb (which we assumed to be 0.4) using the contact-cement model (Dvorkin, Nur, and Yin 1994) that simulates reduction of initial porosity by precepitation of a constant amount of cement. Then, using the equations for the lower Hashin–Shtrikman bounds, we interpolated dry-rock bulk (
 ) and shear (
 ) moduli for smaller porosities (Avseth et al. 2000):
 (3)
(3) (4)
(4) (5)
(5)
 (6)
(6)
 -EFFECTIVE STRESS MODELLING
 (7)
(7) (8)
(8)
ONE-DIMENSIONAL BASIN MODELS
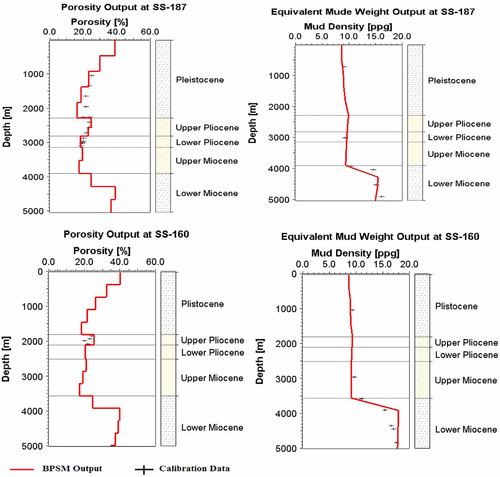
We built 1D basin models by defining the ages of the stratigraphic intervals (Table 1) based on biostratigraphic data combined with interpreted seismic horizons for the tops of Pliocene and Miocene. Then, we used the average Vshale value in each interval to classify the lithology of that interval as a lithology of a specific composition of sandstone and shale. Following this step, we calibrated the porosity reduction by compaction with depth curve of each lithology that was defined by Athy's law (1930) using average porosity values from the corrected neutron porosity log. (We used commercial software, PetroMod, for the basin modelling.) We also used the recorded drilling mud weight as calibration data for the basin model since mud weight programs are planned to prevent both fluid flow from and fluid loss into the formation and, as such, are an acceptable equivalent of pore pressure (Sayers, Johnson, and Denyer 2002). To match the drilling mud weight data, we perturbed the porosity–permeability curves defined by a multipoint model (Hantschel and Kauerauf 2009) for the lithologies after calibrating the porosity compaction curves until the simulation results converged to a good consistency with both the porosity data and the drilling mud weight record, as shown in Fig. 7.
| Stratigraphic Interval | Age (Ma) | Average Vshale |
|---|---|---|
| Pleistocene | 1.77–0.00 | 0.70 |
| Upper Pliocene | 3.58–1.77 | 0.50 |
| Lower Pliocene | 5.32–3.58 | 0.50 |
| Upper Miocene | 7.12–5.32 | 0.50 |
| Lower Miocene | 11.20–7.12 | 0.55 |
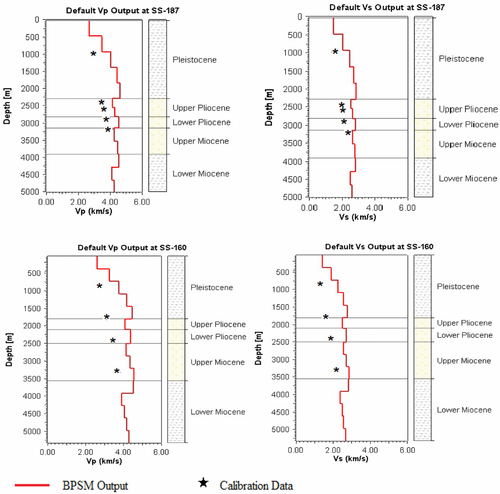
USING SEISMIC VELOCITIES TO CALIBRATE BASIN MODELS
 (9)
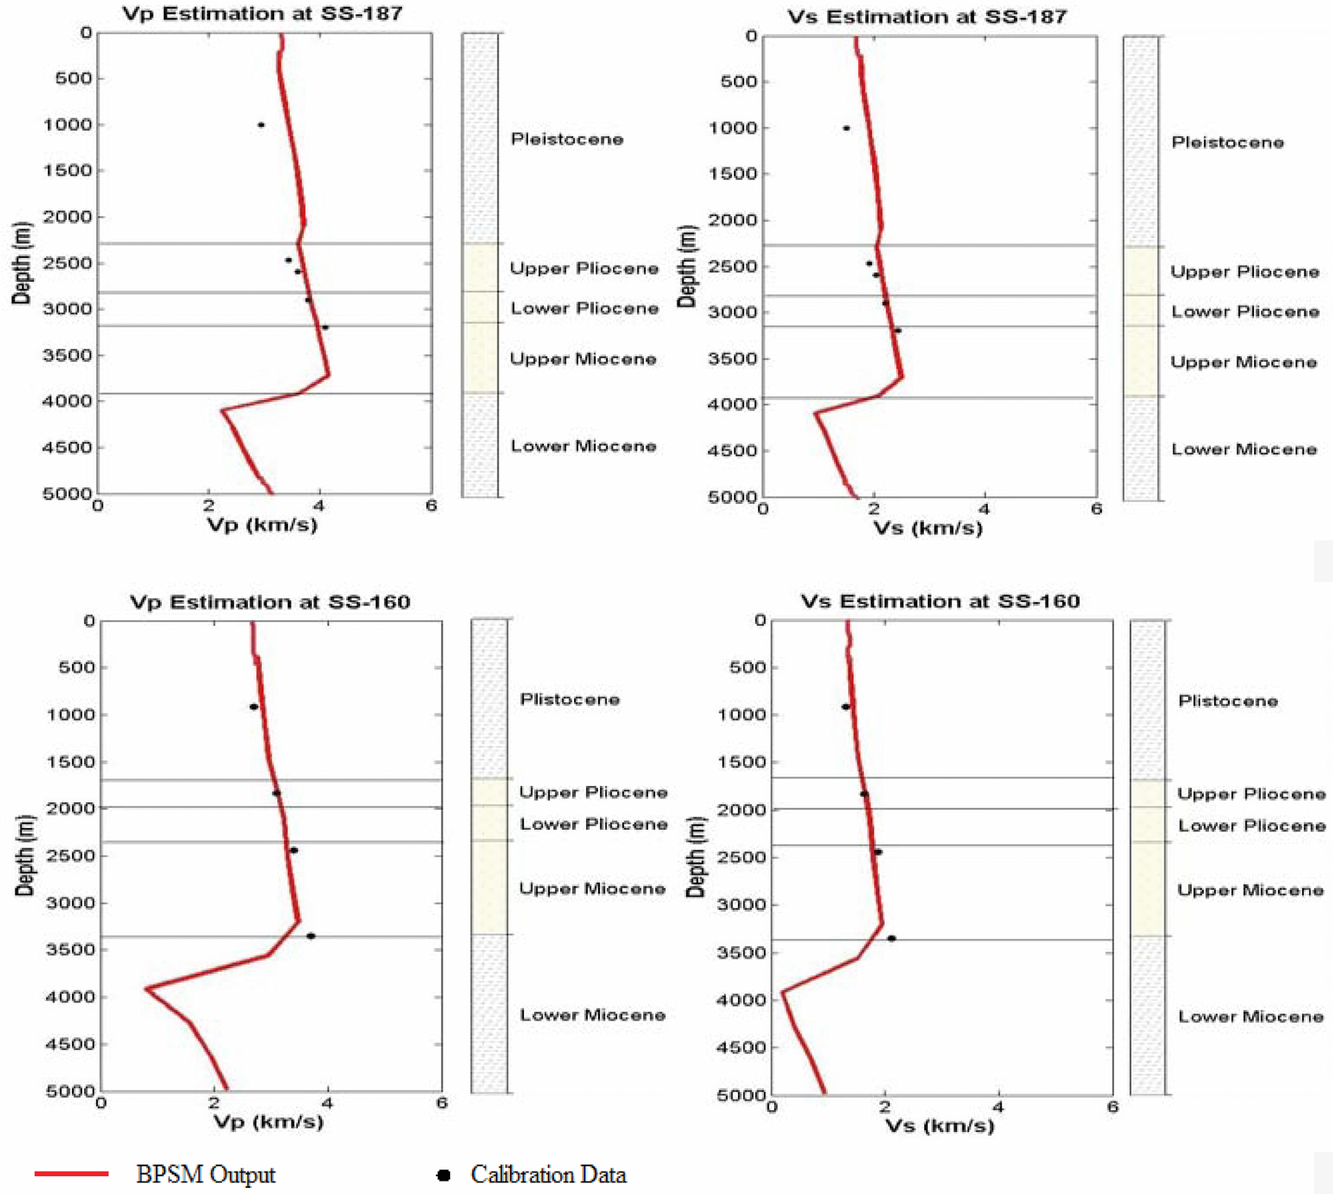
(9) is the vertical effective stress. The trends of the resultant Vp and Vs seem generally acceptable when compared with the calibration data shown in the black markers representing average sonic velocities from well logs. However, these outputs always result in relatively high values of Vp and Vs compared with the sonic log calibration data.
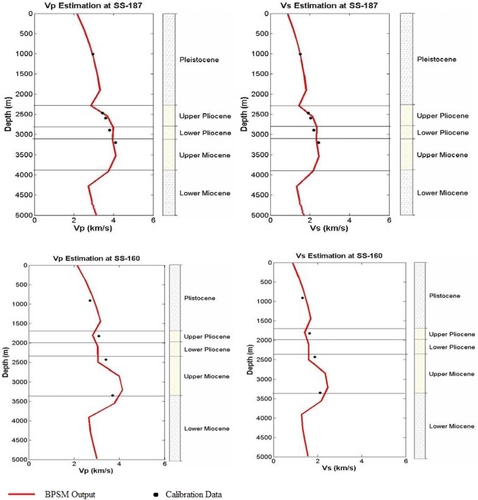
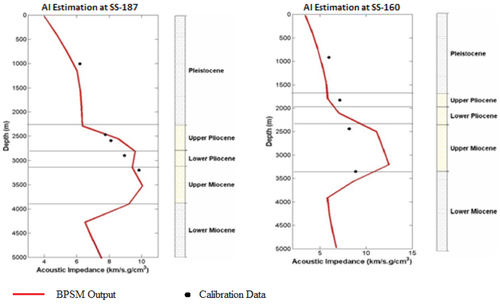
The next method we applied to estimate Vp and Vs from BPSM outputs is by combining the BPSM porosity outputs with our calibrated Vp-porosity models. Then, we computed Vs from Vp by simply applying the selected Vp–Vs relationship. The results of determining Vp and Vs using this method show better calibration to the average sonic velocities, as illustrated in Fig. 9. Having good estimation of seismic velocities from BPSM outputs is important to be able to use other seismic attributes such as acoustic impedance for complementary calibration that is spatially extensive. Example of calibrating the 1D basin models to average acoustic impedance values calculated from the well-log data is shown in Fig. 10. The BPSM estimates of acoustic impedance in Fig. 10 were calculated using the basin modelling Vp estimates in Fig. 9 combined with the BPSM density outputs.
 (10)
(10) is the overburden pressure,
  is the pore pressure,
  is the hydrostatic pressure, and
  is the normal compaction velocity. This method uses the defined normal compaction trends of Vp to calculate Vp from BPSM outputs of lihostatic, hydrostatic, and effective stresses. The normal compaction trend of Vp at each stratigraphic interval in the model was calculated through a volumetrically weighted averaging of the normal compaction trends of sandstone and shale according to the average Vshale value in the stratigraphic interval. Similar to the previous method, Vs was estimated from Vp using the Vp–Vs relationship. The results of Vp and Vs estimation using this method show a good match to the calibration data in Fig. 11. However, these results are characterized by less details in velocity structures when compared with the results from the previous method in Fig. 9. The level of details in the resultant velocities in Figs. 9 and 11 can be related to the level of details of porosity obtained from the basin model and the rock physics model used to relate the BPSM porosity output to velocity. The results of this section show how one might use seismic attributes (such as velocities and impedances) to calibrate basin models, provided we have a calibrated rock physics model relating porosity, lithology, and stress to velocities. We also show that the default rock models within the software may not always be the right ones to use for seismically aided BPSM calibration. This technique would be useful in calibrating the basin models away from wells, where the traditional calibration data (geochemical data, mud weights, etc.) are not available. In the next section, we show an example of how the link can go the other way, i.e., BPSM-aided seismic inversion.
NEAR ANGLE PARTIAL STACK INVERSION
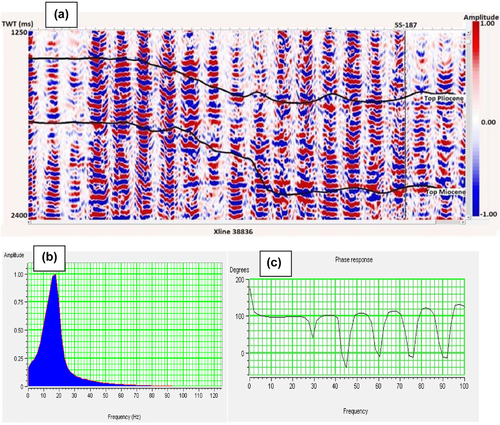
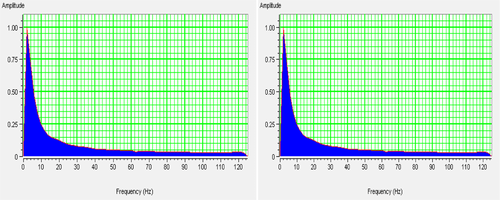
In this part of the study, we test through inversion standard techniques whether outputs from BPSM can be used to constrain the background model used for impedance inversion. One motivation for this idea is the work by Petmecky, Albertin, and Burke (2009) that showed improvement in the velocity background models for depth conversion after constraining them to basin modelling velocity outputs. We will build one background model from the well logs and then compare that with a background model built from BPSM and rock physics outputs in terms of the inversion results obtained with the optimum inversion input parameters. The inversion was done using the near angle partial stack data (0°–16°) at the Pliocene zone. This zone was defined based on the interpreted horizons in the time domain for the post-stack seismic data shown in Fig. 12. The figure also shows the associated frequency and phase spectra of the data. Although these data have some quality issues for producing high-quality inversion results desirable for reservoir characterization, we can still use the achievable inversionsto compare results obtained with a convential background model constrained to the well logs versus the results obtained through a background model constrained to BPSM outputs. The goal of this section on inversion is not to establish any new inversion methods but is simply to show the potential application of linking seismic inversion to BPSM using industry-standard inversion techniques.
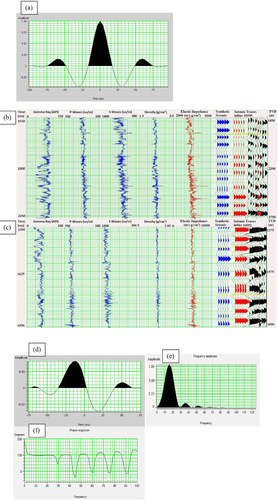
At the start of the inversion, we first tied the synthetic seismogram generated by convolving an initial statistically extracted zero-phase wavelet (Fig. 13(a)) extracted from seismic data at the Pliocene zone with reflectivity series derived from P-wave and S-wave sonic logs and density logs at wells ST-143 and SS-160. The synthetic seismograms were generated using the Zoeppritz equation for reflectivity (1919) and Connolly's elastic impedance (1999) equation for non-normal reflectivity. After obtaining a good correlation between the synthetic seismograms at wells ST-143 and SS-160 and the seismic data with cross-correlation cofficients of 0.71 and 0.68, respectively, we extracted a constant phase wavelet (Fig. 13(d)) using both wells. The cross-correlation cofficient increased to 0.82 at well ST-143 and to 0.75 at well SS-160 when applying the new constant phase extracted wavelelet. The average phase of the extracted constant phase wavelet is 98°, which is about the average phase of the seismic data shown in Fig. 12(c). As Russell (2005) pointed out, the wavlelet and the seismic data have to be the same phase for model-based and sparse-spike algorithms and not necessarily zero-phase. Therefore, we used this constant phase wavelet for inverting the near angle stack seismic data in the subsequent parts.
Following the wavelet extraction, we built an elastic impedance background model shown in Fig. 14(a) using well data. The model was conditioned to the P-wave, S-wave, and density logs from wells ST-143 and SS-160 based on Connolly's equation (1999), as well as the interpreted horizons for the tops of Pliocene and Miocene. A high-cut filter at 10 Hz was applied to the model to avoid any significant overlap with the frequency band of the seismic data shown in Fig. 12(b). Using the same techniques, we built background models in Fig. 14(b) and (c) conditioned to the BPSM outputs in Figs. 9 and 11, respectively, after resampling the BPSM outputs at a sampling of 0.15 m using linear interpolation. The background model in Fig. 14(b) constrained with the Vp and Vs estimates from basin modelling using calibrated Vp-porosity models and the density output is significantly more detailed than the model in Fig. 14(c) constrained with Vp and Vs estimates based on Vp-effective stress models along with the density output. In addition, the background model constrained with Vp and Vs values based on Vp-porosity relations and density outputs more closely resembles the background model in Fig. 14(a) that was condtioned to well-log data. For these reasons, we only considered the models in Fig. 14(a) and (b) to obtain inversion results and compare them with one another.
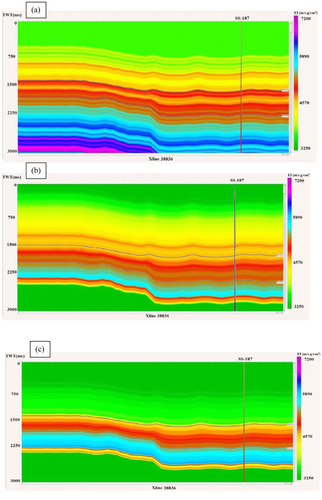
Before running the inversion scenarios, we optimized all the inversion parameters by testing the predicted impedance output at the location of well SS-187. The inversion parameters were optimized by maximizing the correlation between the modelled seismic and original seismic data trace and minimizing the misfit between the predicted impedance values and the impedance values derived from the well logs at that location. (A commercial software package, Hampson-Russell CE8\R4.4.1, was used for the inversion.) Well SS-187 was tied to the seismic data with a cross-corelation coefficient of 0.69. We optimized the best result at well SS-187 with maximum-likelihood sparse-spike inversion algorithm using the following parameters: number of iterations, 15; sample rate, 4 ms; spike detection threshold, 1%; maximum number of spikes, 12001; and background model weight, 0.40. Sparse-spike inversion is processed in trace-by-trace mode, assuming that the reflectivity is modelled by a few large spikes embedded in the background model (Riel and Berkhout 1985; Tarantola 1987; Russell and Hampson 1991). Therefore, sparse-spike inversion attempts to output the simplest impedance model consistent with the seismic data that is characterized by blocky traces and lower continuity in the horizontal direction.
INVERSION RESULTS
We tested two inversion scenarios using the optimum input parameters discussed previously. Scenario I is conditioned to the conventional background in Fig. 14(a). Scenario II is conditioned to the model in Fig. 14(b) constrained to the BPSM outputs. The results of the two inversion scenarios are shown in Fig. 15 along with their cross-correlation coefficients between the modelled synthetic seismic traces and original near angle stack seismic traces. A comparison between the resulting impedance and the calculated near angle elastic impedance from well logs that was bandpass filtered to the same frequency of the impedance values is shown on the same figure. The inversion results show the same frequency spectrum that is richer in the low frequencies as in Fig. 16.
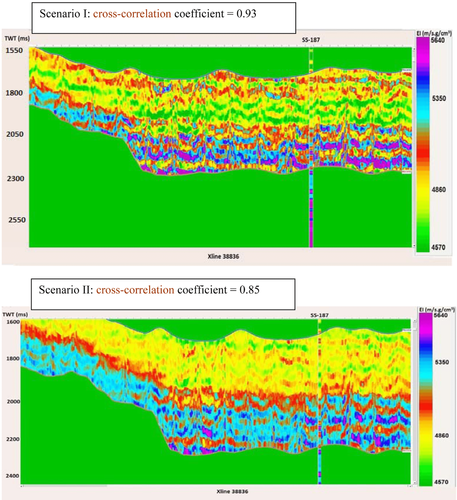
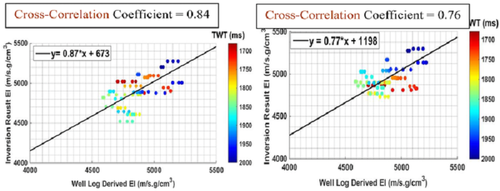
When comparing the overall quality of the results from the inversion scenarios, scenarios I and II show good results in terms of cross correlation with original seismic and the tie with impedance calculated from well SS-187 that was tied to the seismic data prior to the inversion, with scenario I being slightly higher in terms of cross correlation with original seismic. To further explore the quality of results of the two scenarios, we plotted the resulting impedance each at the location of well SS-187 versus the calculated near angle elastic impedance from the logs in that well after filtering the impedances derived from the logs to the same frequency band as that of the inverted impedances (Fig. 17). The resulting impedances from both scenarios show high correlation to the impedance calculated from the logs with scenario I showing a slightly higher correlation value. The inversion results suggest that the basin modelling outputs can constrain a background model used to invert an impedance model at least in some cases.
DISCUSSION
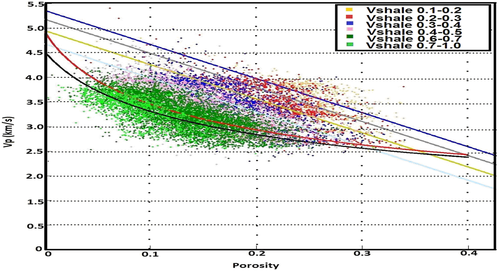
The rock physics modelling results of Vp-porosity relationships suggest that there is a change in the type of trends decribing these relationships above and below 2438 m. The trends of Vp-porosity relations above 2438 m are generally flatter than those below 2438 m. These flatter trends are recognized as depositional trends (Avseth, Mukerji, and Mavko 2005) where textural variations produced by sedimentation are the major factors controlling porosity changes. The trends below 2438 m of Vp-porosity relationships are generally steeper, and these trends are recognized as diagenetic trends in which diagenetic processes such as mechanical compaction or cementation are the major factors of porosity reduction. Overall, the Vp-porosity relationships are complex, and they are influenced by any changes of textural properties of the sediments such as the degree of consolidation and sorting. On the other hand, the models describing the Vp normal compaction trends for sandstone and shale are overall simplistic trends in which Vp smoothly increases with depth as long as the pore pressure of the sediments is hydrostatic.
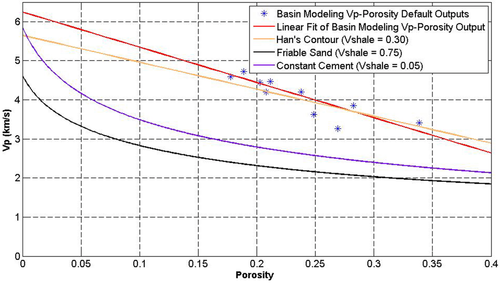
The variations of the 1D basin models velocity estimates indicate high sensitivity of the estimates (and, hence, the velocity calibiration) to the rock physics models used. The default velocity ouputs in Fig. 8 overestimate the seismic velocities because of Terzaghi's compressibility model implemented in determining the elastic moduli. Terzaghi's compressibility in equation 9 assumes that the total change in the induced volumetric strain with change in stress is equivalent to the total porosity loss. This concept simplifies the fact that the total observed induced volumetric strain in a porous medium is a combination of volumetric strain of the mineral matrix and the pores. This simplification leads to overestimating the increase in velocity as porosity decreases and defining very steep Vp-porosity trends. This is illustrated in Fig. 18 by plotting the basin modelling default Vp output versus porosity output at well SS-187 and comparing it with examples of some of the rock physics models of Vp porosity we defined earlier. This line is clearly steeper than Han's contour shown in the figure and has a higher Vp intercept. The Vp-porosity models on the same figure signficantly vary from each other, and using Terzaghi's compressiblity for the entire well is a crude estimation of the Vp-porosity relationship. The results of estimating Vp and Vs (Fig. 9) using Vp-porosity models show more detailed velocity structures than those in Fig. 11 estimated by Vp-effective stress models, and this difference can be attributed to the fact that the stresses vary more smoothly than the porosity. Rock physics models that result in more detailed basin modelling estimates of velocities might be more important when calibrating 2D and 3D basin models with velocities where there are probably more heterogeneities inherent in the model that should be addressed carefully.
The background models conditioned to velocity and density estimates from basin modelling and the inversion results obtained using one of these background models in Fig. 14(b) suggest that there is a potential of using basin modelling outputs combined with the appropriate rock physics relations to constrain the impedance background model. However, the inversion case presented in this study approaches an optimum solution with a simple impedance model. Since BPSM outputs are generally at a very coarse resolution, the applicability of using a background model constrained to BPSM outputs when a sophisticated impedance model is desired should be explored further possibly with a better quality dataset. The reliability of the BPSM estimates of the elastic properties is an important factor when conditioning background models to BPSM outputs as the elastic properties are sensitive to the rock physics model used to derive them. This prompts careful application of rock physics models to determine seismic velocities from basin modelling outputs to condition impedance background models.
Therefore, applying rock physics models that yield more detailed descriptions of velocity changes with rock properties becomes necessary when constraining impedance background models with basin modelling outputs, whereas a simplistic rock physics model might be good enough in calibrating 1D basin models with seismic velocities, as previously illustrated in Fig. 11. The practice of applying rock physics models appropriately to condition background models of seismic impedance or seismic velocities with basin modelling outputs can have some important potential applications in areas where the well-log data do not capture changes in velocities due to geologic changes that may occur away from the well and when the quality of the seismic velocity data is limited. In such cases, basin modelling can address these geologic changes, and appropriate rock physics modelling can then help in predicting the velocity changes. Thus, these velocities from basin modelling and rock physics can complement existing seismic velocity data to improve the depth imaging or even possibly condition the impedance background model for inversion if applicable. An example of these scenarios is sub-salt areas in an overpressured basin where the well logs do not penetrate the overpressured rocks as in the study by Petmecky et al. (2009). Dutta et al. (2015) present another example of using an integrated workflow combining thermal history modelling, and rock physics principles to better constrain sub-salt velocities and improve seismic imaging.
CONCLUSIONS
Based on the results of this study, rock physics is one of the keys to link Basin and Petroleum System Modelling (BPSM) outputs with seismic attributes, and this link is a two-way interaction. For BPSM, basin models can be calibrated to seismic attributes (such as elastic impedances) that are spatially extensive. For seismic inversion, basin modelling outputs can help constrain the background models and low-frequency trends for impedance inversion in some cases and can also constrain velocities to aid seismic imaging. Certainly, the limitations in this two-way interaction when it comes to using BPSM outputs to constrain background models for seismic inversion need to be further tested for inversion cases with a sophisticated impedance model. The required degree of refinement of the link between BPSM outputs and seismic attributes depend on the scope of the study in which the link is applied. Refining the link depends on the rock physics model used. Therefore, it is an important practice to establish rock physics models that quantify changes of seismic attributes with rock properties, diagenesis, and thermal history, and then apply these models to link basin modelling with seismic attributes. The goal of the study and the available data should be taken into full consideration in this practice. When it comes to using BPSM outputs to constrain background models for seismic inversion, a thoughtful consideration about the degree of simplicity of the BPSM output and the degree of simplicity of the desired final impedance model from inversion should be taken into account.
ACKNOWLEDGEMENTS
The authors acknowledge the “well-log data Copyright (2013) IHS Energy Log Services Inc.”. They would like to thank Schlumberger/WesternGeco for providing the seismic data. They also thank David Greeley from BP for his great support. Funding and participation in this research is made possible through the support of the Stanford Basin and Petroleum System, Stanford Center for Reservoir Forecasting and Stanford Rock Physics industrial affiliate research programs, and Saudi Aramco Scholarship. They would like to thank the reviewers for useful comments.


