On the determination of marine magnetotelluric receiver orientation using land magnetic observatory data
ABSTRACT
Marine magnetotelluric measurements using “free-fall’’ instruments without effective compasses suffer from the problem of unknown orientation of the receivers at the seafloor. While past works indicate that marine magnetotelluric orientation of the instruments can be estimated by reference to land deployments of known orientation using the transfer tensor method, there is limited published information on how this is implemented in practice. We document this method and propose a set of new time- and frequency-domain approaches to solve this orientation problem of the seafloor receivers. We test these methodologies in onshore and offshore magnetotelluric data whose orientations are well known and apply these techniques to marine magnetotelluric data with unknown orientation. For the controlled tests, both time- and frequency-domain approaches produce overall comparable results. To investigate the effects of the subsurface structure distribution on the orientation process, a dimensionality analysis of a controlled dataset is carried out. In subsequent analysis using the available disoriented marine magnetotelluric data from offshore Brazil and from the Vassouras magnetic observatory on the mainland for remote referencing, frequency-domain methods yield approximate orientation angles among themselves with low standard deviation each. Time-domain results are consistent for most cases but differ from frequency-domain results for some situations.
1 INTRODUCTION
The marine magnetotelluric (MMT) method is steadily emerging as a tool for offshore hydrocarbon exploration (Constable et al. 1998; Hoversten, Morrison, and Constable 1998; Sandberg, Wu, and Roper 2008; Fontes et al. 2009), and its measurements made using “free-fall” instruments can have any orientation when they reach seabed. To reduce noise in the magnetic recordings, compasses were not included in some earlier devices that use induction coils for magnetic field measurements; therefore, the orientations of the seafloor receivers are unknown for such cases. External electronic or locking mechanical compasses (positioned away from the induction coil magnetometers) are now available and minimize this problem (see, e.g., Constable, Key, and Lewis 2009) but are not failproof. Hence, without effective compasses, MMT data suffer from the problem of unknown orientation of the receivers on seafloor.
The motivation for this paper is that some contractors have not used external compasses in the past, and there are times when the compasses fail to work. In these situations, the apparent resistivity and phase obtained directly from the recordings at each station have unknown coordinate systems. We believe that even in cases where external compasses are used, it is also useful to have processing methods to independently verify the compass readings as a cross-check, taking advantage of the quasi-uniform naturally excited Earth's magnetic field. Key (2003) proposed two approaches for estimating MMT receivers’ orientation that use the magnetic transfer tensor method. In one approach, the relative orientations between one reference (marine) site and all other stations of a marine survey line are obtained using the transfer tensor method, but determining the absolute orientations requires comparative analysis of compass data. In the second approach, the absolute orientations of the MMT instruments are obtained from the transfer function between a remote land MT station of well-known orientation and the MMT sites. Key (2003) successfully applied both techniques to data from the Gulf of Mexico, and Constable et al. (2009) stated that some MMT instrument orientations were estimated by correlating with fields at land references of known orientation but did not provide details of how this was done. Mütschard et al. (2014) developed a methodology to find the relative angles between MMT stations based upon the decomposition of upgoing and downgoing electromagnetic (EM) fields and succeeded when compared with orientation evaluated from controlled-source EM (CSEM) data based on Mittet et al. (2007). Here, our goal is to build upon these earlier transfer tensor studies and to document an alternative coherence-based practical approach for estimating the seafloor orientation of the MMT instruments.
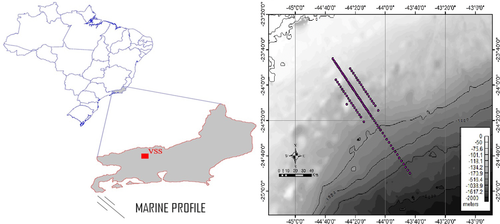
To accomplish our goal, we first test different approaches for estimate the receivers’ orientation using controlled data from MT stations in land and marine environments. Next, an analysis of the relation between the dimensionality of the MT data and the orientation evaluated for the involved stations is carried out to support that the methodologies can be applied in a variety of geological situations. We then apply the techniques to available MMT data (Fontes et al. 2009), whose orientation is unknown, to estimate their orientation. Data from an onshore magnetic observatory in Vassouras City, Brazil (hereafter station VSS), run by Observatório Nacional, is used as reference station with well-known orientation. Fig. 1 shows VSS and the MMT stations, located in the neighbouring petroliferous Santos basin in southeast Brazil. Notice that the definition of the stations’ rotation angles does not imply any electrical strike direction as in MT data analysis but refers to receiver misalignment errors. We merely seek the real orientation angle between the geographic north and the x-axis of each of the MMT stations individually.
2 METHODS FOR DETERMINING RECEIVER ORIENTATION
The following subsections describe different approaches to obtain the relative orientation angle between two stations by analysing their respective naturally time-varying horizontal magnetic fields. Frequency-domain-based techniques are described in Sections 2.1 and 2.2, whereas the time-domain approaches are presented in Section 2.3.
2.1 Magnetic transfer function approach
 (1)
(1) (2)
(2)The elements of T describe the interaction of the horizontal components of magnetic fields between reference and survey stations due to the effect of geo-electrical structure between such stations, and mathematically, Z and T have similar properties. Assuming noise-free data and plane-wave source field, for a 1D property distribution where the resistivity variation occurs only in the vertical direction,  and
and  In a 2D structure, where the resistivity variations occur in both the vertical direction and one horizontal direction,
  , and
, and  only for x or y aligned to the horizontal boundary of resistivity variation (i.e., the direction of geo-electric strike). For a 3D structure where the resistivity variation takes place in all directions, the elements of T will neither have symmetry nor zero values.
 , given by
 (3)
(3) is the rotation matrix adopted to be in the clockwise direction given by
 (4)
(4)Hereinafter, the superscript’ on a magnetic vector denotes that it is not in geographic coordinates, i.e., its x-direction do not points toward north and its y-direction toward east, whereas its absence means geographic coordinates. The same superscript on a transfer tensor means it relates measurements with different orientations, which means that involved stations are not aligned. It will be often assumed that the reference station is oriented in geographic coordinates.
 is retrieved, equation 3 becomes
 (5)
(5) is the rotated magnetic transfer function, whose rotation angle is α, which is simply the angle between the two arbitrary directions between
  and
and  (or
(or  and
and  ).
).Equations 6 and 7 show that a given horizontal component at the reference station is related to contributions of both horizontal components at the survey station. If the off-diagonal tensor terms  and
and  are insignificant as in the 1D case, then the coherence between
  and
and  and therefore
  and
and  will be maximal and provides a criterion for finding the correct orientation of seafloor marine MT (MMT) instruments. This may not be the case for 2D and 3D situations with the MMT sensors oriented at arbitrary angles; thus, a dimensionality analysis will be carried out.
 , and taking advantage of the rotation matrix identity
  (superscripts T and −1 stand for transpose and inverse, respectively), we deduce a relationship between the aligned magnetic transfer function T (of interest) and rotated
  (calculated; see Section 2.1.1) given by
 (8)
(8)In this way, instead of rotating magnetic fields and consequently evaluating  for each angle,
  is numerically obtained, and the transfer tensor for any rotation angle is then obtained from equation 8. The angle α that aligns h0 and h1 is calculated by evaluating
  for α ranging from 1° to 360°, then finding for which angle α there is a maximum of
  and the positivity of the real parts of
  and
and  ,
,
2.1.1 Calculating the magnetic transfer function T from real data
 , which corresponds to a matrix of all vector products averages; and (ii) U, which is associated with the two largest eigenvalues of
  scaled by the covariance matrix of the noise. Matrix U ideally represents the electromagnetic field that would be observed at all sites for linearly polarized quasi-uniform magnetic sources.
  is defined as
 (9)
(9) is the frequency-domain MT array data vector
 (10)
(10) and
and  are the Fourier coefficients of magnetic and electric fields components computed for the ith time segment at the jth site; and the symbols < > represent stacking (summing)
  over the whole dataset.
 for cases that only the two-polarized plane-wave is acting as the source. When
  , coherent noise is present. The coherence dimension corresponds to the amount of eigenvalues significantly greater than one extracted from the rescaled spectral density matrix
  , defined as
 (11)
(11) is the covariance matrix of noise, and it takes a diagonal form (
 , where
  is the variance for the ith channel). For further detailed discussions regarding the covariance matrix
  , see (Egbert 1997, Appendix A).
 scaled by the covariance matrix of the noise, is estimated by
 (12)
(12) is a
is a  matrix consisting of the two dominant eigenvectors of
  . The estimated transfer tensor
  between any pair of channels and all other channels in the array data x may be computed by partitioning U into a 2 × 2 matrix U1 containing the single pair of channels, and a
  matrix U2 containing all other channels, through
 (13)
(13)2.2 Coherence approach
 remaining channels, which include onsite (such as impedance tensor) and inter-station transfer functions. The resulting estimate
  that relates
  (in opposite to Equation 2, where the subscripts 0 and 1 are interchanged) can be used to calculate the predicted magnetic field at the survey station
  given by
 (14)
(14) hereinafter referred to as “predicted coherence”; moreover, it is possible to evaluate
  , which is referred to as “measured coherence” or simply “coherence.” The squared coherence between any two selected fields is the ratio of their cross-correlated field spectra divided by their two auto-power spectra
 (15)
(15) The superscript * denotes complex conjugate, and
  represents an ensemble mean of the product
  of all time-series segment. The notation
  is also employed. First, in order to implement squared coherence analysis, the magnetic field data of survey station is rotated in 1° steps over 360°, whereas those of the reference site are kept fixed, coherences are calculated, and the results from all the frequencies are averaged. Second,
  replaces h1, and all previous calculations are carried out again.
 , and in order to obtain coherence between any pair of channels, e.g.,
  and
and  , equation 15 yields (for simplicity, omitting α)
 (16)
(16) or even h0 directly; therefore, we will define two matrices M1 and M2 that contain the vector products
  and
and  , respectively. They are derived from equation 3 as
 (17)
(17) (18)
(18)For the case of  (equation 16), the elements needed are M111 and M211.
  is directly obtained from
  .
.
 , for example,
  and
and  , equation 15 takes the following form:
 (19)
(19) and
and  , which contain the desired vector product as
 (20)
(20) (21)
(21)Therefore, it is possible to calculate parameters such as those involved on equation 19. Repeating the search methodology of the transfer tensor, the coherences (measured or predicted) are evaluated for every degree ranging between 1° and 360°, and the resulting orientation angle will be the one that maximizes coherences of equivalent data channels. The ambiguity is solved the same way as for the magnetic transfer function approach, i.e., the correct angle has to obey the condition that the real parts of  and
and  should be positive.
2.3 Difference- and correlation-coefficient-based time series approaches
 between two N-points time series
  and
and  is
is
 (22)
(22) (23)
(23)Using the Cauchy–Schwartz inequality, one can show that  , which means that equation 23 describes r as the centered and standardized sum of vector products of two variables, and can be evaluated for both directions. In the case of parallel alignment,
  , whereas for anti-parallel alignment,
  .
.
In practice, separately for x- and y-directions, after correcting for instrument responses, both time series will be split in a sequence of time-coincident 50% overlapping segments, and  and r will be calculated for all rotation angles for each segment. The angles that minimize
  and maximize r will be considered the orientation angle for the present segment. Then, weighted mean and its respective standard deviation of orientation angles from all segments will be evaluated to obtain a more reliable orientation angle, instead of applying the procedures of equations 22 and 23 to the whole time series. The respective weights will be the inverse of
  for the difference method and r for the correlation-coefficient method of each segment. As a consequence of two methods applied independently in the
 - and y-directions, there will be four orientation angles (each with its own weighted standard deviation) retrieved through time-domain methods; again, a weighted mean can be applied in order to refine results. Notice that special care must be taken in this point since weighted mean of only four values will be calculated, which is statistically very poor, as a single outlier value can severely bias the final result.
Next, we will test the proposed methodologies under a controlled experimental condition and then will apply it to a set of MMT disoriented real data.
3 ANALYSIS OF REAL CONTROLLED DATA
To test the described methodologies, it is instructive to evaluate first the above concepts under controlled survey conditions. As an initial test, one magnetotelluric (MT) land station is selected and replicated, and the coordinate axes of the replicated station are rotated by 30°, mimicking a station with unknown orientation. We applied the techniques previously described to check whether we can recover the correct receiver alignment of the mimicked h1 station using the original station as the reference h0. The outcome of this proof-of-concept test for the magnetic transfer tensor method (Key 2003) is shown in Fig. 2 for a period of 20 s, where the absolute quantities  and
and  are plotted in the top panel, whereas the real components of
  and
and  are plotted in the bottom panel. Notice that the maximum of
  , the minimum of
  , and the positivity of the real parts of
  and
and  occur at a relative angle of 30°. The results for all periods in Fig. 3 show well-behaved orientation angles evaluated for periods up to
  , whose mean equals 29.9° with 0.4° standard deviation (dashed line in Fig. 3). The entire range of periods yields 27.4° orientation angle with 14.7° standard deviation. The reason for the high dispersion above
  lies in an ill-conditioned matrix U1 in equation 13 since both U and
  have, for this case, ideally, determinant equal 0 (or nearly 0, in practice), combined with the decreasing amount of samples for longer periods that compromises the statistical analysis. What lies behind the determinants that are not equal, but close to 0, is the rounding involved in the rotation process of the time-series, which breaks the full linear dependence between h1 and h0, and for periods smaller than
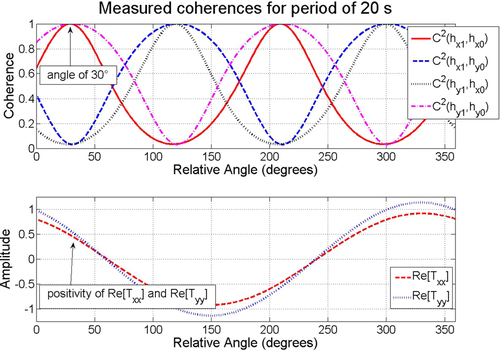
  , associated with a large amount of samples, the problem becomes stable. This problem is not observed when independent stations are involved, for any number of samples per frequency, as will be seen in the next controlled test. Results for the rotation analysis based on squared coherence are shown in Fig. 4 for period of 20 s, with maximum squared coherence at 30° and 210° (i.e., 180° ambiguity) for pairs
  and 32° and 212° for
  . Solution to 180° ambiguity can be solved by requesting
  and
and  , as shown in the lower panel of Fig. 4. As expected, the peak squared coherences for
  and
and  occur at 90° away from those of
  and
and  , respectively. For measured squared coherence approach, the results obtained for all periods are shown in Fig. 5, whereas results obtained through predicted squared coherence
  are shown in Fig. 6. Notice that the same high dispersion present in Fig. 4 also appears here for the same reason since predicted squared coherences are also based on the magnetic transfer function, whereas measured squared coherence does not involve the calculation of an inverse. In this case of an ill-conditioned matrix, no dispersion for the longer periods was observed. Mean orientation angle and standard deviation for predicted coherence-based results, excluding periods above 100 s (high dispersion interval), are 30.3° and 0.4° for
  and 31.7° and 0.5°, respectively, for
  . The difference between time series was minimum for angle of 30°, for which the correlation coefficient was maximum, for both directions.
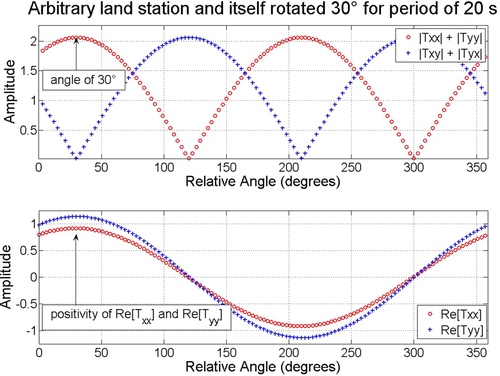
 with respect to its reference site with known orientation. The top panel shows the absolute quantities of
  and
and  , whose maxima occur at
  and
and  . The bottom panel shows the real components of
  and
and  , which are positive for angle of
  .
.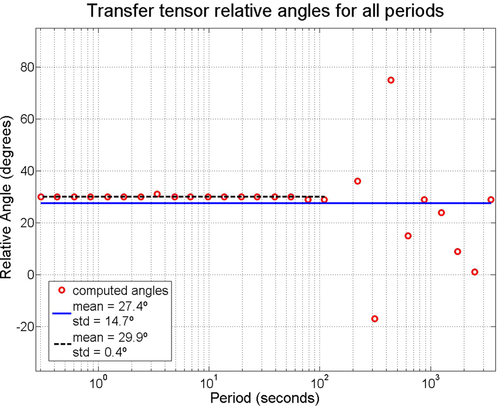
 s), and an average angle of 27.4° and standard deviation of 14.7° when considering all periods.
 and
and  .
.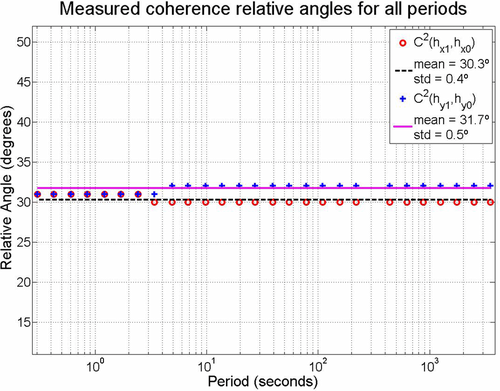
 and 31.7° (0.5°) for
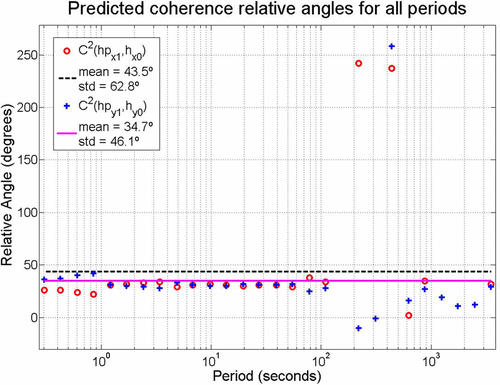
 and measured
  for both directions. Notice the same high dispersion of periods higher than 100 s of Fig. 3, a consequence of the use of magnetic transfer tensor in its calculation.
Second, we sought the relative angles among three land MT stations which were, supposedly, equally (at least, nearly) oriented, named stations A, B, and C, whose inner distances are  ,
,  , and
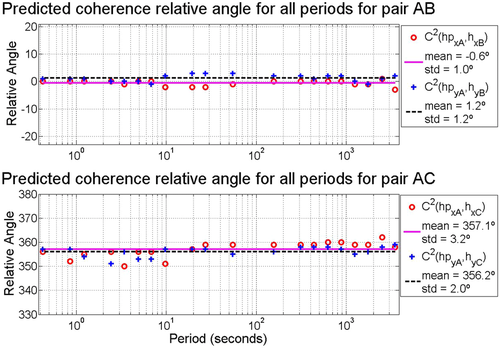
, and  They are all considered to be within the remote reference limits (Shalivan and Bhattacharya 2002), considering that the periods evaluated are ranging from ∼1 s to ∼1000 s. The relative angles evaluated using the transfer tensor approach are shown in Fig. 7, where it can be seen that the high dispersion of longer periods is not observed, once the stations involved in the
  evaluation have independent measurements. Orientation angles for measured squared coherences are shown in Fig. 8 and for predicted squared coherences in Fig. 9, for pairs AB and AC and all periods. Time-domain analysis for pair AB, respectively, for the x- and y-directions, resulted in a minimum difference at angle of
  (standard deviation of 1.3°) and 3.8° (0.8°), and a maximum correlation coefficient at
  (4.3°) and 4° (6.5°), resulting in a final orientation angle through weighted mean of previous values of 2.0° (4.1°). For pair AC, the values for x- and y-values of
  and r (with own standard deviation on parenthesis as well), respectively, are 6.1° (1.6°),
  (2.9°), 5.1° (1.6°) and 4.5° (2.8°), and final orientation angle at 4.3° (0.7°).
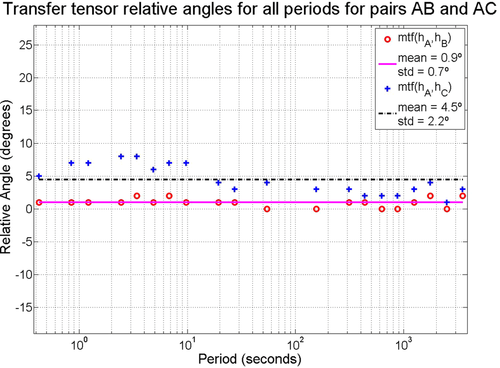
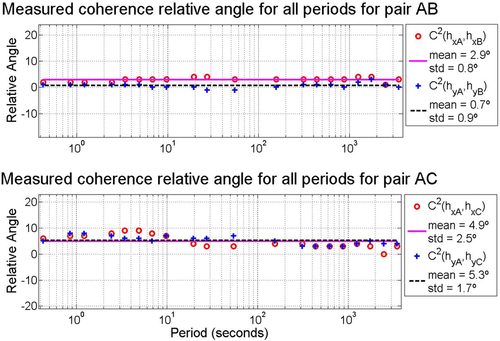
 and
and  .
.
 and
and  .
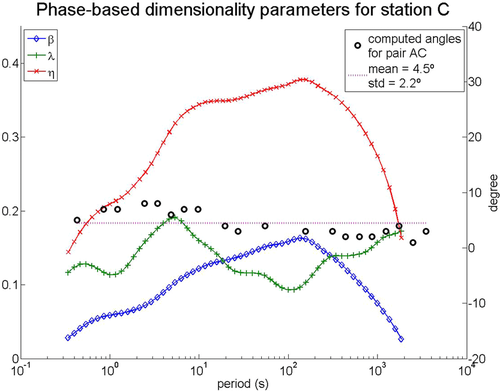
.To provide better assessment of the reliability of the orientation methodologies presented, a dimensionality analysis of this dataset is carried out. Chave and Jones (2012) advocate that dimensionality indicators based on the amplitude of impedance tensor elements, such as Swift skew (Swift 1967), ellipticity (Word, Smith, and Bostick, 1970) and polar diagrams, are more subject to errors than phase-based ones; thus, dimensionality considerations were performed based on phase-tensor parameters (β from Caldwell, Bibi, and Brown 2004; λ from Bibby et al. 2005), the Bahr's phase-sensitive skew (η from Bahr 1988) and the WAL invariants (Weaver, Agarwal, and Lilley 2000) through the use of WALDIM (Martí, Queralt, and Ledo 2009). For a 1D resistivity distribution, β and λ are supposed to be zero. For a 2D or pure 2D distorted by 3D body (called as 3D/2D), β remains 0, whereas λ varies, and for a 3D distribution, β and λ are different from 0. Bahr (1988) established threshold values for analysis of η, stating that, for  , data should be regarded as 1D, 2D, or 3D/2D; for
  , data are considered indicative of a modified 3D/2D form called the delta (δ) technique; and for
  data are 3D. However, Martí et al. (2005) suggested that
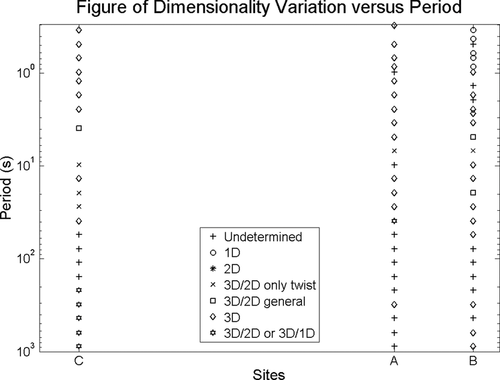
  should be considered to represent 3D data, after analysing statistically Bahr's phase-sensitive skew. The distribution of β, λ, and η versus period for station C is shown in Fig. 10 together (with evaluated orientation angles via magnetic transfer function for pair AC). Bahr's skew η suggests that data can be entirely 3D in the period range considered, according to threshold values from Martí et al. (2005) or at least for most of the range considering Bahr's (1988) threshold values. Phase-tensor parameters suggest at least a 2D distribution, allowing for a 3D interpretation as well. According to WALDIM analysis (in terms of data dimension), shown in Fig. 11, apart from undetermined data dimension, most of the data are regarded as 3D, or with some kind of 3D distortion present. 3D data can be considered one extreme situation to distort magnetic fields, although the variation of the orientation angles is small for all periods – as confirmed by the low standard variation values involved. If there is any kind of correlation (be it strong or weak) between the distortion of the magnetic fields due to lateral variation of the electrical resistivity and the orientation angle evaluated, it cannot be established from this example, which does not imply that it does not exist at any level. The intensity of the distorted secondary magnetic fields might play an important role in this matter, although no further progress will be done towards this direction.
 and
and  with Bahr's phase sensitive skew
  (left axis) altogether with orientation angles for pair AC based on magnetic transfer function (right axis).
Finally, a test with three controlled-source EM/marine MT (CSEM/MMT) stations around 290 km far away from VSS is carried out, whose inner distances are of order of a few kilometers. For the purpose of correlating measured magnetic fields, we assume that the magnetic field is uniform in the distances considered, although its uniformity within such large distances are still issues currently being debated (for further information, see Gamble, Goubau, and Clarke 1979; Goubau et al. 1984; Larsen et al. 1996; and Shalivahan and Bhattacharya 2002). Very short MMT coincident-time segments were available among all stations since VSS presented data recording problems while CSEM/MMT soundings were being acquired. Moreover, the large distances involved, the lack of more stations for multi-station processing, and very deep MMT stations, i.e., around 800 m, altogether led to poor results of all methodologies but one. The magnetic transfer tensor recovered one reasonable orientation when compared to the work of Mittet et al. (2007), which uses the CSEM data from source and receivers. Orientations evaluated for station #015 are very close when compared with the magnetic transfer tensor and with that in the work of Mittet et al. (2007), although for #019 and #079, the recovered orientations are less than 15° apart. Table 1 summarizes these and time-domain results, which also did not recover the same orientation as that of Mittet et al. (2007), although for station #015, results differ only by 24°. Time-domain results for station #015 as reference yielded orientation angles equal 288° (standard deviation of 30°) with station #019 and 183° (33°) with station #079, which also did not match results based on the work of Mittet et al. (2007).
| Frequency Domain | ||||||||||||||
|---|---|---|---|---|---|---|---|---|---|---|---|---|---|---|
| Mittet et al (2007) | transfer tensor |
 |
 |
 |
 |
Time Domain (weighted mean) diff + r | ||||||||
| VSS with | angle | std | angle | std | angle | std | angle | std | angle | std | angle | std | angle | std |
| #015 | 348 | 3 | 347 | 1 | 351 | 1 | 335 | 1 | 36 | 76 | 26 | 3 | 324 | 16 |
| #019 | 9 | 1 | 20 | 1 | 2 | 1 | 355 | 2 | 349 | 1 | 1 | 20 | 145 | 35 |
| #079 | 243 | 6 | 256 | 5 | 264 | 3 | 251 | 5 | 286 | 3 | 281 | 9 | 312 | 18 |
At the present, considering all previous tests except for the last involving CSEM/MMT stations, all proposed methods evaluated have similar results, regardless the geometry of the data, and thus, under similar conditions, they are able to recover the true orientation of stations involved. Although all methods, except the magnetic transfer function, seemed to completely fail in the last test, it cannot be regarded as a proof that such methods should not be reckoned as tools for orientation since it was a test under very extreme conditions.
4 APPLICATIONS TO SANTOS BASIN DATA
In 2007, a marine magnetotelluric (MMT) survey was conducted by a geophysical company without any sort of compass in any of the receivers, leading to data with unknown orientation. We expect to effectively recover their true orientation by using the proposed methodologies, once they are apart 130 km to 180 km from VSS. Past studies by Figueiredo, Meju, and Fontes (2008) and Fontes et al. (2009) show that there is good agreement in the SW–NE dominant basement trends onshore where VSS is located and offshore where the MMT survey is located; therefore, a strong 2D signature is likely to be present at the MMT survey site as demonstrated in the multi-physics inversion study by Gallardo et al. (2012). We merely seek to orientate just one MMT station with respect to VSS since this one then will play the role of a reference site in the subsequent receiver alignment to determine the orientation of the next neighbouring station. As VSS has a sampling period of 3,750 times longer than MMT stations ( and 62.5 Hz, respectively), statistics favor to orient MMT along with others MMT stations because, instead of short time series of a few thousands of points, we will deal with time series of tens of millions of points for solely MMT stations involved; moreover, consistency with VSS can be independently confirmed. We expect some relative orientation errors in this piecemeal operation, but this can be reduced by performing this analysis for different arrays of stations, in order to minimize influences of external sources without plane-wave behavior and/or highly noisy stations, eligible to contaminate an entire array.
To implement the techniques described on Section 2, MMT data with 62.5-Hz sampling frequency were used (Fontes et al. 2009) and decimated to 0.0166-Hz sampling frequency (equivalent to 1-minute sampling period) to match VSS data exactly. It is worth knowing that, although both methods yielded very similar results, two different ways of decimating the time series were used: the first one uses a finite-impulse-response filter (commonly referred to as ‘fir’ filter) to obtain estimates of 1-minute sampling period directly, whereas the second uses the fir filter to obtain 1-Hz estimates and then resampled to 1 minute, in an attempt to simulate the flow of VSS data. Originally, VSS data were sampled at 1 Hz, although only the mean of each minute was stored for further analysis, the original records being discarded. As input, the multi-station processing program requires the definition of an array of stations, which is a set of 1 or, ideally, more stations, which will be processed altogether; therefore, they must have concomitant acquisition. Through trial-and-error approach, several arrays varying from 2 to 17 stations, including VSS, were tested in order to define those arrays that had the smallest standard deviation associated of calculated angles with respect to VSS. Windows of 64 and 128 data points were used with two levels of decimation, resulting in 12 to 14 frequencies evaluated, ranging from 200 s to 7,000 s. The choice for small windows lengths lies in the fact that three days of acquisition with the new sampling period of 1 minute led to time series with about 4,500 points for each channel, which can be considered statistically poor since an average of 35 non-overlapping windows is the maximum that will be obtained for window length of 128 points.
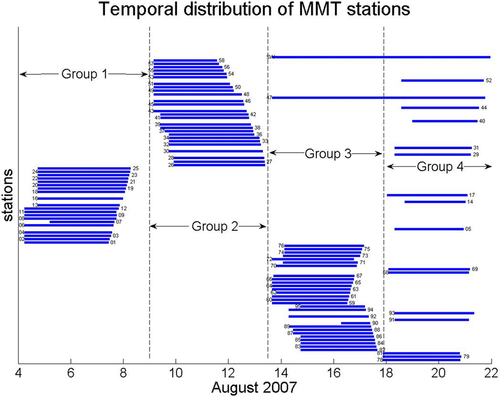
Ninety one MMT stations are available in the study, i.e., 90 distributed in three profiles and 1 as remote, ranging from 1.5 days to 3 days of acquisition, with temporal distribution shown in Fig. 12. The survey is divided, mainly, in four groups of stations, dropped and retrieved altogether. The group recognition is important during the choice of the stations that will be part of the array to be processed since a program requires concomitance. In general, group 1 belongs to the uppermost—and shallower—part of central profile. The remaining stations of same profile belong to group 2, group 3 encompasses lateral profiles, and group 4 is composed of the few remaining stations plus those that presented problems in the first drop or something alike.
Mütschard et al. (2014) showed that larger errors are associated with increasing water depths for alignment and demonstrated that, for a small seabed tilt angles (ranging from 4° to 20°) and water depths from 100 m to 300 m, the relative error decrease exponentially with increasing period. However, we experiment the opposite as the shallower group 1 presents slightly smaller standard deviations compared to deeper group 2. This might be due to the grouping of a land station together with marine stations, as deeper receptors might present a more distorted/attenuated magnetic field due to water depth, and the combination of stations with a high different level of distortion/attenuation is likely to add virtual sources of errors in data.
For the sake of briefness, results regarding only group 1 are shown since the methodology to evaluate of true orientation is the same for all groups. Initially, a fairly large array, up to 15 stations, is randomly defined. Then, the orientation angles (and its respective standard deviations) are evaluated for every VSS–MMT pair for two distinct situations: first, for all periods, and second, for periods under the condition that the second largest eigenvalue of SDM be at least a user-defined value larger than the third—which we set to ten after a few tests. This cutoff tries to minimize the influence of data biased by the presence of sources different than the plane wave on the orientation results. In the case of a lack of meaningful results for both situations, another try is taken by setting up a new array, until some stations show reasonably consistent orientation angles, with at least one station with standard deviation less than 5°. New arrays are defined based on these previous results, in an attempt of selecting the cleaners and coherent-noise-free stations to refine results further until there is no more improvement to be achieved.
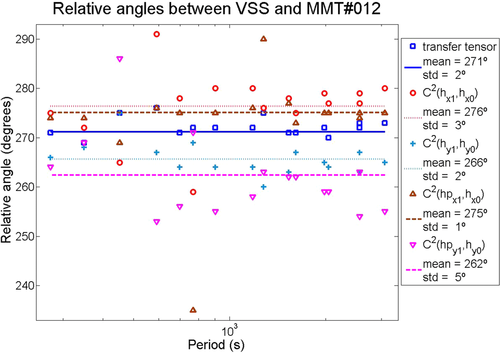
The final array grouped eight MMT stations, whose relative angles result with respect to VSS, which points to geographic north, and are shown in Tables 2 and 3. Table 2 comprises statistics of all periods evaluated and regular mean for time-domain results, whereas in Table 3, there are six periods excluded due to the cutoff based on the eigenvalues of SDM, shown in Fig. 13, and Table 3 also shows the weighted mean of the time-domain results. Five different values of relative angles are shown in the column angle (in degrees) to each station, which stands for the average of angles for all periods considered, and column std shows the respective standard deviation. The set of results is, in columns from left to right, evaluated via a transfer tensor, squared coherence between x channels and y channels, and predicted squared coherence for both directions. A plot of VSS versus MMT#12 consisting of all methods to all relative angles of all periods is shown in Fig. 14.
| Frequency Domain | ||||||||||||
|---|---|---|---|---|---|---|---|---|---|---|---|---|
| transfer tensor |
 |
 |
 |
 |
Time Domain (mean) diff + r | |||||||
| VSS with | angle | std | angle | std | angle | std | angle | std | angle | std | angle | std |
| MMT#01 | 261 | 43 | 269 | 43 | 246 | 50 | 276 | 35 | 261 | 48 | 138 | 39 |
| MMT#02 | 249 | 13 | 245 | 19 | 243 | 21 | 284 | 30 | 282 | 16 | 246 | 9 |
| MMT#03 | 54 | 9 | 54 | 39 | 56 | 35 | 122 | 12 | 160 | 79 | 265 | 27 |
| MMT#06 | 352 | 4 | 349 | 7 | 343 | 8 | 355 | 9 | 18 | 8 | 336 | 7 |
| MMT#08 | 161 | 12 | 162 | 24 | 155 | 10 | 184 | 14 | 202 | 6 | 215 | 12 |
| MMT#09 | 282 | 3 | 287 | 6 | 273 | 5 | 269 | 4 | 249 | 12 | 278 | 4 |
| MMT#11 | 173 | 7 | 175 | 9 | 163 | 4 | 178 | 5 | 197 | 10 | 205 | 16 |
| MMT#12 | 272 | 2 | 276 | 6 | 266 | 3 | 274 | 9 | 263 | 7 | 274 | 5 |
| Frequency Domain | ||||||||||||
|---|---|---|---|---|---|---|---|---|---|---|---|---|
| transfer tensor |
 |
 |
 |
 |
Time Domain (weighted mean) diff + r | |||||||
| VSS with | angle | std | angle | std | angle | std | angle | std | angle | std | angle | std |
| MMT#01 | 269 | 15 | 279 | 17 | 255 | 24 | 284 | 6 | 274 | 21 | 90 | 33 |
| MMT#02 | 252 | 6 | 253 | 15 | 244 | 10 | 291 | 6 | 287 | 9 | 236 | 7 |
| MMT#03 | 56 | 6 | 48 | 11 | 48 | 6 | 120 | 8 | 127 | 4 | 232 | 11 |
| MMT#06 | 351 | 3 | 351 | 2 | 343 | 4 | 356 | 8 | 17 | 4 | 317 | 45 |
| MMT#08 | 163 | 5 | 164 | 13 | 156 | 4 | 184 | 9 | 202 | 6 | 192 | 8 |
| MMT#09 | 282 | 3 | 288 | 5 | 274 | 2 | 268 | 2 | 249 | 10 | 270 | 12 |
| MMT#11 | 173 | 3 | 179 | 5 | 164 | 2 | 179 | 5 | 195 | 4 | 184 | 20 |
| MMT#12 | 271 | 2 | 276 | 3 | 266 | 2 | 275 | 1 | 262 | 5 | 271 | 10 |
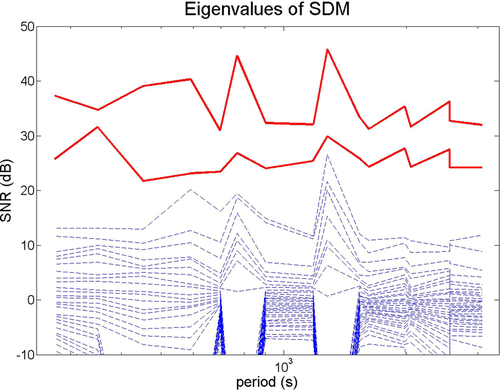
 , which show the dimension of the source for each period.
 cutoff are, approximately, 350 s, 550 s, 3,234 s, 4,096 s, 5,120 s and 6,144 s, neither plotted on the graph due to exclusion,
In Fig. 14, considering all relative angles evaluated, although all exhibit standard deviations equal or less than 5°, results spread over 14°, between 262° and 276°. Moreover, orientation angles for the x- and y-directions differ for both measured and predicted squared coherences, although consistent within each direction, whereas transfer tensor average result lies around their mean. These patterns, although not shown for other stations, were noticed in the setup of the other arrays, as well as a higher standard deviation related to the predicted squared coherence methodology. Finally, Tables 2 and 3 also show that the transfer tensor method has the overall least standard deviation among all stations. For these and next tables, shaded cells mean reasonable agreement (within 20°) between magnetic transfer tensor method and time-domain analysis. Notice that stations MMT#01 and MMT#03 in Table 3 have difference close to 180° for magnetic transfer function and time-domain analysis, a correlation that does not appear in Table 2. Curiously, the regular mean applied on time-domain results (Table 2) showed more consistency with magnetic transfer tensor method for station MMT#06 than weighted mean results (Table 3).
An array of the eight MMT stations without VSS was set up for consistency checking, taking advantage of the whole and original time series. The obtained “inner angles,” since no absolute orientation can be evaluated, are compared with those obtained with VSS in the array, in order to give us more reliable arguments to evaluate true orientation. The results are shown, with MMT#12 as reference, in Table 4 (without VSS) and Table 5 (with VSS in the array). The tables also show the respective time-series-based results, i.e., non-decimated for Table 4 and decimated for Table 5. For the latter, results based on the time-domain analysis are in accordance with transfer tensor ones for 5 out of 7 stations: exceptions are MMT#01 and MMT#03. Notice that MMT#03 has exact difference of 180° for results based on the magnetic transfer function and on the time-domain analysis, which in turn exhibits just 16° of weighted standard deviation, Moreover, MMT#01 has a difference of 200° ( ), and all five other stations exhibit good agreement for both methods. Table 4 shows this agreement just with station MMT#11 (MMT#12's neighbor), and no further 180° relationship can be detected.
| Frequency Domain | ||||||||||||
|---|---|---|---|---|---|---|---|---|---|---|---|---|
| transfer tensor |
 |
 |
 |
 |
Time Domain (weighted mean) diff + r | |||||||
| MMT#12 with | angle | std | angle | std | angle | std | angle | std | angle | std | angle | std |
| MMT#01 | 354 | 8 | 341 | 12 | 6 | 21 | 8 | 18 | 359 | 13 | 222 | 6 |
| MMT#02 | 340 | 6 | 327 | 6 | 349 | 3 | 21 | 15 | 19 | 5 | 301 | 11 |
| MMT#03 | 147 | 18 | 132 | 15 | 157 | 13 | 221 | 9 | 209 | 22 | 299 | 12 |
| MMT#06 | 79 | 5 | 75 | 6 | 89 | 21 | 99 | 6 | 103 | 10 | 148 | 25 |
| MMT#08 | 254 | 3 | 256 | 11 | 255 | 3 | 283 | 5 | 290 | 6 | 222 | 36 |
| MMT#09 | 11 | 2 | 353 | 21 | 21 | 16 | 349 | 5 | 352 | 4 | 344 | 32 |
| MMT#11 | 262 | 2 | 251 | 7 | 268 | 6 | 277 | 3 | 282 | 4 | 273 | 26 |
| Frequency Domain | ||||||||||||
|---|---|---|---|---|---|---|---|---|---|---|---|---|
| transfer tensor |
 |
 |
 |
 |
Time Domain (weighted mean) diff + r | |||||||
| MMT#12 with | angle | std | angle | std | angle | std | angle | std | angle | std | angle | std |
| MMT#01 | 352 | 6 | 350 | 21 | 6 | 17 | 12 | 6 | -2 | 12 | 192 | 14 |
| MMT#02 | 340 | 4 | 342 | 8 | 339 | 14 | 23 | 5 | 21 | 14 | 340 | 7 |
| MMT#03 | 143 | 4 | 143 | 4 | 134 | 9 | 215 | 7 | 216 | 7 | 323 | 16 |
| MMT#06 | 79 | 2 | 81 | 3 | 77 | 2 | 96 | 6 | 108 | 6 | 81 | 25 |
| MMT#08 | 251 | 3 | 251 | 3 | 250 | 11 | 284 | 10 | 294 | 6 | 238 | 11 |
| MMT#09 | 10 | 2 | 10 | 1 | 12 | 2 | 352 | 5 | 350 | 4 | 15 | 10 |
| MMT#11 | 260 | 1 | 259 | 1 | 264 | 2 | 278 | 4 | 285 | 4 | 250 | 17 |
From the previous tables, one can notice that, for most pairs (be it VSS–MMT or even MMT–MMT), regarding all orientations evaluated, there is a general reasonably good agreement between results from magnetic transfer function and measured squared coherences, which is not observed for predicted squared coherence. Examples are VSS with MMT#02, MMT#03, MMT#08, and MMT#09 from Tables 2 and 3, and the same stations with MMT#12 from Tables 4 and 5, which might be an evidence of highly noise stations. Therefore, the good agreement previously highlighted is assumed enough to orientate MMT stations since orientation angles obtained are close to each other. Moreover, the consistency of results is preserved with the input of VSS on the array, as showed through Tables 4 (without VSS) and 5 (with VSS), Most time-domain-based results agreed with magnetic transfer tensor results with VSS present in the array, for decimated time series. Without VSS on the array (original MMT time series), time-domain methods failed. This can indicate that, although such methods worked to some pair of stations, it should not be reckoned solely as a tool for orientate time series but as an auxiliary tool that can improve frequency-domain results or even warn the user of problems in any stations. All the proposed methodologies should be carried out when trying to orientate MMT stations because, although some of them are likely to fail or be biased, such results can support each other, or give insightful hints of data characteristics or behavior. The decision of what technique(s) will lead the orientation process and what will act as a support should be done particularly for each problem, investigating every detail on the results. In this MMT example, prevailed the transfer tensor together with measured squared coherences.
5 CONCLUSIONS
In order to find out the true orientation of these seabed marine magnetotelluric sensors, five distinct methodologies were tested: three in the frequency domain and two others in the time domain. All techniques worked fine for the two onshore tests, with all methods yielding similar and true results. The same cannot be stated for the offshore controlled test once it was an extreme situation and cannot be regarded as a reliable test. Although rather inconclusive, this test also suggests that the magnetic transfer tensor method is likely to prevail over the others under such situations. A dimensionality analysis of the data showed that it is possible to recover the true orientation of the data, even when the stations sites are subject to lateral variation of the electrical resistivity, i.e., 2D or higher dimensions (or even a specific cases, as a 3D body embedded on a 1D regional distribution), as indicated in Fig. 11.
Although it will never be possible assert the true orientation of Santos basin MMT data (since there was no kind of compass in it, or any other way to register the orientation), the investigated methods are likely to provide a reliable estimate of it once they were tested (and performed well) under different conditions and over different electrical resistivity distributions. However, special care must be taken when applying such techniques because, as we have seen, they might not agree with each other in all cases, although two or three methodologies yielding close results can increase the chance of that to be the nearest to true orientation. A deep look on the results can provide information regarding the consistency of the methods and stability of the orientations evaluated throughout all the arrays (the group of stations to be processed) that were set up. Consistency and stability mean that two stations A and B are supposed to have the same orientation angle independently of the other stations contained in the array or the methodology applied. If this does not hold true for any array and/or approach used, it can be an evidence of a problematic station in the array and thus should be identified in order to prevent it from deteriorate the orientation of other stations, as well as to have its noise removed somehow. Egbert (1997) is very concerned about this question, and it is referred to for further analysis on how this should be done, particularly when coherent noise is present.
Both frequency- and time-domain methods are not fail-proof; therefore, the fact that predicted squared coherence or time-series analysis, in our MMT example, did not evaluated the same results as magnetic transfer function or measured squared coherence should not be regarded as a final proof that they should be discarded (or even that they are incorrect). Rather, enhancements should be made in order to achieve the concordance among all methods.
A future perspective of this work can be towards the orientation with independent channels—instead of crossed ones—in order to qualify the effect of the use of vector products. Moreover, a search mechanism inspired on Mütschard et al. (2014) could be developed in order to estimate the tilt of these stations since  is available at VSS and transfer tensors involving horizontal and vertical magnetic fields are widely known and explored as tools for retrieving information from the subsurface. Concerning time-domain schemes, enhancement might be gained by using improved techniques rather than difference or widely employed Pearson's correlation coefficient, such as the techniques applied in image analysis.
ACKNOWLEDGEMENTS
The authors would like to thank Petrobras for sponsoring the project; EMGS for providing CSEM/MMT data used in validation of the methodology; the Brazilian National Agency for Petroleum, Gas and Biofuels (ANP) for providing some of the land test data; geophysicists Gary Egbert for making available the multi-station processing codes, Kerry Key for his useful personal comments, Marcelo Banik for his real-time code support, and Max Meju for technical comments and language editing; and the anonymous reviewers who helped improve the paper. L. Miqueleutti would like to thank CAPES for the PhD scholarship and Petrobras and ANP for the research funding. S. L. Fontes would like to thank CNPq for his research grant.


 define the relationship between components h0 and h1 as (Key

