The New Normal? U.S. Food Expenditure Patterns and the Changing Structure of Food Retailing
Timothy Beatty is an Associate Professor and Benjamin Senauer ([email protected]) is a Professor in the Department of Applied Economics at the University of Minnesota. They wish to thank Travis Smith and Charlotte Tuttle for their excellent research assistance and Mark East of NPD Group for helpful discussions. Any remaining errors are the responsibility of the authors.
This article was presented in an invited paper session at the 2012 ASSA annual meeting in Chicago, IL. The articles in these sessions are not subjected to the journal's standard refereeing process.
The “New Normal” is a term credited to Mohamed El-Erain of Pimco, the giant bond investing firm. The basic concept is that the housing bubble, the financial crisis of 2008–2009, and the subsequent recession of 2007–2009, deemed the “Great Recession”, ushered in fundamental economic realignments that will last for years (Shell 2010). The recovery from the bursting of an asset bubble and financial crisis is usually prolonged and erratic (Reinhart and Rogoff 2009). As this paper is being written for an October 2011 deadline, the United States is experiencing an anemic economic recovery, still high unemployment driven by unprecedented unemployment duration, and heightened economic uncertainty (Roubini Global Economics 2011). Inflation-adjusted median household income has declined more since the official end of the recession, 6.7 percent between June 2009 (the end) and June 2011, than during the recession, when it declined by 3.2 percent between December 2007 (the start) and June 2009 (Pear 2011).
This paper presents a series of stylized facts about changes in consumer behavior and the effects on the food industry during and following the recession. The aim is to serve as a jumping off point for debate and future research into the impacts of the “Great Recession” and the subsequent “New Normal”. We rely heavily on industry sources in order to present the timeliest information. While somewhat less rigorous than conventional empirical work, these reports offer the advantage of immediacy and insight from within the food industry. Future careful empirical work will be needed to ascertain the validity of these insights, but for now we see through a glass, darkly.
This paper has two major sections. The first uses the most current government data available to examine trends in consumer food expenditures across various categories before, during, and after the recession. Consumer time use data related to food preparation and shopping are also analyzed. The second major section uses industry reports to look at impacts on food shopper behavior, retail formats, private-label sales, and commercial food service.
Food Expenditures and Time Use Patterns
This section examines the changing pattern of various food expenditures using data from the Bureau of Labor Statistics Consumer Expenditure Survey and data on household time use related to food from the American Time Use Survey (see the Data Appendix for details). Note that results below are best viewed as general trends as the statistical significance of the various changes reported were not tested.
Expenditure Patterns
Panels (a) and (b) of figure 1 illustrate the changes in average weekly total expenditure and average weekly food expenditure, by quarter and by income quartile, for the period 2001Q1 to 2010Q4. All values are in 2000Q1 dollars. Total expenditure has been deflated by the overall CPI and food expenditure has been deflated by the food CPI. In what follows, we compare 2006Q4, when unemployment reached a low of 4.5 percent, to 2009Q4, when unemployment stood at it's peak at 9.9 percent. We see that total expenditure is 8.7 percent higher in the lowest income quartile, 2.7 percent lower in the second quartile, 7.5 percent lower in the third quartile and 9.9 percent lower for the highest income quartile. Why total expenditure rose for the lowest quartile is a puzzle and worthy of additional investigation. Food expenditure declined across all quartiles, from a 4.6 percent decline in the first quartile, to a 7.8 percent decline in the fourth quartile.
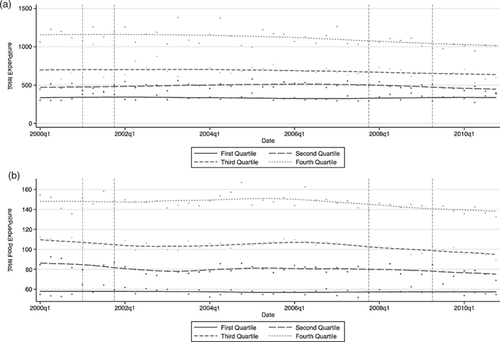
Total expenditure and total food expenditure by income quartile, 2000–2010.
Panels (a) and (b) of figure 2 plot the share of total food expenditure devoted to food at home and food away from home for each income quartile over the same period. Households across all quartiles have shifted food spending into food at home and out of food away from home. From 2006Q4 to 2009Q4, the lowest quartile has increased their share of total food spending on food at home by 5.0 percent, the second quartile has increased the proportion of food spending on food at home by 3.4 percent, the third quartile increased spending by 3.6 percent, and the fourth quartile increased spending 3.2 percent.
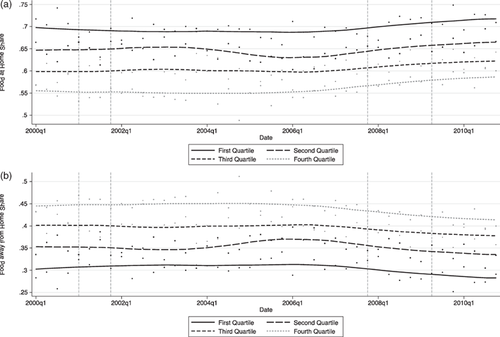
Food at home and food away from home, by income quartile, 2000–2010.
Figure 3 illustrates the changes in spending across restaurant types as captured in the Consumer Expenditure Survey, over the period 2000Q1 to 2010Q4. Here we plot the share of food away from home expenditure spent in “fast food” and “full service” restaurants respectively for each quartile of the income distribution. We see a clear shift from full-service restaurants towards fast-food restaurants, particularly for households in the lowest quartile of the income distribution. As before, comparing 2006Q4 to 2009Q4, we see households at the lowest quartile increased their share of food away from home spending in fast food restaurants by 15 percent relative to full service restaurants, the second quartile decreased the share by 4 percent and the third and fourth quartiles increased the share of food away from home spending in fast food restaurants by 5 percent and 3 percent respectively. Note that the absolute effect on full service restaurants would have been larger as consumers were spending less on food away from home in total.
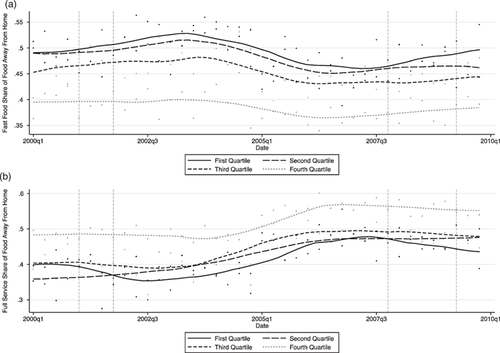
Share of food away from home by restaurant type, by income quartile, 2000–2010.
Time Use Patterns
The changes in expenditure are also manifest in the time use data. Panels (a) and (b) of figure 4 show the number of minutes per week a representative individual spends in food preparation and food shopping related activities. Comparing 2010 to 2007 we see that households in the bottom quartile are spending an average of 30 minutes per week more in food preparation and 7.11 minutes per week more shopping for food. The effect is less pronounced for other quartiles, the second, third and fourth quartiles are spending 8, 19 and 11 minutes more per week preparing food and have increased shopping time by 1, 4, and 3 minutes per week respectively. These results are consistent with households saving money by spending more time in home production and engaging in more search activities to lower prices (Aguiar and Hurst 2005).
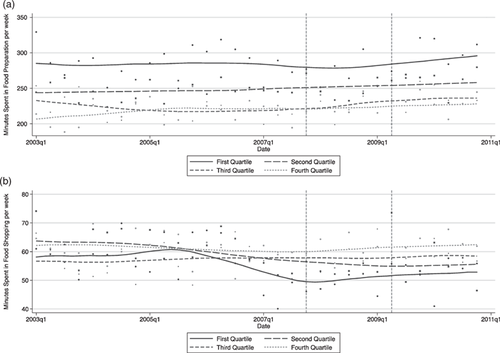
Time in food preparation and food shopping, by income quartile, 2000–2010.
Changing Structure of Food Retailing
Having explored some of the limited data available from government sources, we now ask how has industry reported their experiences during the “Great Recession” through to the “New Normal?”. Industry reports broadly agree that the “New Normal” has brought fundamental structural changes to food retailing. The major impacts have been on grocery shopper behavior, grocery store formats, especially the continuing growth of supercenters and limited-assortment stores, the increase of private-label sales, and the decline in demand confronting many commercial food service operators.
Shopper Frugality and Grocery Retailing
According to the Food Marketing Institute (FMI) with the strong economy of the mid-1990s, 55 percent of supermarket shoppers could be classified as convenience-oriented, primarily looking for ways to save time, and 45 percent as price-conscious or economizers (Kinsey and Senauer 1996). In its early 2011 survey of grocery shoppers, FMI found the majority were trying to economize on their food costs and 74 percent indicated that “low prices” were very important in selecting the primary grocery store that they shopped at, a marked change from more prosperous times (FMI 2011b). Many food shoppers “continue to be focused on making ends meet through a relentless focus on price and value” (FMI 2011b, p. 1). Consumers, especially those with lower incomes, have become very cautious and budget conscious in their expenditures, including their food spending (NPD 2011a).
Shoppers were saving on groceries by shopping at less expensive stores, purchasing lower priced foods, more pasta and less beef for example, stocking up during sales, buying more private-label products, and using coupons more frequently (Food Institute 2010). Overall coupon redemptions climbed 27 percent in 2009 alone and internet coupon redemptions rose 263 percent (Nielsenwire 2010). Households that began to more carefully watch their food spending during the recession have in many cases maintained their thriftier ways. Consumers are “skeptical that things will go back to the way they were” and feel “the road to recovery will be a long one” (Food Institute 2010 p. 6).
The Impact on Store Formats
Supercenters, warehouse stores, and limited-assortment stores have benefited from consumers’ value-orientation. Lower prices are a major motivation for doing one's grocery shopping at one of these formats (FMI 2011b). Walmart and Target supercenters, and Costco and Sam's Club warehouse club stores, sell both general merchandise and a full-line of grocery products. Walmart has become the largest U.S. food retailer (Food Institute 2010). Limited assortment stores, such as Aldi with over 1,400 U.S. stores, typically offer less than 2,000 items, but at deeply discounted prices based on a bare-bones operation. Aldi's labor costs were only four percent of store sales compared to an average of over 13 percent for other food retailers in 2010 (FMI 2011a and Grocery.com 2011).
Supercenters with the ultimate goal of increasing total store sales and profitability can price their food products lower than traditional supermarkets. Offering groceries at lower prices increases customer traffic and many of those shoppers also purchase general merchandise on which profit margins are higher. Since households shopped for food an average of 1.7 times per week in 2011, groceries are especially useful for increasing store visits (FMI 2011b). Supercenters also carry fewer distinct product items, referred to as stock keeping units (SKU's), in their grocery sections, which reduces costs. The growing grocery sales of supercenters, limited-assortment stores, and other alternative formats, combined with very price-sensitive consumers, have pressured traditional supermarkets and brought a wave of consolidation. Many smaller, frequently family-owned, operations with only one to several stores have lost sales and been taken over by larger chains or been forced to close (Senauer and Seltzer 2010).
Private-Label Product Growth
The sales of private-label, also referred to as store-brand, grocery products have been steadily growing, representing a good example of the “New Normal” in that private label loyalties appear here to stay. Private-label products on average sell for about one-third less than the equivalent national brands, such as General Mills and Kraft (PLMA 2010). Many shoppers now consider private label as the best value – quality at a lower price. Private-label sales in supermarkets grew by 34 percent to $55.5 billion dollars between 2006 and 2010. A survey of 8,500 shoppers in 2011 found that 54 percent buy “a lot” of private label and for 41 percent store brands account for about half of all purchases (Advertising Age 2011). From 2006, private label sales grew from 16.5 percent of grocery sales in dollars and 21.3 percent in unit sales to 19.1 percent in dollars and 23.5 percent in units in 2010 (Food Institute 2010 and 2011).
Major supermarkets and supercenters still carry the top national brands in a category, such as General Mills and Kellogg in breakfast cereals, but those brands with lower market shares may no longer be stocked. Many stores have reduced the number of package sizes and facings even for the top national brands to make room for more private-label products. Stores are shelving their store-brand products next to the comparable national brands in many cases, so the cost savings can easily be seen by customers. Deep-discount, limited assortment stores rely heavily on private-label products; for example, they account for some 95 percent of the items at a typical Aldi store (Senauer and Seltzer 2010).
Store brands typically provide a higher profit margin (the difference between the retail price of the good and its cost) to retailers than national brands. Retailers generally do not actually manufacture their store-brand products, but contract with a food processor for manufacturing. In some cases the national brand companies produce private-label products in their plants, because of the enhanced return on their plant investment and economies of scale achieved (Senauer and Seltzer 2010).
Impacts on Food Service
Since a large share of their business is based on discretionary spending by consumers, commercial food service was hard hit by the recession and overall sales have still not recovered, as illustrated in figures 2, 3 and 4. Hard-pressed consumers simply eat less away from home, and more at home, and when they do eat out frequently choose a less expensive format than previously. In FMI's (2011b) annual consumer survey, 69 percent reported eating out less frequently to save money in 2009 and 68 percent in 2010. NPD (2011a) found that restaurant visits decreased by 2.4 billion, from 61.5 billion to 59.1 billion between November 2008 and November 2010. In an early 2011 survey of consumers, 54 percent indicated they were still eating out less frequently; 45 percent were using coupons or other discounts; 42 percent were eating in less expensive places; 35 percent were skipping appetizers or desserts, and 34 percent were ordering water instead of some other beverage (FMI 2011b). Restaurants have tried to win back cash-conscious consumers with discounts, value meals, special promotions, and using social media, such as Facebook, to attract customers.
After three years of negative real sales growth, the restaurant industry (commercial food service) started to see an increase in traffic in the second half of 2010 (NRA 2011). However, as the economy stalled in Spring 2011 restaurant visits began to slip again (NPD 2011a). A number of major fast-food chains, the largest food service sector, lost business during the recession, which they have still not fully recovered (Food Institute 2010). McDonald's and Subway were exceptions with their strong value-perception, continuing menu innovations, and ubiquitous locations.
The impact of the recession and the new normal has varied substantially among different segments of the industry and specific businesses. A large number of independent restaurants, particularly in the midscale and even upscale range in which business failures have always been high, suffered such a loss of customers that they were forced to shut down. Over 9,000 restaurants went out of business between April 2010 and April 2011. The vast majority, over 8,000, were independently owned and not part of a chain (NPD 2011c). Among corporately-owned restaurants, casual-dining chains were hit hard as consumers continued to dine out less frequently and also traded down to quick service (fast food) meals to save money.
Casual-dining chains, such as Chili's and Applebee's, have lost favor among young people in their twenties and early thirties, a crucial demographic since they dine out more often than other age groups. They feel there are “faster options with better food” (Patton 2011). Thanks primarily to this age group, fast-casual chains such as Chipotle, Five Guys, and Panera, have been the best performing part of the industry with a 6 percent increase in sales in 2010.
Conclusion
Only time will tell whether the “New Normal” represents a permanent change or merely a transitory phase back to an “Old Normal”. In this paper we have summarized some of the broad trends based on available government data sources that clearly show a change in consumer behavior from the pre-recession years. In sum, households are spending a greater share of time and money resources on home food preparation. We have also presented information from food industry reports and other sources. These reports provide considerable insight into how industry has responded to the changes in consumer behavior. For scholars interested in food consumption behavior and the food industry, this paper is intended to serve as a jumping off point for future academic research into these areas.
Data Appendix
Expenditure information is drawn from the Consumer Expenditure Survey (CE) over the period 2000–2010. The CE is a nationally representative survey of household spending. The CE consists of a quarterly interview survey and a diary survey. All figures and statistics used are from the diary survey, which contains more detail with regard to food expenditure. Information is reported here on a per household per week basis. For further information of the CE Survey see http://www.bls.gov/cex/. Time use information is from the American Time Use Survey (ATUS) for the years 2003–2010. The ATUS is a nationally representative time diary survey drawn from households that have completed their final interview in the Current Population Survey. The ATUS collects information on all activities for a single individual on a given day. For comparability purposes, we have scaled time use to the weekly level. For further information on the ATUS see http://www.bls.gov/tus/. Finally, vertical bars bracket official recessions as defined by the National Bureau of Economic Research. The recession of 2001Q1 to 2001Q3 and the more recent “Great Recession” of 2007Q4 to 2009Q2 are indicated.


