2-Oxoacids Regulate Kynurenic Acid Production in the Rat Brain
Studies In Vitro and In Vivo
Abbreviations used : AOAA, (aminooxy)acetic acid ; DCVC, dichlorovinylcysteine ; KAT, kynurenine aminotransferase ; KRB, Krebs-Ringer buffer ; KYNA, kynurenate ; LKYN, L-kynurenine ; MTT, 3-(4,5-dimethylthiazol-2-yl)-2,5-diphenyltetrazolium bromide.
Abstract
Abstract : This study was designed to examine the role of 2-oxoacids in the enzymatic transamination of L-kynurenine to the excitatory amino acid receptor antagonist, kynurenate, in the rat brain. In brain tissue slices incubated in Krebs-Ringer buffer with a physiological concentration of L-kynurenine, pyruvate, and several other straight- and branched-chain 2-oxoacids, substantially restored basal kynurenate production in a dose-dependent manner without increasing the intracellular concentration of L-kynurenine. All 2-oxoacids tested also reversed or attenuated the hypoglycemia-induced decrease in kynurenate synthesis, but only pyruvate and oxaloacetate also substantially restored intracellular L-kynurenine accumulation. Thus, 2-oxoacids increase kynurenate formation in the brain primarily by functioning as co-substrates of the transamination reaction. This was supported further by the fact that the nonspecific kynurenine aminotransferase inhibitors (aminooxy)acetic acid and dichlorovinylcysteine prevented the effect of pyruvate on kynurenate production in a dose-dependent manner. Moreover, all 2-oxoacids tested attenuated or prevented the effects of veratridine, quisqualate, or L-α-aminoadipate, which reduce the transamination of L-kynurenine to kynurenate. Finally, dose-dependent increases in extracellular kynurenate levels in response to an intracerebral perfusion with pyruvate or α-ketoisocaproate were demonstrated by in vivo microdialysis. Taken together, these data show that 2-oxoacids can directly augment the de novo production of kynurenate in several areas of the rat brain. 2-Oxoacids may therefore provide a novel pharmacological approach for the manipulation of excitatory amino acid receptor function and dysfunction.
The existence of a functional kynurenine pathway originating from l-kynurenine (LKYN) and resulting in the production of the neuroactive compounds kynurenate (KYNA), 3-hydroxykynurenine, and quinolinate has been described recently in the normal rat brain (Guidetti et al., 1995). KYNA is a neuroinhibitory compound that acts preferentially at the glycine co-agonist site of the NMDA receptor (EC50 = 8 μM ; Parsons et al., 1997). At higher concentrations, KYNA is a competitive broad spectrum antagonist of all ionotropic excitatory amino acid receptors (Stone, 1993). KYNA has anticonvulsant and neuroprotective properties (Foster et al., 1984 ; Gill and Woodruff, 1990), whereas quinolinate, possibly acting in conjunction with 3-hydroxykynurenine (Okuda et al., 1996, 1998 ; Guidetti and Schwarcz, 1997), is a convulsive and excitotoxic metabolite (Schwarcz et al., 1984). Notably, the production of 3-hydroxykynurenine and quinolinate, but not of KYNA, is elevated substantially in the immunocompromised brain (Heyes, 1993 ; Saito et al., 1993). A dysfunction of cerebral LKYN metabolism may therefore play a critical role in a large number of brain diseases.
LKYN readily enters the brain from the periphery (Fukui et al., 1991) and then rapidly accumulates in astrocytes via the sodium-independent transporter for large neutral amino acids (Speciale et al., 1989). In contrast, neuronal LKYN is internalized by a less efficient sodium-dependent mechanism (Speciale and Schwarcz, 1990). Kynurenine aminotransferase (KAT) I (glutamine transaminase K ; EC 2.6.1.64 ; Mosca et al., 1994) and II (l-α-aminoadipate aminotransferase ; EC 2.6.1.39 ; Buchli et al., 1995), which are preferentially localized in glial cells (Ceresoli-Borroni et al., 1999), are responsible for the subsequent irreversible transamination of LKYN to KYNA. KAT I and II are dependent upon pyridoxal-5′-phosphate as a co-factor and can use a variety of 2-oxoacids as co-substrates (Okuno et al., 1991 ; Guidetti et al., 1997). De novo produced KYNA is rapidly liberated into the extracellular space and removed from the brain by a probenecid-sensitive mechanism (Moroni et al., 1988).
KYNA production in vivo (Wu et al., 1992) and in vitro (Turski et al., 1989 ; Gramsbergen et al., 1997) is modulated by several distinct mechanisms. Some of these regulatory processes are brain-specific, involve neuron-glia interactions, and result in a reduction of KYNA synthesis. However, brain KYNA formation can also be experimentally augmented, for example, by increasing the exogenous concentration of LKYN (Turski et al., 1989), and is increased following acute seizures (Wu and Schwarcz, 1996) and as a consequence of neuronal loss (Wu et al., 1992 ; Hodgkins and Schwarcz, 1998a).
We recently suggested that the availability of 2-oxoacids may constitute another mechanism to regulate cerebral KYNA synthesis (Hodgkins and Schwarcz, 1998b). The present study was designed to characterize in detail the role of straight- and branched-chain 2-oxoacids in the control of KYNA production in the adult rat brain. By using physiological and pharmacological concentrations of LKYN and various 2-oxoacids, KYNA formation was studied in tissue slices in vitro, and by in vivo microdialysis in unanesthetized, freely moving rats. Some of the results described in this communication have been published in abstract form (Hodgkins and Schwarcz, 1997).
MATERIALS AND METHODS
Materials
LKYN, KYNA, (aminooxy)acetic acid (AOAA), and all 2-oxoacids were purchased from Sigma Chemical Co. (St. Louis, MO, U.S.A.). Dichlorovinylcysteine (DCVC) was a generous gift from Dr. M. Varasi (Pharmacia & Upjohn, Nerviano, Italy). All other chemicals were of the highest available purity and were purchased from various commercial sources. Test compounds were dissolved in oxygenated Krebs-Ringer buffer (KRB ; in mM : NaCl, 118.5 ; KCl, 4.8 ; CaCl2, 1.8 ; MgSO4, 1.2 ; NaH2PO4, 16.2 ; glucose, 5 ; pH 7.4).
Animals
Male Sprague-Dawley rats (200-250 g ; Charles River Laboratories, Kingston, NY, U.S.A.) were used in all experiments. The animals were kept in a facility approved by the Animal Care and Use Committee of the University of Maryland (12-h light/12-h dark cycle) and had free access to food and water.
Tissue preparation
Animals were killed by decapitation, and the brain, liver, and kidney were rapidly removed and kept in a minimal volume of ice-cold KRB. Brain areas of interest were immediately dissected out. Tissue slices (base : 1 mm × 1 mm) were prepared using a McIlwain tissue chopper (Mickle Laboratory Engineering, Gomshall, U.K.) and were then placed in ice-cold KRB until the initiation of the experiment (<1 h).
Incubation of tissue slices
As KYNA and 3-(4,5-dimethylthiazol-2-yl)-2,5-diphenyltetrazolium bromide (MTT) cannot be measured in the same incubation medium (P. S. Hodgkins and R. Schwarcz, unpublished observation), parallel assays with tissue taken from the same animal were conducted separately. All assays were performed at least in triplicate. Tissue slices were placed in deepwell culture plates (six slices per well) containing ice-cold KRB (1 ml final volume). Test compounds (pH 7.0-7.8) were then added for a preincubation period of 10 min (37°C in an oxygenated shaking water bath) before the addition of LKYN (routinely 2 μM). After a 2-h incubation at 37°C, the plates were placed on ice. The medium was rapidly separated from the tissue and acidified (100 μ1 of 1 M HCL) for subsequent KYNA measurement (see below). Tissue slices were resuspended in distilled water and frozen at -20°C for protein determination (Lowry et al., 1951). In every experiment, parallel incubations were performed at 4°C (blank values). In experiments where MTT formazan formation or tissue levels of LKYN were measured, the tissue slices were treated differently (see below).
MTT formazan assay
MTT formazan was quantified as described previously (Hodgkins and Schwarcz, 1998a,b). In brief, 0.5 mg of MTT was added to each incubation well to initiate the reaction. After 1 h at 37°C, the wells were put on ice, and the reaction was terminated by the addition of 1 ml of acidified isopropanol (0.04 M HCl). Tissue slices were then homogenized, and MTT formazan was measured spectrophotometrically at a test wave-length of 570 nm and a reference wavelength of 630 nm (Mosmann, 1983 ; Beckman DU-30 spectrophotometer, Beckman Instruments Inc., Fullerton, CA, U.S.A)
In vivo microdialysis
Under chloral hydrate anesthesia (360 mg/kg i.p.), animals were mounted in a stereotaxic frame (David Kopf, Tujunga, CA, U.S.A.). A guide cannula (outer diameter : 0.65 mm) was positioned on top of the dorsal hippocampus (AP : 3.4 mm posterior to bregma ; L : 2.3 mm from the midline ; V : 1 mm below the dura) and secured to the skull with anchor screws and acrylic dental cement. On the day of the experiment (at least 20 h after surgery), a microdialysis probe (CMA/10, membrane length : 2 mm ; Carnegie Medicin, Stockholm, Sweden) was inserted through the guide cannula, extending vertically throughout the dorsal hippocampus. The probe was connected to a microinfusion pump (CMA/100, Carnegie Medicin) and perfused with Ringer solution (1 μ/min) containing the following (in mM) : NaCl, 144 ; KCl, 4.8 ; MgSO4, 1.2 ; CaCl2, 1.7 ; pH 6.7. Dialysate was collected every 30 min. Routinely, the first fraction was discarded, and basal levels of extracellular KYNA were obtained during a 2-h baseline period.
LKYN and KYNA measurement
Intracellular LKYN and extracellular KYNA concentrations were determined as described previously (Wu et al., 1992 ; Hodgkins and Schwarcz, 1998b), using HPLC with UV (365 nm) and fluorescence detection (excitation at 344 nm, emission at 398 nm), respectively. KYNA levels in dialysate were not corrected for recovery from the microdialysis probe (~20% ; Wu et al., 1992).
Data presentation and analysis
In vitro data are presented after the deduction of blank values (incubation at 4°C). All results were analyzed by either repeated measures or two-way ANOVA with Student-Newman-Keuls multiple comparisons test. Unless stated otherwise, statistical analyses were performed using NCSS 6.0 (NCSS, Kaysville, VT, U.S.A.) to identify significant differences between experimental groups. A probability of p < 0.05 was considered significant.
RESULTS
Pyruvate-induced increase in KYNA production
Incubation of cortical tissue slices in standard KRB with 2 μM LKYN resulted in a linear, time-dependent increase in KYNA in the incubation medium (r2 = 0.99, p < 0.05 ; cf. Turski et al., 1989). Addition of 5 mM pyruvate to the incubation medium augmented KYNA production by 160-200% at each of the six time points examined (Fig. 1 ; p < 0.05) and also resulted in a linear increase of KYNA with time in the presence or absence of pyruvate (r2 = 0.99, p < 0.05).
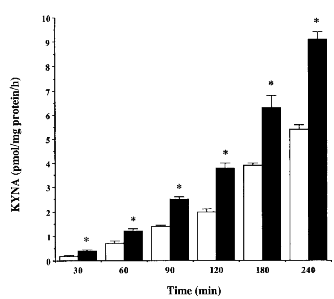
KYNA production in cortical tissue slices incubated for various times in standard KRB (open columns) or in the presence of 5 mM pyruvate (solid columns). Experiments were performed as described in the text, and KYNA was measured in the medium. Data (means ± SEM) are presented as pmol of KYNA/mg of protein/h (n = 3 per time point). *p < 0.05 vs. KRB (two-way ANOVA). Linear regression analysis of the data (Statsview SE + Graphics, Abacus Concepts, Berkeley, CA, U.S.A.) determined correlation coefficients of r2 = 0.99 (p < 0.05) and r2 = 0.99 (p < 0.05) for KRB and KRB + pyruvate, respectively.
The relationship between pyruvate, intracellular LKYN accumulation, and KYNA formation in cortical tissue slices was examined in both standard and glucose-free KRB. As described previously (Turski et al., 1989 ; Gramsbergen et al., 1997), glucose deprivation resulted in a dramatic attention of KYNA formation. Compared with the respective controls, pyruvate (20 μM to 50 mM) caused a dose-dependent increase in KYNA production in both media (EC50 = 4.1 and 3.1 mM in standard KRB and glucose-free medium, respectively) (Fig. 2A). At lower pyruvate concentrations (≤2 mM), significantly less KYNA was produced in tissue slices incubated in glucose-free medium (p < 0.05). However, with increasing pyruvate concentrations, KYNA production under standard and hypoglycemic conditions became quantitatively very similar, reaching maxima of 200-250% of normal control values.
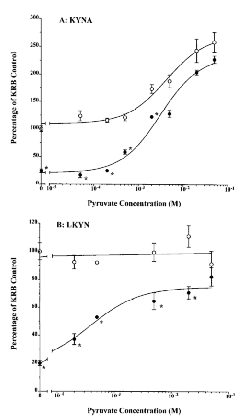
Effect of pyruvate (5 mM) on KYNA production (A) and intracellular LKYN accumulation (B) in standard KRB (○) and in glucose-free medium (•). Experiments were performed as described in the text, and KYNA and LKYN were measured in the medium and prewashed tissue, respectively. Data (means ± SEM ; n = 3) are expressed as a percentage of standard KRB (KYNA : 2.0 ± 0.2 pmol/mg of protein/h ; LKYN : 51.9 ± 2.9 pmol/mg of protein/h ; n = 9). Sigmoid curves were generated by nonlinear regression analysis. *p < 0.05 vs. standard KRB (two-way ANOVA).
Under normoglycemic conditions, the intracellular accumulation of LKYN in the same cortical slices was not influenced by exogenously applied pyruvate, remaining between 90 and 110% of basal levels (51.9 ± 2.9 pmol/mg of protein/h) at all test concentrations of the 2-oxoacid. In contrast, pyruvate dose-dependently reverted cellular uptake of LKYN toward control levels in glucose-free medium (EC50 = 2.3 mM ; Fig. 2B).
Table 1 illustrates the effects of glucose deprivation and pyruvate (5 mM) in hippocampal and striatal tissue slices. Basal levels of LKYN accumulation and KYNA production were greater in the hippocampus than in the striatum (p < 0.05). However, in both brain areas, hypoglycemia reduced intracellular LKYN content to ~20% of control values and also caused very substantial decreases in KYNA formation As in the cortex (see above), addition of pyruvate increased KYNA synthesis without elevating intracellular LKYN content in standard KRB, but attenuated and reversed the effect of glucose removal with respect to both LKYN uptake and KYNA production, respectively.
| KRB | Glucose-free KRB + pyruvate (5 mM) | Glucose-free + pyruvate (5 mM) | ||
|---|---|---|---|---|
| Hippocampus | ||||
| LKYN | 59.6 ± 3.0 | 10.1 ± 0.5 a | 56.2 ± 1.0 | 37.7 ± 1.4 a,b |
| KYNA | 3.8 ± 0.4 | 0.9 ± 0.2 a | 7.2 ± 0.6 a | 4.8 ± 0.4 b |
| Striatum | ||||
| LKYN | 38.2 ± 2.7 c | 9.8 ± 1.0 a | 39.5 ± 1.8 | 28.7 ± 4.0 a,b |
| KYNA | 1.6 ± 0.2 c | 0.7 ± 0.1 a | 3.4 ± 0.3 a | 2.9 ± 0.5 a,b |
- a p < 0.05 vs. KRB ;
- b p < 0.05 vs. glucose-free controls ;
- c P < 0.05 vs. hoppocampus (repeated measusres ANOVA, Student-Newman-Keuls multiple comparisons test).
Inhibition of KAT activity by aminotransferase inhibitors : partial reversal by pyruvate
The experiments described above suggested that the pyruvate-induced increase in KYNA production may be attributed to a direct enhancement of LKYN transamination. To test this hypothesis further, cortical tissue slices were incubated with the potent, nonspecific aminotransferase inhibitors DCVC or AOAA in the presence or absence of 5 mM pyruvate. Both compounds inhibited KYNA production in a dose-dependent manner (Table 2). At low concentrations of DCVC or AOAA (≤50 μM), pyruvate was able to attenuate the reduction in KYNA synthesis caused by the enzyme inhibitors. At concentrations of ≥500 μM, however, co-incubation with pyruvate had no effect.
| Inhibitor alone | Inhibitor + pyruvate (5 mM) | |
|---|---|---|
| DCVC | ||
| 50 μM | 48.6 ± 1.7a | 78.9 ± 3.6b |
| 500 μM | 28.9 ±5.7a | 33.4 ± 3.1a |
| 5 mM | 10.8 ± 2.3a | 7.2 ± 2.6a |
| AOAA | ||
| 5 μM | 78.9 ± 6.8 | 137.5 ± 11.0a,b |
| 50 μM | 35.5 ± 5.1a | 72.7 ± 3.9b |
| 500 μM | 5.7 ± 1.0a | 1.4 ± 1.3a |
- a p <0.05 vs. KRB ;
- b p < 0.05 vs. inhibitor alon (repeated measures ANOVA, Student-newman-Keuls multipel comparisons test).
Pyruvate was also co-incubated with three other compounds, which are known to reduce KYNA synthesis (veratridine, quisqualate, and l-α-aminoadipate ; Grams-bergen et al., 1997). At a concentration of 500 μM, when all compounds decreased KYNA production to ≤30% of control values, pyruvate attenuated (quisqualate) or prevented (veratridine and l-α-aminoadipate) the effects of the inhibitors (Fig. 3)
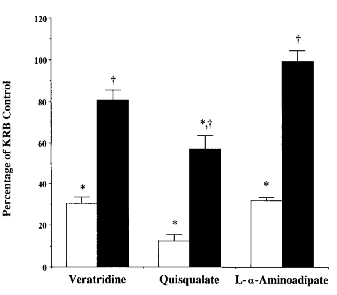
KYNA production in cortical tissue slices incubated with 500 μM veratridine, quisqualate, or L-α-aminoadipate in standard KRB (open columns) or in the presence of 5 mM pyruvate (solid columns). Experiments were performed as described in the text, and KYNA was measured in the medium. Data (means ± SEM ; n = 3) are expressed as a percentage of standard KRB (2.0 ± 0.2 pmol of KYNA/mg of protein/h ; n = 6). In parallel experiments, 5 mM pyruvate alone increased KYNA production to 194.7 ± 13.0% of control values (p < 0.05 ; n = 6). *p < 0.05 vs. standard KRB ; †p < 0.05 vs. inhibitor alone (repeated measures ANOVA).
Effects of other 2-oxoacids
As the end product of glycolysis and a primary fuel of the tricarboxylic acid cycle, pyruvate can restore normal metabolic activity in brain tissue slices during episodes of energy deprivation (Tsacopoulos and Magistretti, 1996 and references therein ; Izumi et al., 1997). Pyruvate also attenuates LKYN transport under hypoglycemic conditions and increases LKYN transamination in its capacity as a co-substrate of KAT (see above). To examine if other endogenous 2-oxoacids can duplicate these effects of pyruvate, the straight-chain 2-oxoacids oxaloacetate, α-ketoglutarate, and α-ketomethylbutyrate, and the branched-chain 2-oxoacids α-ketoisocaproate and α-ketoisovalerate were tested using cortical tissue slices.
With one exception (α-ketoisovalerate in glucose-free medium), all 2-oxoacids (5 mM) significantly raised KYNA production above respective control levels in both standard KRB and glucose-free medium (Fig. 4A). Oxaloacetate was the most potent compound in both media, increasing KYNA production significantly above basal levels even in the absence of glucose. The intracellular concentration of LKYN remained unaffected by α-ketoglutarate and α-ketoisovalerate, whereas α-ketoisocaproate and α-ketomethylbutyrate caused modest but statistically significant decreases in the intracellular LKYN content of slices incubated in KRB. In the absence of glucose, oxaloacetate was the only 2-oxoacid to revert the intracellular LKYN content to normal levels (Fig. 4B). In keeping with previous observations (Hodgkins and Schwarcz, 1998a,b), MTT formazan formation, a biochemical index of mitochondrial energy metabolism (Rist et al., 1996 ; Cohen et al., 1997), was reduced significantly in glucose-free medium (by 48.1 ± 2.8% ; p < 0.05, repeated measures ANOVA). Of the five 2-oxoacids tested under normoglycemic conditions, none increased (and α-ketomethylbutyrate in fact slightly decreased) MTT formazan formation. Only α-ketoglutarate and oxaloacetate were able to bolster mitochondrial activity in glucose-deprived KRB (data not shown).
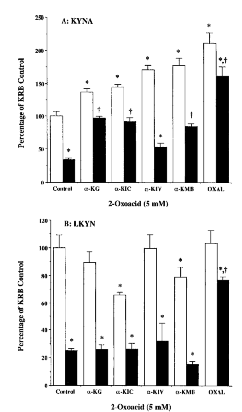
Effect of straight- and branched-chain 2-oxoacids (5 mM) on KYNA production (A) and LKYN uptake (B) in cortical tissue slices incubated in standard KRB (open oclumns) or glucose-free medium (solid columns). Experiments were performed as described in the text, and KYNA and LKYN were measured in the medium and prewashed tissue, respectively. Data (means ± SEM ; n = 3) are expressed as a percentage of standard KRB controls (KYNA : 2.5 ± 0.2 pmol/mg of protein/h ; LKYN : 39.3 ± 3.6 pmol/mg of protein/h ; n = 9). *p < 0.05 vs. standard KRB controls ; †p < 0.05 vs. glucose-free controls (repeated measures ANOVA). α-KG, α-ketoglutarate ; α-KIC, α-ketoisocaproate ; α-KIV, α-ketoisovalerate ; α-KMB, α-ketomethylbutyrate ; OXAL, oxaloacetate.
Like pyruvate, the 2-oxoacids α-ketoglutarate and α-ketomethylbutyrate (each at 5 mM) were also capable of reversing the effects of veratridine, quisqualate, and l-α-aminoadipate on KYNA formation (n = 3 per drug ; p < 0.05, repeated measures ANOVA ; data not shown).
Modulation of KYNA formation by 2-oxoacids in peripheral tissues
To determine if the augmentation of KYNA production by 2-oxoacids was specific to the brain, the effects of pyruvate, α-ketoglutarate, and α-ketomethylbutyrate were also tested on kidney and liver tissue slices incubated in KRB. Basal production of KYNA was 14.1 ± 0.6 and 13.4 ± 1.3 pmol/mg of protein/h (n = 6 each) for liver and kidney, respectively. Addition of the cosubstrates increased KYNA production by 300-500%, and no 2-oxoacid preference by either hepatic or renal tissue was observed (p > 0.05, two-way ANOVA ; data not shown).
Regulation of KYNA production at hyperphysiological concentrations of LKYN
The next set of experiments was designed to determine the effect of pyruvate (0.5-50 mM) on KYNA formation at higher concentrations of LKYN (20 μM to 2 mM) (Fig. 5). Using 0.5 mM pyruvate, a nonsignificant trend toward increased KYNA levels was observed at all LKYN concentrations (p > 0.05). At 20 and 200 μM LKYN, the percent increase in KYNA production caused by 5 mM pyruvate was similar to that observed with 2 μM LKYN (cf. Fig. 1). A much larger larger increased (to 500% of basal levels) in KYNA formation was observed with 2 mM LKYN. This effect, which was noted using both 5 and 50 mM pyruvate, was significantly greater than that seen at lower LKYN concentrations (p <0.05).
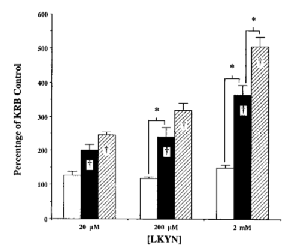
Effect of 0.5 mM (open columns), 5 mM (solid columns), or 50 mM (hatched columns) pyruvate on the production of KYNA in cortical tissue slices at various LKYN concentrations. experiments were performed as described in the text, and KYNA was measured in the medium. Data (means ± SEM ; n = 3) are expressed as a percentage of KYNA produced in standard KRB [LKYN (20 μM) : 34.1 ± 1.9 pmol/mg of protein/h ; LKYN (200 μM) : 183. 1 ± 10.3 pmol/mg of protein/h ; LKYN (2 mM) : 618.0 ± 7.4 pmol/mg of protein/h]. *p < 0.05 ; †p < 0.05 vs. standard KRB controls (two-way ANOVA).
The five other 2-oxoacids used in this study were also tested for their ability to augment KYNA production at higher LKYN concentrations. To this end, two concentrations of the 2-oxoacids (5 and 50 mM and of LKYN (200 μM and 2 mM) were investigated (n = 3 per experimental condition). At 200 μM LKYN, no 2-oxoacid, at either, 5 or 50 mM, increased KYNA production beyond the degree observed at 2 μM LKYN (cf. Fig. 4A), and none of the compounds was equipotent with pyruvate (data not shown). With mM LKYN, 5 and 50 mMα-ketoglutarate were equipotent with pyruvate, elevating KYNA production to 466 ± 38% and 507 ± 28%, respectively, of control levels (p < 0.05 ; twoway ANOVA). The only other 2-oxoacid capable of raising the transamination rate further was 50 mM oxaloacetate (from 211 ± 16% at 2 μM LKYN to 368 ± 11% at 2 mM LKYN ; p < 0.05, two-way ANOVA).
In vivo microdialysis
Microdialysis was performed in the dorsal hippocampus of unanesthetized, freely moving rats in order to study the in vivo effects of one straight-chain (pyruvate) and one branched-chain (α-ketoisocaproate) 2-oxoacid on extracellular KYNA concentrations. Addition of either of the two co-substrates to the perfusate resulted in a rapid elevation of KYNA levels (Fig. 6). Pyruvate at 10 mM caused an ~200% increase in KYNA production (p < 0.05), whereas 10 mMα-ketoisocaproate modestly raised KYNA levels to ~140% of baseline values (p > 0.05). Perfusion with a 100 mM concentration of the 2-oxoacids led to significantly larger augmentations (p < 0.05 as compared with a 10 mM concentration of the 2-oxoacids ; two-way ANOVA). Moreover, the effect of 100 mMα-ketoisocaproate was more pronounced than that of 100 mM pyruvate (p < 0.05, two-way ANOVA). Although KYNA concentrations remained elevated as long as the 2-oxoacids were present, the effect caused by 100 mM pyruvate became less pronounced with time, and was significantly diminished by 4 h (Fig. 6A). No such decline was observed during perfusion with 100 mMα-ketoisocaproate (Fig. 6B). Once the 2-oxoacid was removed, KYNA levels in all cases promptly returned to basal levels.
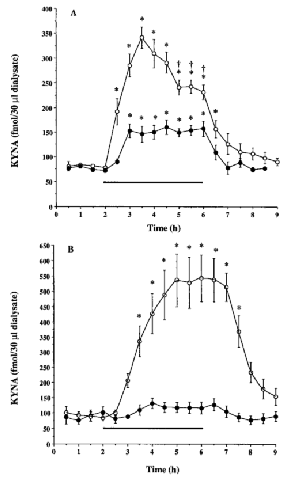
Effect of pyruvate (A) and α-ketosicoaproate (B) on extracellular KYNA levels in the dorsal hippocampus in vivo. Microdialysis was performed as described in the text. 2-Ooxoacids (•, 10 mM ; ○, 100 mM) were administered through the dialysis probe for 4 h (bar). Data are the means ± SEM of four to eight animals per experimental group. Basal levels were 84.8 ± 4.5 fmol of KYNA/30 μl of dialysate (n = 26). *p < 0.05 vs. basal levels ; †p < 0.05 vs. KYNA production at 3.5 h (two-way ANOVA).
DISCUSSION
The present study was designed to characterize detail the modulation of KYNA formation by 2-oxoacids in various rat tissues. Because of KYNA's role as a putative modulator of cerebral NMDA receptor function (Stone, 1993), particular emphasis was placed on the examination of brain tissue. The results from both in vitro and in vivo experiments demonstrated that pyruvate and other 2-oxoacids augment KYNA production primarily due to their ability to facilitate the irreversible enzymatic transamination of LKYN to KYNA. Notably, this effect of the 2-oxoacids was observed in all brain regions examined (including the cerebellum ; unpublished observation), and also in peripheral tissues, which contain a larger number of LKYN transaminases (Noguchi et al., 1975 ; Harada et al., 1978) and therefore responded with greater increases in KYNA formation.
The experiments described in this report are an extension of a recent study of the regulation of KYNA synthesis in the rat brain (Hodgkins and Schwarcz, 1998b). Using the same paradigm as in the present work, i.e., incubation of tissue slices with LKYN and measurement of newly produced KYNA in the extracellular milieu, we observed that pharmacological interference with cellular energy metabolism at the level of glycolysis, tricarboxylic acid cycle, or mitochondrial electron transfer results in a substantial reduction in intracellular LKYN accumulation, and that most drug effects are attenuated or prevented by providing cellular energy through pyruvate and, to a lesser degree, lactate. We concluded that cellular energy status, by regulating the availability of LKYN for enzymatic transamination, is a significant determinant of KYNA levels in the extracellular compartment. Our data also suggested, however, that 2-oxoacids, in their capacity as co-substrates of KAT, are in a position to influence KYNA synthesis. The present study provides several lines of evidence in support of this notion.
We first used pyruvate, a co-substrate of both KAT I and II in the rat brain (Guidetti et al., 1997), for hypothesis testing. Under normoglycemic conditions, pyruvate dose-dependently raised KYNA formation with an ED50 value in the low millimolar range, without affecting the efficiency of LKYN transport into the cell. Addition of pyruvate to the incubation medium also attenuated or neutralized the effects of quisqualate and l-α-aminoadipate, two compounds that profoundly interfere with KYNA production by inhibiting KAT II activity (Guidetti et al., 1997), and of veratridine, which reduces brain KYNA levels in vitro and in vivo by indirect interference with the transamination reaction (Wu et al., 1992 ; Gramsbergen et al., 1997). To a certain degree, pyruvate was also capable of reducing the efficacy of the potent nonspecific aminotransferase inhibitors DCVC (Kato et al., 1996 ; Guidetti et al., 1997) and AOAA (Kuriyama et al., 1966 ; Fitzpatrick et al., 1983). Finally, the ability of pyruvate to raise KYNA formation in brain tissue was found to be greatly enhanced at high (millimolar) LKYN concentrations, probably because of the recruitment of additional aminotransferases for KYNA synthesis (Okuno et al., 1991 ; cf. below). All these results are compatible with the concept that the action of pyruvate as a co-substrate of the transamination reaction serves a regulatory role in KYNA synthesis.
The use of other 2-oxoacids, all established thought not equally efficient aminoacceptors in KAT-catalyzed reactions (Okuno et al., 1991), further substantiated the idea that KYNA production can be effectively influenced by co-substrates of the biosynthetic enzymes. Thus, in standard KRB all five 2-oxoacids tested raised KYNA above control levels, albeit to a different extent. In all cases, this occurred without concomitant increases in LKYN transport (for unknown reasons, two of the test compounds, α-ketoisocaproate and α-ketomethylbutyrate, even lowered intracellular LKYN content) and without stimulating MTT formazan formation, a marker for cellular energy status. Like pyruvate, α-ketoglutarate and α-ketomethylbutyrate (the only two oxoacids tested) also substantially increased KYNA formation in liver and kidney slices and reversed the inhibition of KYNA production caused by quisqualate, α-aminoadipate, or veratridine in brain tissue. With increasing LKYN concentration, the various 2-oxoacids displayed different abilities to stimulate KYNA synthesis above control levels, probably a reflection of different co-substrate specificities of the aminotransferases that are recruited for KYNA synthesis at high LKYN concentrations. In addition, it is possible that metabolic interconversion to pyruvate during the incubation period may have modified the actions of the tricarboxylic acid cycle intermediates oxaloacetate and α-ketoglutarate.
As demonstrated previously (Gramsbergen et al., 1997), KYNA formation dropped precipitously when glucose was omitted from the incubation medium. This reduction was accompanied by, and causally related to, dramatic decreases in energy metabolism and LKYN uptake (Hodgkins and Schwarcz, 1998b). Pyruvate counteracted all these effects of glucose deprivation in a dose-dependent manner, but of the other five 2-oxoacids tested only oxaloacetate duplicated the effects of pyruvate. α-Ketoglutarate was the only other 2-oxoacid that attenuated the aglycemia-induced decrement in MTT formazan formation without, however, reversing the associated decrease in intracellular LKYN levels. In contrast, all oxoacids except α-ketoisocaproate significantly enhanced KYNA production in glucose-deprived tissue. Taken together, these data indicate that the normalization of KYNA formation in situations of impaired cellular energy metabolism can be achieved both by increasing the availability of 2-oxoacids and by providing cellular fuels such as glycolytic or tricarboxylic acid cycle intermediates (Hodgkins and Schwarcz, 1998b).
Using the straight-chain 2-oxoacid pyruvate and the branched-chain 2-oxoacid α-ketoisocaproate, we also examined if enhanced co-substrate availability results in elevated KYNA levels in vivo. This was accomplished by performing hippocampal microdialysis in unanesthetized rats, i.e., in a test system that has been used successfully to study cerebral KYNA regulation (Wu et al., 1992, 1995 ; Wu and Schwarcz, 1996). Perfusion with each of the two 2-oxoacids (10 or 100 mM) indeed caused prompt, dose-dependent increases in KYNA in the dialysate, but the levels rapidly reverted to baseline values upon oxoacid withdrawal. Qualitatively similar results were obtained in recent experiments using perfusion with α-ketoisovalerate or α-keto-β-methylvalerate (unpublished observations). Although it was noted that pyruvate was the more effective 2-oxoacid at 10 mM and α-ketoisocaproate evoked a greater response at 100 mM, these quantitative differences, as well as the unexpected decline in efficacy of 100 mM pyruvate toward the end of the perfusion period (Fig. 6A), cannot be reasonably explained at present. Our results leave no doubt, however, that 2-oxoacids are capable of temporarily raising extracellular KYNA levels in the (rat) brain in vivo.
The data described in this report raise the possibility that 2-oxoacids participate in the regulation of NMDA receptor function by augmenting the inhibitory potency of KYNA (see introductory section). In addition, it is conceivable that 2-oxoacids, by deflecting LKYN toward the formation of KYNA, affect the levels of 3-hydroxykynurenine and quinolinate, two neurotoxic metabolites of the quinolinate branch of the kynurenine pathway (Schwarcz et al., 1983 ; Okuda et al., 1996, 1998). These considerations may be of particular relevance for the human brain, which normally contains 0.1-1.5 μM KYNA (Turski et al., 1988 ; Beal et al., 1992), i.e., a concentration that approximates KYNA's ED50 value at the glycine co-agonist site of the NMDA receptor (Parsons et al., 1997), and has relatively high ambient brain tissue levels of 3-hydroxykynurenine (Pearson and Reynolds, 1991). Notably, modulation of NMDA receptor function by 2-oxoacids may not only be of physio-logical significance, but may also increase neuronal resistance against excitotoxic insults. In this context, it is particularly noteworthy that reductions in the endogenous levels of KYNA in the rat brain exacerbate neuronal vulnerability (Poeggeler et al., 1998), and that pyruvate can provide protection against hypoxic-ischemic (Izumi et al., 1994, 1997) and oxidative neuronal damage (O'Donnell-Tormey et al., 1987 ; Brand and Hermfisse, 1997 ; Desagher et al., 1997 ; Giandomenico et al., 1997). It follows that 2-oxoacid administration, through the mechanism elaborated here, may offer a novel antiexcitotoxic/neuroprotective treatment strategy. Given the innocuous nature of both straight- and branched-chain 2-oxoacids (Walser et al., 1973 ; Mitch et al., 1982 ; Dijkstra et al., 1984 ; Mitch et al., 1994) and their easy access to the brain through the monocarboxylic acid transporter (Oldendorf, 1973 ; Conn et al., 1983 ; Steele, 1986), this concept appears to be readily testable in experimental animals and in humans.
Acknowledgements
We thank Mrs. Joyce Burgess for excellent secretarial assistance and Mr. Peter Baab for help with the microdialysis experiments. This work was supported by USPHS grants NS 28236 and HD 16596.


