Differential distribution of Rac1 and Rac3 GTPases in the developing mouse brain: implications for a role of Rac3 in Purkinje cell differentiation
Abstract
Rac3 is one of the three known Rac GTPases in vertebrates. Rac3 shows high sequence homology to Rac1, and its transcript is specifically expressed in the developing nervous system, where its localization and function are unknown. By using Rac3-specific antibodies, we show that the endogenous Rac3 protein is differentially expressed during mouse brain development, with a peak of expression at times of neuronal maturation and synaptogenesis. Comparison with Rac1 shows clear-cut differences in the overall distribution of the two GTPases in the developing brain, and in their subcellular distribution in regions of the brain where both proteins are expressed. At P7, Rac3 staining is particularly marked in the deep cerebellar nuclei and in the pons, where it shows a discontinuous distribution around the neuronal cell bodies, in contrast with the diffuse staining of Rac1. Rac3 does not evidently co-localize with pre- and post-synaptic markers, nor with GFAP-positive astrocytes, but it clearly co-localizes with actin filaments, and with the terminal portions of calbindin-positive Purkinje cell axons in the deep cerebellar nuclei. Our data implicate Rac3 in neuronal differentiation, and support a specific role of this GTPase in actin-mediated remodelling of Purkinje cell neuritic terminals at time of synaptogenesis.
Introduction
The Rho family of small GTPases has been implicated in the organization of the actin cytoskeleton and in adhesion during neuronal differentiation. Analyses in different organisms and studies with primary neurons have shown that Rac GTPases act as regulators of process outgrowth and axonal guidance (reviewed by Luo, 2000). Among Rho GTPases, Rac stimulates actin polymerization at the cell surface (Ridley et al., 1992), necessary for the crawling of the growth cone. Thus far, however, it has not been established which of the three Rac GTPases identified in vertebrates is involved in this process: the best studied, ubiquitous Rac1 GTPase, the haematopoietic specific Rac2 protein, and the least characterized Rac3/Rac1B protein (Haataja et al., 1997; Malosio et al., 1997). Rac3 has strongest homology to Rac1. The greatest divergence between Rac3 and Rac1 occurs at the carboxyterminal hypervariable region (residues 180–192). This region is post-translationally modified, and is important for the specific intracellular localization and interaction of the GTPase with target proteins. In previous studies, we found that the transcript for Rac3/Rac1B (hereafter referred to as Rac3) is specifically expressed in the developing chicken peripheral and central nervous system (Malosio et al., 1997). The levels of the transcript are developmentally regulated in the avian brain, with a peak of expression corresponding to the time of intense neurite branching and synaptogenesis (Albertinazzi et al., 1998). The highest Rac3 mRNA expression among human tissues studied is in the brain (Haataja et al., 1997), where Rac1 mRNA, but not Rac2 mRNA, is also present (Didsbury et al., 1989). When compared with Rac1, overexpression of Rac3 specifically potentiates neuritogenesis and branching from cultured avian retinal neurons (Albertinazzi et al., 1998). Moreover, the carboxyterminal portion of Rac3 is necessary and sufficient for Rac3-specific effects on cultured neurons (Albertinazzi et al., 1998). Although the published data point to an important role of Rac3 in neural development, the lack of appropriate antibodies has not allowed us to establish where the endogenous protein is expressed, and therefore to gain insight into the role of Rac3 in vivo. In this study, by using an anti-Rac3-specific antibody recently obtained in the laboratory, we show that Rac3 has a specific localization in the mouse developing brain. In particular, the distribution of Rac3 is strikingly different from that of the ubiquitous Rac1 protein in deep cerebellar nuclei (DCN) and in the pons, where both GTPases are expressed. The comparison of the distribution of Rac3 with that of several neuronal and non-neuronal markers in these areas of the brain strongly supports a role of Rac3 in Purkinje cell development, at times of neuronal differentiation and synaptogenesis.
Materials and methods
Antibodies
The anti-Rac3 polyclonal antibody (pAb) was obtained by immunization of rabbits with a peptide corresponding to the carboxyterminal portion of Rac3 (CPPPVKKPGKKCTVF, residues 178–192) conjugated to keyhole limpet haemocyanin. Other antibodies included: mouse monoclonal antibodies (mAb) against Rac1 (Transduction Laboratories–Becton Dickinson, Franklin Lakes, NJ, USA), VAMP2 (Synaptic Systems GmbH, Göttingen, Germany), synaptophysin (Synaptic Systems GmbH), MAP2 (HM-2 from Sigma-Aldrich), calbindin (Swant), tubulin β3 (Tuj1 from BabCO, Richmond, CA, USA), mAb 3A10 for neurofilaments (Serafini et al., 1996) obtained from the Developmental Studies Hybridoma Bank (The University of Iowa, IA, USA), guinea-pig anti-Shank mAb (Sala et al., 2001), rat anti-GFAP mAb (from Virginia Lee, Philadelphia, PA, USA) and anti-synapsin I pAb G178 (Valtorta et al., 1988).
Immunohistochemistry and immunofluorescence
All experimentation reported in this article was conducted according to the guidelines and regulations of the NIH for the use and care of laboratory animals in experimental research. The mice were anaesthetized with CO2 and decapitated. Mouse brains from different developmental stages were dissected and fixed overnight at 4 °C in 4% paraformaldehyde, 4% sucrose. Samples were washed with phosphate-buffered saline (PBS), cryoprotected overnight with 18% sucrose in PBS, and frozen in O.C.T. compound (VWR International Ltd, Poole, Dorset, UK). For immunohistochemistry, 20-µm-thick sections were permeabilized for 1 h with blocking buffer (0.1% Triton X-100, 10% goat serum, 0.2 mg/mL bovine serum albumin (BSA) in PBS), and incubated overnight at 4 °C with primary antibodies. For immunoperoxydase staining, primary pAbs were detected by using a Vectastain® Elite ABC Kit (Vector Laboratories, Burlingame, CA, USA), and mouse mAbs were detected with a Dako Ark kit (DakoCytomation SpA, Milan, Italy). Sections were analysed with a Nikon Eclipse 6100 microscope. Control sections were incubated with pre-immune sera, or with secondary antibodies only. To test for specificity, the diluted anti-Rac3 pAb (1 : 500) was pre-incubated with 50 µg of either gstRac1 or gstRac3 proteins prebound to GSH-Agarose beads. After 1 h incubation, the beads were removed by centrifugation, and the unbound solutions were added to the sections for incubation overnight and processing following the immunoperoxidase protocol.
For immunofluorescence, 10-µm-thick sections were incubated overnight at 4 °C with primary antibodies in 15% serum, 0.3% Triton X-100, 450 mm NaCl, 20 mm sodium phosphate buffer pH 7.4, followed by incubation for 1.5 h at room temperature with fluorescently labelled second antibodies. For double labelling, the two secondary antibodies (Jackson ImmunoResearch Laboratories Inc, West Grove, PA, USA; Southernbiotech, Birmingham, AL, USA; ICN Pharmaceuticals Inc, Costa Mesa, CA, USA) were added sequentially. TRITC-conjugated phalloidin was from Sigma-Aldrich. Sections were analysed with a Bio-Rad MRC 1024 confocal microscope (Bio-Rad, Hercules, CA, USA).
Northern blot analysis
Mouse brain total RNA from different stages was prepared as described previously (Chomczynski & Sacchi, 1987). Northern blot analysis of total RNA (20 µg per lane) was performed as previously described (Lehrach et al., 1977). Blots were hybridized with a 0.6-kb probe corresponding to the translated region of the cDNA for mouse Rac3. After hybridization with 32P-labelled probes for 20 h at 65 °C (Lehrach et al., 1977), filters were washed at high stringency at 65 °C, and exposed for 1 day to Amersham Hyperfilm-MP.
Immunoprecipitation and immunoblotting
Mouse brains from different stages and organs from P7 mice were extracted with lysis buffer (1% Triton X-100, 150 mm NaCl, 20 mm Tris–Cl pH 7.5 and 10 µg/mL each of antipain, chymostatin, leupeptin and pepstatin). Lysates were clarified by centrifugation. For each immunoprecipitation, 10–20 µL of immune or pre-immune serum adsorbed to 25 µL Protein A–Sepharose beads (Amersham Biosciences, Piscataway, NJ, USA) were added to lysates (1.5–3 mg protein per immunoprecipitation). After 3 h at 4 °C with rotation, immunoprecipitates were washed four times with 0.75 mL of washing buffer (lysis buffer with 0.5% Triton X-100), and analysed by SDS-PAGE and immunoblotting with the anti-Rac3 pAb (serum 1 : 100–1 : 500), or anti-Rac1 mAb (10 µg/mL). For the detection of primary antibodies, blots were incubated with 0.2 µCi/mL of 125I-Protein A or 125I-anti-mouse Ig (Amersham Biosciences), washed, and exposed to Amersham Hyperfilm-MP. To test for the specificity of the anti-Rac3 pAb, control immunoprecipitations were performed by pre-incubating Protein A–Sepharose beads coated with anti-Rac3 for 1.5 h at 4 °C with 200 µg of either gstRac1 or gstRac3. The beads were then rinsed three times in washing buffer, and used for immunoprecipitation from P7 mouse lysates.
Tissue fractionation
All operations were done at 0–4 °C. Five P7 mouse brains were suspended in 5 mm Hepes–NaOH pH 7.4, 0.32 m sucrose, and 10 µg/mL each of antipain, chymostatin, leupeptin and pepstatin. The brains were homogenized with 4–5 strokes in a Potter homogenizer. The homogenate was centrifuged for 10 min at 800 g. The resulting supernatant was centrifuged for 15 min at 10 000 g. The pellet was washed with homogenization buffer and centrifuged once more for 15 min at 10 000 g. The resulting pellet represented the synaptosomal-enriched fraction. The suspernatants from the two 10 000-g centrifugations were pooled, and centrifuged for 1 h at 120 000 g to separate the membrane pellet from the cytosolic fraction. All fractions were analysed by immunoblotting with pAb anti-Rac3, and mAb anti-VAMP2 and anti-synaptophysin.
Results
The Rac3 protein is specifically and developmentally expressed in mouse brain
To obtain information on the expression of the Rac3 protein in vivo, we raised anti-Rac3-specific antibodies by immunizing rabbits with a peptide corresponding to the 15 carboxyterminal residues including the hypervariable region of Rac proteins, as described in the Materials and methods. All antibodies were able specifically to recognize gstRac3, but not gstRac1 (Fig. 1A). One of the antibodies was chosen for the analysis described in this study. This antibody yielded good specific staining of sections from developing mouse brain (see Results below), recognized specifically a band of the right molecular weight from mouse brain lysates (Fig. 1B) and its specificity for Rac3 was demonstrated by competition experiments which showed that gstRac3, but not gstRac1, was able to prevent the immunoprecipitation of the endogenous Rac3 protein when added during immunoprecipitation (Fig. 1C). Moreover, a test with antibody dilutions similar to those utilized for immunohistochemistry indicated that the Rac3 pAb was more efficient in recognizing Rac3 than the anti-Rac1 mAb utilized in this study (Fig. 1D).
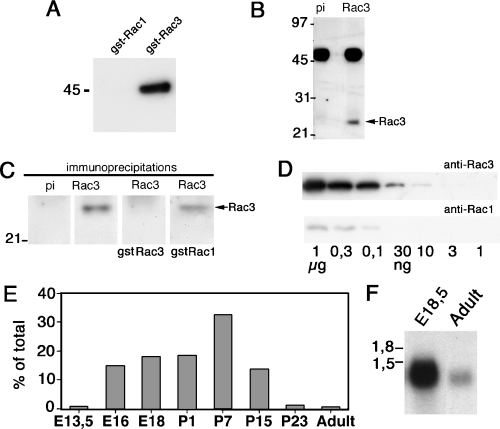
Expression of Rac3 during mouse brain development. (A) Two micrograms of gstRac1 or gstRac3 were assayed by immunoblotting to test the specificity of the anti-Rac3 antibody. (B) Protein (1.5 mg) from P7 mouse brain lysate was immunoprecipitated with Protein A–Sepharose bound to pre-immune (pi) or immune (Rac3) anti-Rac3. Immunoprecipitates were immunoblotted with the anti-Rac3 pAb. (C) Protein A–Sepharose beads coupled to pre-immune (pi) or immune anti-Rac3 serum (Rac3) were used directly for immunoprecipitation (first two lanes on the left), or were pre-incubated with either gstRac3 or gstRac1 before immunoprecipitation from mouse P7 brain lysate (1.5 mg protein per immunoprecipitation), as described in the Materials and methods. Immunoprecipitates were blotted with the anti-Rac3 pAb. Pre-incubation with gstRac3, but not gstRac1, prevented immunoprecipitation of endogenous Rac3 from the brain lysate. (D) Two gels were loaded with a series of decreasing amounts of gstRac3 protein (from 1 µg in lane 1, to 1 ng in lane 7), and utilized for immunoblotting with either the anti-Rac3 pAb 106 (upper filter) or the anti-Rac1 mAb (lower filter). A clear difference between the two antibodies could be observed in their ability to reveal Rac3 under the conditions utilized. (E) Two milligrams of protein from lysates of mouse brains from the indicated stages was utilized for immunoprecipitation with anti-Rac3 pAb. For E13.5 embryos, lysates of the whole head were utilized. After blotting, the filter was probed with the anti-Rac3 pAb. The intensity of the bands corresponding to the immunoprecipitated Rac3 was expressed as a percentage of the sum of all values shown. (F) Northern blot analysis on total RNA isolated from mouse brains from the indicated stages. An Rac3-specific probe was utilized for hybridization.
Immunoprecipitation from equal amounts of mouse brain lysates at different stages of development showed a peak of distribution of Rac3 around P7 (Fig. 1E). Accordingly, we found that the transcript for Rac3 was more abundant in the developing mouse brain than in adult brain (Fig. 1F). Of all the organs tested from P7 mice, the Rac3 protein was significantly expressed only in brain (Fig. 2), in agreement with our previous findings in chicken (Malosio et al., 1997; Albertinazzi et al., 1998).
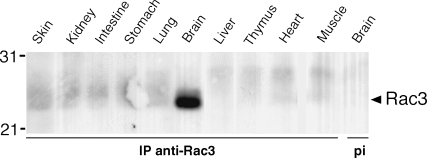
Rac3 is specifically expressed in P7 mouse brain. Rac3 was immunoprecipitated from 3 mg of protein from lysates obtained from the indicated P7 mouse tissues. As a control, the same amount of brain lysate was incubated with pre-immune serum (last lane to the right). Immunoprecipitates were incubated with anti-Rac antibody. Molecular weight markers are indicated to the left of the blot.
Distinct patterns of distribution for Rac1 and Rac3 in the developing mouse brain
Immunohistochemical analysis was performed to compare the localization of Rac1 and Rac3 in the developing mouse brain. Brain sections between E16 and P7 were analysed. During this period Rac3 was detectable by biochemical analysis (Fig. 1E). At E16, the staining for Rac1 was strong all over the brain (Fig. 3A), whereas the staining for Rac3 was very weak (Fig. 3F). At higher magnifications, Rac1 was homogeneously distributed around the cells (Fig. 3C and D), whereas the staining for Rac3 was concentrated in the nuclei (Fig. 3G). At E18, the distribution of Rac1 was similar to that observed at E16 (Fig. 3I–K), whereas Rac3 staining was stronger, and mainly nuclear (Fig. 3L–N) in most regions of the brain. Sections from P1 brain showed a strong signal for Rac1 (Fig. 4A), which was homogeneously distributed around the cells (Fig. 4C, E and F). Again, the staining for Rac3 was nuclear in most regions of the brain, including the cerebellar (Fig. 4G) and cerebral cortex (Fig. 4J). Interestingly, a different type of staining was evident at this stage in the deep regions of the cerebellum (Fig. 4B, arrow), and in the underlying regions, where Rac3 had a discontinuous punctate, pericellular distribution (Fig. 4I). In P7 brain, the staining for Rac3 became more obvious in the deeper regions of the cerebellum and in the pons (Fig. 5A and B). This staining could be specifically prevented by pre-incubation of the anti-Rac3 antibody with gstRac3 (Fig. 5D), but not with gstRac1 (Fig. 5C). By comparison, Rac1 showed a homogeneous distribution throughout the brain also at P7 (data not shown). In regions such as the pons, where both Rac proteins were expressed, the pattern of distribution of Rac3 was different from Rac1 (Fig. 5E and H). Rac3 showed a punctate distribution similar, although not identical, to that of the presynaptic marker synapsin I (Fig. 5G). Analysis at higher resolution by confocal microscopy confirmed the peculiar localization of Rac3 in the DCN and the underlying pons, when compared with the ubiquitously expressed Rac1 (Fig. 5I and J). Whereas Rac1 was homogeneously distributed in neurons, Rac3 showed a discontinuous localization around the neuronal cell bodies with a partial overlap with Rac1. In contrast to Rac1, Rac3 appeared always excluded from the perinuclear cytoplasm of neurons. These data indicate for the first time that Rac3 and Rac1 are coexpressed in discrete areas of the developing mammalian brain, where they show strikingly different subcellular distributions.
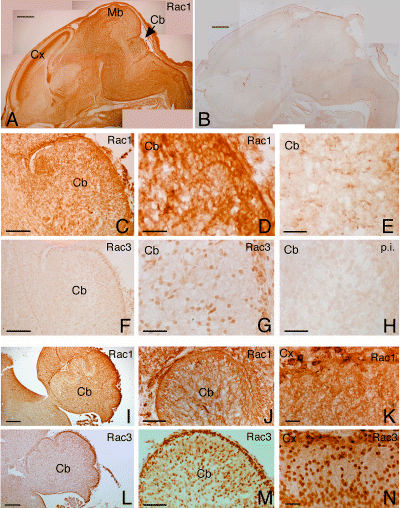
Distribution of Rac1 and Rac3 in E16 and E18 mouse brain. Parasagittal sections from E16 (A–H) and E18 (I–N) mouse brains were incubated with anti-Rac1 mAb (A, C, D and I–K) or with anti-Rac3 pAb (F, G and L–N), and further processed for immunohistochemistry as described in the Materials and methods. Controls included sections incubated with secondary antibody alone (B and E) or with Rac3 pre-immune serum (H). At E16, Rac1 staining is strong throughout the brain (A), whereas Rac3 staining is weak (F), and concentrated in the nuclear region of the cells (G). Clear differences between Rac1 and Rac3 staining are evident also at E18, as shown in the cerebellum (J and M, respectively), and in the cerebral cortex (K and N, respectively). At E18 (L–N) the staining for Rac3 is more evident than at E16 (F and G). Cb, cerebellum; Cx, cerebral cortex; Mb, midbrain. Scale bars, 600 µm (A and B); 500 µm (I and L); 150 µm (C, F, J and M); 50 µm (K and N); 25 µm (D, E, G and H).
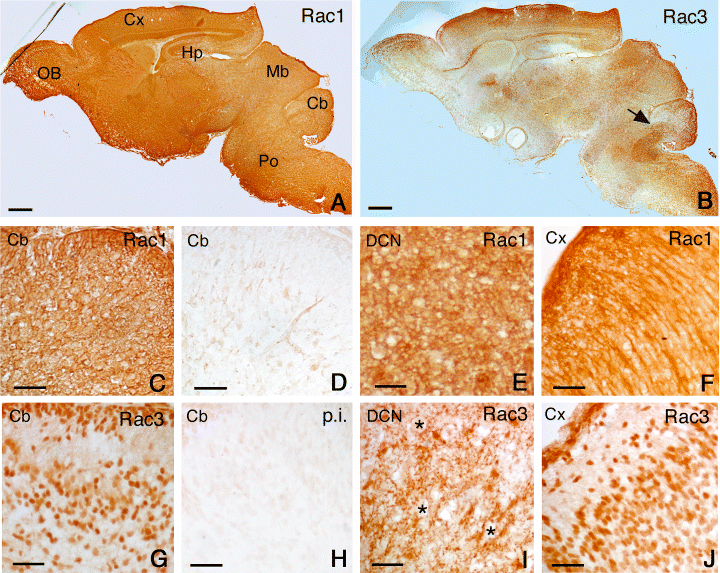
Distribution of Rac1 and Rac3 in P1 mouse brain. Parasagittal sections from P1 mouse brain were incubated with anti-Rac1 mAb (A, C, E and F), with secondary antibody alone (D), with anti-Rac3 pAb (B, G, I and J), or with Rac3 pre-immune serum (H). At low magnification, Rac1 shows a strong, diffuse staining in the brain (A), whereas the distribution for Rac3 is more heterogeneous (B). Clear differences between Rac1 and Rac3 staining are still evident, as shown in the cerebellum (C and G, respectively), and in the cerebral cortex (F and J, respectively), where the staining for Rac3 is mostly nuclear. By contrast, in the deep cerebellar nuclei (see arrow in B) Rac3 shows a discontinuous punctate distribution around the cell bodies (I), some of which have been marked by asterisks. Cb, cerebellum; Cx, cerebral cortex; Hp, hippocampus; Mb, midbrain; OB, olfactory bulb; Po, pons. Scale bars, 600 µm (A and B); 40 µm (C–J).
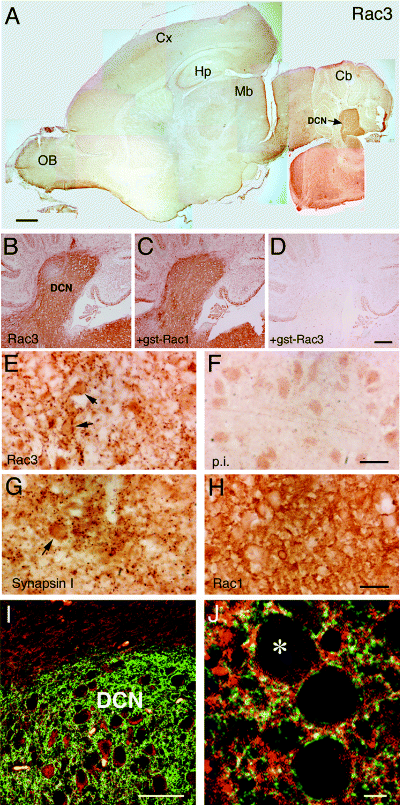
Distinct pattern of distribution for Rac1 and Rac3 in P7 mouse brain. Parasagittal sections of mouse P7 brain were prepared as described in the Materials and methods. Sections were incubated with anti-Rac3 serum (1 : 500, A–E), the corresponding pre-immune serum (1 : 250, F), anti-synapsin I pAb (G), or anti-Rac1 mAb (10 µg/mL, H). In C and D, the diluted anti-Rac3 antibody was pre-incubated with excess gstRac1 and gstRac3, respectively, before adding the antibody to the sections. B–D show low magnifications of sections including part of the cerebellar cortex, deep cerebellar nuclei (DCN) and part of the pons; E–H show higher magnification of the pons. A clear difference between Rac1 and Rac3 staining is evident when comparing panels E and H, respectively. Arrows in E and G point to individual cells. (I) Immunofluorescence showing low magnification of the deep region of the cerebellum: in contrast to the ubiquitously expressed Rac1 protein (red), the distribution of Rac3 (green) was restricted to the DCN. (J) In the pons, the more restricted localization of Rac3 (green) overlaps (yellow) with the spread distribution of Rac1 (red). The asterisk indicates one of the cell bodies in J. Scale bars, 600 µm (A); 200 µm (B–D); 20 µm (E–H); 50 µm (I); 5 µm (J).
Rac3 does not co-localize with synaptic markers in the pons and DCN
At P7 neuritic rearrangements and synaptogenesis are in progress in the cerebellum. A number of dots positive for presynaptic markers are already visible at this stage around the large DCN neurons (Garin & Escher, 2001) and around neurons in the pons (Fig. 6A). In these areas, the distribution of Rac3 was found to be largely distinct from presynaptic structures labelled with VAMP2 (Fig. 6A and C), synapsin-I (data not shown) and synaptophysin (Fig. 6B and D). We also found lack of evident co-localization between Rac3 and the post-synaptic markers Shank (Fig. 6E) and PSD-95 (data not shown), which showed a diffuse cytoplasmic distribution in neuronal cell bodies at this stage.
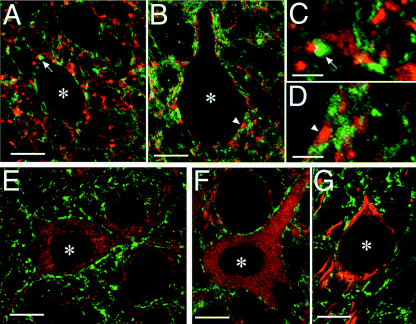
Rac3 does not co-localize with synaptic markers. Comparison of the distribution of Rac3 (green) with that of different cellular markers (red) in parasagittal sections including the pons (A, C and E–G) and the DCN (B and D) from P7 mice. Markers used for comparison include: the presynaptic markers VAMP2 (A and C) and synaptophysin (B and D); the post-synaptic marker Shank (E); the neuronal β3 tubulin (F); neurofilament (G). Panels C and D are higher magnifications from panels A and B, respectively: arrows (A and C) and arrowheads (B and D) indicate corresponding regions. No significant co-localization of Rac3 with any of the tested markers could be observed. Asterisks mark individual cell bodies. Scale bars, 10 µm (A, B and E–G), and 3 µm (C and D).
The distribution of Rac3 was distinguishable from that of cytoplasmic neuronal tubulin β3 (Fig. 6F) and neurofilament (Fig. 6G). Rac3 was distributed around the neuronal cell bodies labelled by the cytoskeletal markers, and in the neuropilum, in areas distinguishable from although often adjacent to neurofilament-positive neurites. The distribution of Rac3 was also distinguishable from that of GFAP-positive astrocytes, which were found mainly around the DCN at P7 (data not shown).
Rac3 is present in actin-positive, calbindin-positive Purkinje cell axon terminals
During development, DCN neurons are targets of mossy fibres, climbing fibres and Purkinje cell axons (Wang & Zoghbi, 2001), which form the majority of the synaptic terminals on mature DCN neurons (Roffler-Tarlov et al., 1979). We compared the distribution of Rac3 with that of calbindin, a marker for developing Purkinje cell axons (Jande et al., 1981). At low resolution, a striking and selective co-localization of calbindin with Rac3 was observed in the DCN (Fig. 7A and B). Interestingly, Rac3 was undetectable in the somatodendritic compartment of Purkinje cells, and in their calbindin-positive axonal tracts approaching the DCN. At higher magnification we found that the distributions of Rac3 and calbindin were largely overlapping, especially around the large cell bodies of DCN neurons (Fig. 7C–E). In this area, the calbindin-positive structures represent Purkinje cell axonal branches, which may eventually develop into presynaptic terminals. The Rac3-positive pericellular structures were positive for filamentous actin (F-actin) (Fig. 7F). By contrast, Rac3 did not co-localize with neurofilament-positive neurites within the DCN, although it was often found in their close proximity (Fig. 7J and K). These findings support the hypothesis that the Rac3-positive structures may represent the terminal portion of remodelling axonal branches. Interestingly, Rac3 co-localized with F-actin also around pontine neurons, showing that Rac3 was not specific for Purkinje axons (Fig. 7G–I). Table 1 gives a summary of the results from the immunohistochemical analysis performed in this study, both in the DCN and in the pons. Together these data implicate Rac3 in the specific remodelling of axonal terminals at the time of synaptogenesis in certain areas of the mouse brain.
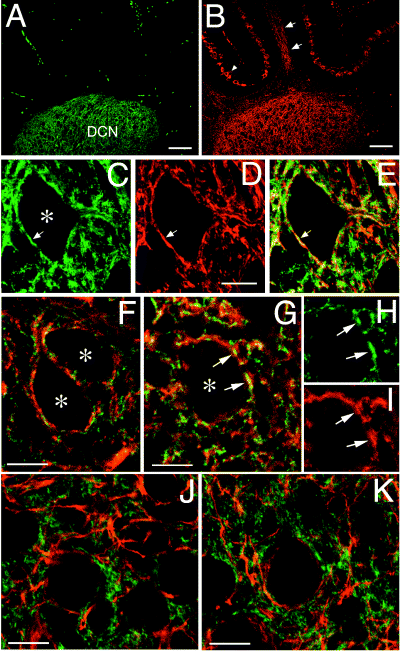
Co-localization of Rac3 with calbindin and F-actin in DCN. (A and B) Low magnification field of a parasagittal section from P7 mouse cerebellum showing the colocalization of Rac3 (A) with calbindin (B) in the DCN, but not in the cerebellar cortex. In B, Purkinje cells (arrowhead) and calbindin-positive neurites (arrows in the arbor vitae) are indicated. (C–E) Co-localization of Rac3 (C) with calbindin (D) around a neuron from the DCN. The merged signals are shown in E. (F–I) Co-localization of Rac3 with F-actin around neurons from the DCN (F) and from the pons (G). In panels H and I the signals for Rac3 (green) and F-actin (red) are shown separately. (J and K) Comparison of the distribution of Rac3 (green) with neurofilament (red) in the DCN. Arrows in G–I indicate corresponding regions in the three panels. Asterisks mark individual cell bodies. Scale bars, 100 µm (A and B); 10 µm (C–K).
| Antigen | Co-localization with Rac3 in DCN | Co-localization with Rac3 in the pons |
|---|---|---|
| Rac1 | + | + |
| VAMP2 | − | − |
| Synapsin | − | n.t. |
| Synaptophysin | − | − |
| Psd95 | − | − |
| Shank | − | − |
| GFAP | − | − |
| NF-3A10 | − | − |
| Calbindin | + | NA |
| Tuj1 | +/− | +/− |
| Map2 | − | − |
| F-actin | + | + |
| β1 integrin | + | + |
- The comparisons refer to the distribution of the indicated markers in the DCN, and in the pons, as observed following analysis of double immunofluorescence stainings on sections. (+) indicates clear co-localization of Rac3 with the indicated marker; (−) indicates lack of evident co-localization; (+/−) indicates weak, partial co-localization; NA (not applicable) is referred to the lack of a detectable signal for calbindin in the pons by immunofluorescence; n.t., not tested.
Rac3 is specifically enriched in a high-speed membrane fraction
We fractionated P7 mouse brains to separate a lower-speed P2′ synaptosomal fraction, and a P3 high-speed fraction containing lighter cellular membranes, as described in the Methods. Equal amounts of protein from the different fractions were analysed by immunoblotting with anti-Rac3, anti-VAMP2 and anti-synaptophysin antibodies (Fig. 8). When compared with the total mouse brain homogenate (Fig. 8, lane H), a smaller fraction of Rac3 was recovered in the crude synaptosomal fraction with respect to VAMP2 and synaptophysin (Fig. 8, lane P2′). By contrast, Rac3 showed the strongest enrichment in the high-speed pellet P3, when compared with both synaptosomal markers. The ratio between the amounts of protein recovered in P3 vs. P2′ was 1.5 for VAMP2, 1.7 for synaptophysin and 9.9 for Rac3. This gives a 6.6-fold enrichment of Rac3 in P3 compared with VAMP2. These data show that Rac3 behaves differently from the presynaptic markers VAMP2 and synaptophysin upon cell fractionation, and that Rac3 is enriched in a fraction distinguishable from synaptosomes.
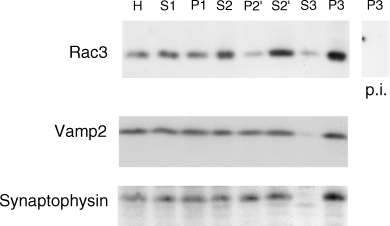
Rac3 is enriched in a non-synaptosomal membrane fraction. P7 mouse brains were homogenized and fractionated as described in the Methods. Then, 150 µg of protein from each fraction were used for SDS-PAGE and immunoblotting. The filter was divided into three parts, incubated with the anti-Rac3 pAb (upper panel), anti-VAMP2 mAb (middle panel) and anti-synaptophysin mAb (lower panel), respectively. The last lane to the right of the upper panel was incubated with anti-Rac3 pre-immune serum. H, homogenate; S1 = supernatant and P1 = pellet, obtained after centrifugation at 800 g. S2 = supernatant from the first centrifugation at 10 000 g. P2′ = crude synaptosomal fraction, obtained after the two centrifugations at 10 000 g. S2′ = supernatant after the second centrifugation at 10 000 g. P3 = pellet and S3 = supernatant, obtained after centrifugation at 120 000 g.
Discussion
Three distinct Rac genes with a high degree of similarity have been identified in mammals. Rac1 is a ubiquitous GTPase, and its knock out results in early embryonic lethality (Sugihara et al., 1998). Rac1(−/−) embryos remain small and spherical, without developing embryonic axes, thus indicating a drastic disturbance in early developmental events. Rac2 is a haematopoietic cell-specific GTPase, and its deficiency is characterized by abnormalities in neutrophil function and host defence (Roberts et al., 1999). Rac3 is the least characterized Rac. Its transcript is expressed in a developmentally regulated fashion during avian neural development (Malosio et al., 1997). The highest levels of Rac3 mRNA in human tissues were found in the brain (Haataja et al., 1997).
The greatest divergence between Rac3 and Rac1 occurs at residues 180–192, which include the hypervariable region (Barbacid, 1987), and the carboxyterminal site for isoprenylation (Kinsella et al., 1991). This region may be important for the specific intracellular localization and for the interaction with specific target proteins (Ando et al., 1992; Chou & Blenis, 1996). Data in the literature indicate the existence of Rac3 regulators and/or effectors that may specifically affect the activity of this protein (Mira et al., 2000; Haataja et al., 2002). By raising antibodies against the carboxyterminal region of Rac3, we have been able to obtain Rac3-specific antibodies. This has allowed us to detect the endogenous Rac3 polypeptide, to show that the expression of Rac3 is specific and developmentally regulated in the mouse brain, and to analyse its distribution during neural development.
Comparison between the distributions of Rac1 and Rac3 by immunohistochemistry and confocal analysis has allowed us to draw the following important conclusions: in contrast to the ubiquitous Rac1, Rac3 shows a developmentally regulated and restricted distribution during mammalian brain development; the subcellular localization of Rac3 has a characteristic pattern in the regions where both GTPases are expressed; comparison with several markers has shown that in P7 brains, when the expression of the Rac3 protein is highest, the distribution of this GTPase strikingly overlaps with that of F-actin, and with Purkinje cell axonal branches within the DCN.
The comparison between Rac1 and Rac3 shows for the first time clear-cut differences between the distributions of these two highly related Rac GTPases in vivo. In the brain, we found that Rac1 is ubiquitously present at all tested developmental stages, whereas a clear signal for Rac3 can be detected immunohistochemically starting from E18. This implies distinct roles of these two proteins in specific areas of the developing brain.
The mouse cerebellum undergoes extensive postnatal development (Wang & Zoghbi, 2001). In particular, Purkinje cells continue their maturation after birth, projecting to the deep cerebellar nuclei, where it has been estimated that their axons will form 70–80% of the synapses found around the DCN cell bodies (Roffler-Tarlov et al., 1979). At P7, synaptogenesis has already started around DCN neurons (Garin & Escher, 2001). The specific co-localization of Rac3 with calbindin-positive axonal branches supports a role of this GTPase in Purkinje cell axonal navigation around the target, for the formation of new synapses. Interestingly, no Rac3 could be detected in the somatodendritic compartment of P7 Purkinje cells, nor along their axonal tracts running towards the DCN. Given the co-localization of Rac3 with F-actin at pericellular sites, these findings are consistent with a specific role of Rac3 in regulating actin dynamics at axonal terminals. The lack of evident co-localization of Rac3 with neurofilament-positive axons within the DCN indicates that Rac3 specifically localizes at the terminal branches of axons, where F-actin is concentrated. Although no evident colocalization between Rac3 and the tested presynaptic markers could be observed, the actin-rich, Rac3-positive structures may represent precursors of developing future presynaptic contacts. Rac3 shows the same pattern of distribution in the pons, where no calbindin-positive axons are present. This suggests that Rac3 has similar functions in these two regions of the brain.
Most studies dealing with neuronal development have focused primarily on Rac1. By contrast, our results suggest that some of the effects attributed to Rac1 in the vertebrate neuronal systems analysed (Luo, 2000) may be due to Rac3. As elegantly shown in Caenorabditis elegans, the expression of activating mutants of the Rho family GTPases may lead to phenotypes that do not reflect the function of the GTPase in the wild-type animal (Zipkin et al., 1997). In the cerebellum, it has been shown that transgenic mice expressing a constitutively active form of Rac1 in Purkinje cells are ataxic, and show a reduction in the number of Purkinje cell axon terminals around their target neurons in the DCN (Luo et al., 1996). From the data shown here it is reasonable to hypothesize that interference with the function of the endogenous Rac3 may be responsible for at least some of the effects observed in these transgenic mice.
In conclusion, this study brings forward Rac3 as a fundamental player to be considered for the analysis of mammalian neuronal development. Although the mechanisms responsible for the differential localization and the different functions of Rac1 and Rac3 during neuronal development have still to be identified, we have shown here for the first time that Rac3 has a specific and unique distribution in areas of the developing brain expressing both GTPases. Our findings support the implication of Rac3 in processes important for neuronal maturation in specific regions of the mouse brain.
Acknowledgements
The financial support of Telethon-Italy (Grant no. GGP02190) is gratefully acknowledged. We thank Lorena Za for helping with Northern analysis, Flavia Valtorta, Fabio Benfenati, Carlo Sala and Virginia Lee for providing antibodies specific for synaptic and glial markers, and Jacopo Meldolesi for critical reading of the manuscript.
Abbreviations
-
- DCN
-
- deep cerebellar nuclei
-
- F-actin
-
- filamentous actin
-
- mAb
-
- monoclonbal antibody
-
- pAb
-
- polyclonal antibody.


