Photoreceptor plasticity in reaggregates of embryonic chick retina: rods depend on proximal cones and on tissue organization
Abstract
Plasticity of photoreceptors and their integration into epithelial structures homologous to an outer nuclear layer (ONL), was investigated in embryonic chick retinal cell reaggregates by immunohistochemistry using an antibody specific for red plus green cones (RG-cones) and an antibody for rods. If reaggregates are raised in the presence of pigmented epithelium (RPE), completely reconstructed, stratified retinal spheres are produced, where all rods and cones are integrated into an outer laminar ONL, similar to a normal retina. In the absence of RPE, ‘rosetted’ spheres form which contain internal rosettes homologous to an ONL. Only a minor fraction of cones and rods of ‘rosetted’ spheres are located within rosettes, while a larger fraction is diffusely displaced in nonorganized areas, thus, not contributing to an ONL-like epithelium. In both types of spheres, the total percentage of RG-cones was similar to the in vivo retina, indicating that expression of cones is autonomous. Following cones, after about one day, rods developed only within already existing RG-cone clusters. Thereby, the ratio of rods to RG-cones increases as the tissue organization decreases: for stratified spheres this ratio is, 0.50 (1 rod/2 cones; similar to mature retina); for rosettes, 0.74 (3 rods/4 cones) and for nonorganized areas, 1.09 (1 rod/1 cone) – a higher ratio under our conditions has never been detected. Thus, rod expression depends strictly on the presence of nearby cones; their relative numbers are distinctively adjusted according to the cytoarchitecture of the tissue environment. The biomedical implications of these findings are briefly discussed.
Introduction
Cell specification during retinal development results from interactions of both intrinsic and extrinsic determinants, and depends on cell lineage and on external signals, such as soluble factors and local cell–cell interactions (for review see Adler, 1993; Cepko, 1999; see Discussion). The specification of cells into photoreceptors is a major model for such investigations; one reason being the ordered spatial arrangement of photoreceptors in the ONL, whereby the cones in some vertebrates are arranged orderly in a lattice (Engström, 1958; Morris, 1970; Marc & Sperling, 1977; Raymond et al., 1993; Roorda & Williams, 1999). In avians, all photoreceptors include one type of rod, a double cone (comprised of a principal and an accessory cone) and four types of single cones (red, green, blue, violet). Precise data on the spatio-temporal occurrence of photoreceptor types in birds are scarce.
How are rods and cones specified and how do they find their appropriate position within the ONL, i.e. how is an ONL constructed? If local cellular interactions regulate cell fate (see above), then, the cytoarchitectural integration of photoreceptors within a three-dimensional tissue context could be decisive, since it would determine cell–cell contacts and the local availability of growth factors. While differentiation of cones is considered to be cell-autonomous, rods appear to be more plastic, i.e. in low density monolayer cell cultures, up to 40 percent of all cells can turn into rods, an extremely high ratio far from the normal situation (Adler, 1993). The plasticity of photoreceptors has not been previously investigated in a three-dimensional tissue context, since most in vitro studies used monolayer cell cultures, which are not suitable for comparing different types of tissue organization. Reaggregation culture systems as introduced by Moscona, (1961) are most useful in this respect. Given the right conditions, dispersed retinal cells of the chicken embryo assemble and develop into three-dimensional cellular spheres (‘retinospheres’) with retinotypic tissue architecture. Depending on the applied culture conditions (Vollmer et al., 1984; Rothermel et al., 1997), stratified or ‘rosetted’ spheres can be produced, exhibiting three defined levels of tissue organization (see Fig. 1). The characterization of their histological structure has been described elsewhere (for review see Layer & Willbold, 1994; Layer et al., 1997; Willbold & Layer, 1998). Stratified spheres consist of an organized retinal tissue (‘laminar’), comparable to a normal retina. They are raised in the presence of pigmented epithelium cells (RPE), media conditioned by RPE (Rothermel et al., 1997) or by Müller–glia cells (Willbold et al. 2000). In these cases, all retinal layers are established with correct orientation (Fig. 1, right). In contrast, ‘rosetted’ spheres represent complex composites of two differently structured regions, i.e. partly organized (‘rosette’) and nonorganized (‘diffuse’) areas (Fig. 1, left). Partly organized areas consist of rosettes, their internal lumen lined with photoreceptors, thus, corresponding to the outer nuclear layer (ONL) of a normal retina. Each rosette is surrounded by a circular outer plexiform layer (OPL), followed by sectors of an inner nuclear layer (INL). Finally, nonorganized areas contain a random agglomerate of most retinal cell types, devoid of histotypical lamination.
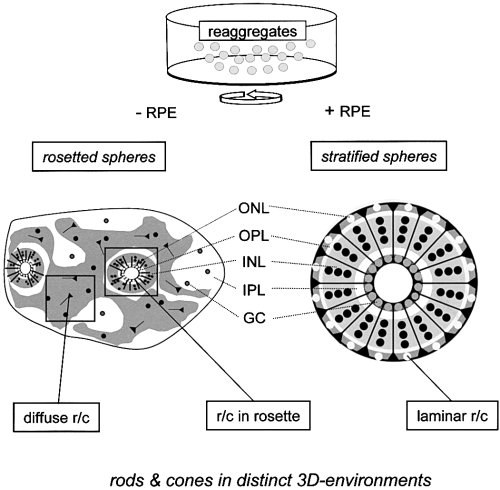
Photoreceptors in ‘rosetted’ (left) and stratified spheres (right) are found at three levels of tissue organization. ‘rosetted’ spheres develop from dissociated retinal cells only, while stratified spheres develop in the presence of RPE. Stratified spheres represent a completely reconstituted tissue comprised of all retinal layers (lower right). Like in a normal retina, all photoreceptors (r/c, rods and cones) are integrated within a regular ONL (laminar r/c). In contrast, photoreceptors in ‘rosetted’ spheres are found within two structurally different areas (lower left); diffuse r/c are randomly arranged, while r/c in rosettes are organized within epithelial rosettes homologous to an inverted ONL (cf. 2, 4, 5). GC, ganglion cells; INL, inner nuclear layer; IPL, inner plexiform layer; ONL, outer nuclear layer; OPL, outer plexiform layer; RPE, retinal pigmented epithelium.
In the present study, we analysed the plasticity of rods and cones at three decreasing levels of retinal tissue organization and compared the results with the retina in vivo. The findings are most instructive on the question of photoreceptor lineages, and of the constraints of laminar tissue reorganization.
Materials and methods
Preparation of retinosphere cultures
To produce retinospheres, retinae of 5-day-old chicken embryos were used (for details see Rothermel et al., 1997; Willbold & Layer, 1998). Briefly, central parts of the isolated retinae were dissociated by tryptic digestion and mechanical trituration. To obtain stratified spheres, 2 × 10⁶ cells/mL were cultivated in 35 mm dishes containing 1.8 mL aggregation medium (DMEM plus 10% foetal calf serum, 2% chicken serum, 0.1% penicillin/streptomycin, 0.02 mg/ml gentamycin and 2 mm l-glutamine) plus 200 µL of retinal pigmented epithelium-conditioned medium (RPE-CM; supernatants of RPE-cells cultivated for 4 days in aggregation medium) for up to two weeks on a gyratory shaker (75 r.p.m., 2.5 cm rocker radius) at 37 °C, 95% air and 5% CO2. After two days, the RPE-CM containing medium was removed and replaced by 2 mL aggregation medium without RPE-CM throughout the rest of the experiment. The medium was changed every other day. To raise ‘rosetted’ spheres, we used the same procedure described for stratified spheres but without the addition of RPE-CM.
Cryosections and immunostaining procedures
For cryosections, eyes and retinospheres were harvested at appropriate stages (see figures). Eyes were fixed in phosphate-buffered saline (PBS) containing 4% formaldehyde for 24 h at 4 °C, whereas retinospheres were fixed for only 30 min at room temperature. After removing the fixative and after two washes in PBS, both types of tissue were soaked in 25% sucrose (in PBS) and stored at 4 °C. Then, frozen sections of 10–16-µm thickness were cut on a cryostat (Microm, Walldorf, Germany), mounted on gelatine-coated slides and stored for immunostaining at −20 °C. For immunostaining, sections were dried at 37 °C and preincubated with a blocking solution (3% bovine serum albumin (BSA), 0.1% Triton-X-100 in PBS) for 30 min at room temperature. Then, the tissues were incubated with the primary antibody (see below), followed by three washes in PBS. For detection of the primary antibodies, either goat anti-rabbit or donkey anti-mouse-conjugated-Cy3 secondary antibodies (Dianova, Hamburg, Germany) were used for 1 h at a dilution of 1 : 100 in PBST (PBS plus 0.1% Triton). In between the last two washes, cell nuclei were stained with DAPI (0.1 mg/mL 4′,6-diamidine-2-phenylindol-dihydrochloride in PBS, Boehringer Mannheim, Germany). Finally, sections were dried and embedded in Mowiol (Sigma, Deisenhofen, Germany). For double-labelling experiments, the monoclonal and polyclonal primary antibodies were incubated together for 1 h. To distinguish between the primary antibodies, we used two different secondary antibodies conjugated either to Cy2 or Cy3 (Dianova, Hamburg, Germany).
Primary antibodies
To distinguish between the different types of photoreceptors, we used a monoclonal and two polyclonal antibodies. The monoclonal antibody rho4D2 (generous gift from Dr D. Hicks, Strasbourg) is highly specific for rods in several species (Molday, 1989; Burga et al., 1992). Under our staining conditions, the antibody rho4D2 detected exclusively rods in the chicken retina. Alternatively, we could detect rods by using the antibody CERN901, which was raised against purified chicken rhodopsin (for detail see Schalken et al., 1990). CERN906 was raised against purified chicken red and green opsins. It is highly specific for these visual pigments as revealed by Western blot analysis (pers. communication; Foster et al., 1991; García-Fernández et al., 1997). The primary antibodies were all used at a dilution of 1 : 2000 in PBST (PBS/0.1% Triton-X-100) and were incubated for 1 h at room temperature.
Cell counting and statistical analysis
To determine the number of photoreceptors, frozen sections were stained with DAPI and the appropriate anti-opsin antibodies. Three different sections (each containing multiple spheroids) of two separate experiments (number of investigated spheroids n = 9) were analysed. This corresponds to counting of 4000–5000 cells per stage and staining. Data are presented as means ± SD and compared by using a two-tailed, paired student's t-test.
Microscopy and photography
Photomicrographs of sections were taken with a Zeiss Axiophot equipped with epifluorescence and Nomarski-optics. The films used were Kodak Tmax 400 and Fujichrom 400. Negatives and colour slides (35 mm) were scanned, processed with Adobe Photoshop and printed using either a digital Mitsubishi photoprinter or a HP-Deskjet 970 Cxi. Figure 2E and F was taken with a CCD-3 digital camera (Intas focus imager 4000, Göttingen, Germany) and images were processed with ‘Photoimpact-5’ software.
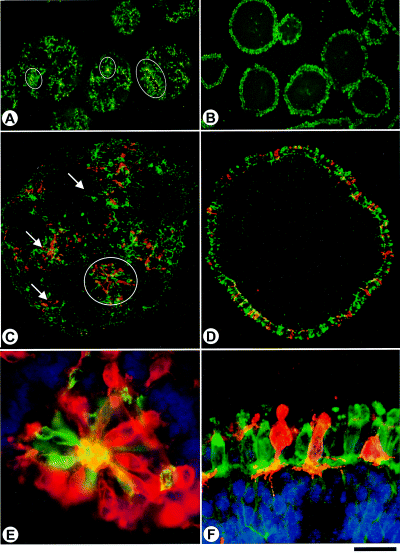
Rods (red) and RG-cones (green) in ‘rosetted’ (A, C and E) and stratified spheres (B, D and F). Cryosections were labelled with CERN906 (specific for red and green cones; green in A–F) and with rho4D2 (specific for rods; red in C–F; note yellow colour appears on sites of cellular overlap). (A, C and E) In ‘rosetted’ spheres, photoreceptors are either orderly arranged within concentric layers of cells (rosette r/c; circles in A and C), or they are randomly distributed in nonorganized areas (diffuse r/c; arrows in C). (B, D and F) In stratified spheres, photoreceptors are restricted to the periphery composing a regular ONL (laminar r/c). Note, that the number of rods (red) is lower when compared with the number of cones (green), also note close vicinity of rods to cone clusters. Pedicles reaching into OPL and INL are discernible (F). Culture period was 10 days. Bar, 300 µm (A, B); 100 µm (C, D); 25 µm (E, F).
Results
We have studied by immunocytochemistry the spatial pattern, the temporal course and the ratios of photoreceptors occurring in ‘rosetted’ and stratified spheres. The antibodies used in this study allow to distinguish rods from the majority of cones, since RG-cones represent 65–80% of all cones in the chick retina.
Differentiation patterns of photoreceptors in retinal spheres: cones are tissue-independent, while rods follow in close proximity
Differentiation of rods and cones is readily detectable in both types of spheres (2-5). Stratified spheres are laminated spheres, whereby photoreceptor development is exclusively restricted to the outermost layer of cells (laminar rods/cones; Fig. 2B, D and F). Pedicles of both rods and RG-cones protrude into the OPL (2, 3). The first immunoreactive RG-cones, detectable at six days in culture (i.c.) (Fig. 6C, Table 1) were arranged in isolated cell clusters on the surface of the sphere (Fig. 3A and C, brackets). These clusters were separated by immuno-negative cells (Fig. 3A and C). They increased in number, expanding laterally to finally form a continuous ONL after thirteen days i.c. (Fig. 3E). Consistently, rod photoreceptors were delayed by one day (Fig. 6C) and developed only within cone-containing regions (Fig. 3, brackets in A–D). After about two weeks in vitro, all photoreceptors were present (2, 3).
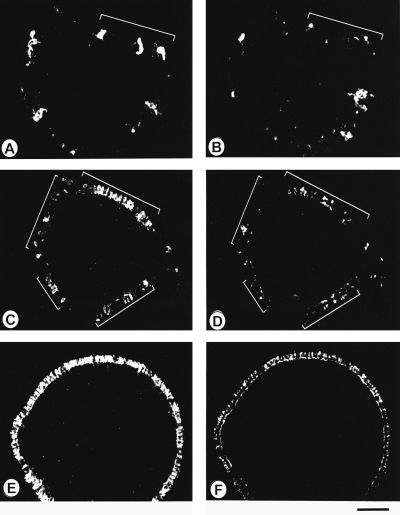
Rods develop exclusively in the vicinity of differentiating cones. Cryosections of stratified spheres were double-labelled with CERN906 (red and green cones; A, C and E; equiv. to 7, 9, 13 days in vitro, respectively), and with rho4D2 (rods; B, D and F). Rods develop only in regions where cones are already present (cf. brackets in A–D). As development proceeds, groups of both types of photoreceptors expand laterally and finally occupy the entire peripheral edge of stratified spheres. Bar, 50 µm (A–B); 100 µm (C–F).
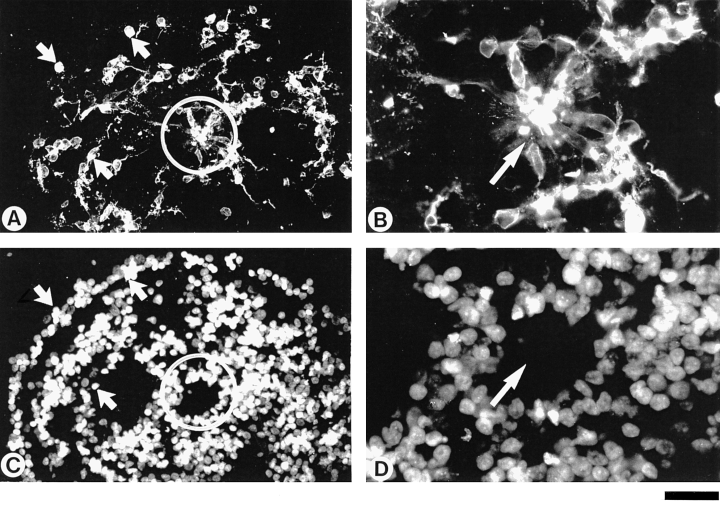
Rods in non-organized (diffuse) and in partly organized (rosette) areas of ‘rosetted’ spheroids. Cryosections of ‘rosetted’ spheroids after 10 days i.c. were double-labelled with the antibody CERN901 (rods; A–B) and with DAPI (cell nuclei; C–D). (A) A rosette (circle) holds rod photoreceptors (elongated cell bodies), whereas in nonorganized areas, the rods are randomly distributed (arrows), presenting round or elliptical morphology with one or more processes. (B) Enlargement of A; within the rim of rod photoreceptors, the outer segments (arrow pointing to the centre) are strongly immuno-labelled. Bar, 50 µm (A and C); 20 µm (B and D).
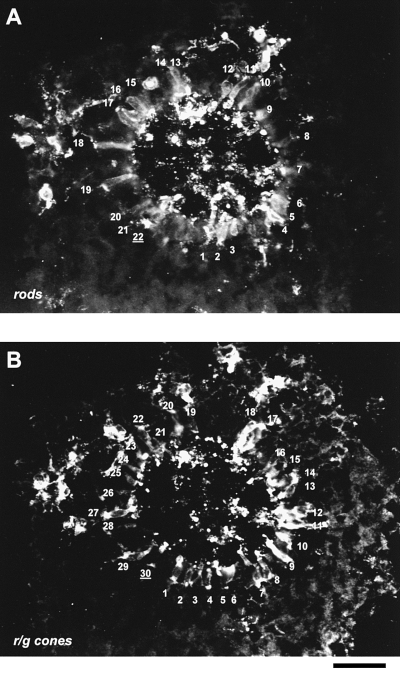
Arrangement and quantification of rods and RG-cones within one rosette. (A) Cryosection of a 13-day-old ‘rosetted’ spheroid was double-stained with the CERN906 and rho4D2 antibodies. Rods (A) and RG-cones (B) were individually labelled; here, a ratio of rods to cones of 0.74 emerges. Note material of outer segments is sectioned in the centre of the rosette. Bar, 50 µm.
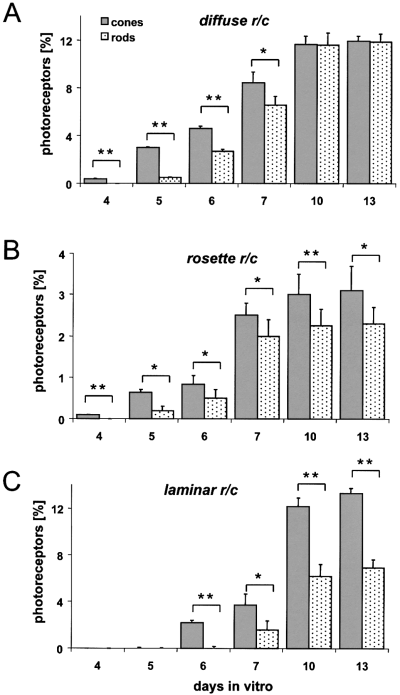
Photoreceptor development at three tissue levels. Cryosections of ‘rosetted’ (A and B) and stratified spheres (C) were double-labelled with antibodies CERN 906 (RG-cones) and rho4D2 (rods); cell nuclei were stained with DAPI. Percentage of opsin-positive cells in relation to DAPI-stained cells is determined in diffuse areas (A), in rosettes (B) and in stratified spheres (C). Note that photoreceptors develop earlier in ‘rosetted’ (A and B) than in stratified spheres (C). In all cases, rods develop after cones. Thereby, in diffuse tissue (A) the number of rods and cones after 13 days i.c. are about equal; in rosettes (B) the ratio of rods to cones is lower, while in laminar ONL (C) the ratio of rods to cones is reduced to almost half (cf. Figure 7). Note total ratio of photoreceptors in rosettes is low. y-axis gives percentage of photoreceptors per total number of cells in whole spheres. The experiment was repeated twice with similar results. Each data point represents the mean + SD of multiple spheroids (n = 9; number of investigated spheroids). *P < 0.01, **P < 0.001.
| Days invitro | Percentage rods and RG-cones in relation to all DAPI-stained cells within the respective sphere | |||||
|---|---|---|---|---|---|---|
| Diffuse rods and cones (nonorganized) | Rods and cones in rosettes (partly organized) | Laminar rods and cones (completely organized) | ||||
| RG-cones (%) | Rods (%) | RG-cones (%) | Rods (%) | RG-cones (%) | Rods (%) | |
| 1 | 0.0 | 0.0 | 0.0 | 0.0 | 0.0 | 0.0 |
| 2 | 0.0 | 0.0 | 0.0 | 0.0 | 0.0 | 0.0 |
| 3 | 0.0 | 0.0 | 0.0 | 0.0 | 0.0 | 0.0 |
| 4 | 0.4 ± 0.02 | 0.0 | 0.1 ± 0.02 | 0.0 | 0.0 | 0.0 |
| 5 | 3.0 ± 0.10 | 0.5 ± 0.03 | 0.6 ± 0.07 | 0.2 ± 0.10 | 0.0 | 0.0 |
| 6 | 4.6 ± 0.20 | 2.7 ± 0.20 | 0.8 ± 0.20 | 0.5 ± 0.20 | 2.2 ± 0.10 | 0.0 |
| 7 | 8.4 ± 1.00 | 6.5 ± 0.80 | 2.5 ± 0.20 | 2.0 ± 0.30 | 3.7 ± 0.50 | 1.6 ± 0.30 |
| 10 | 11.6 ± 0.70 | 11.6 ± 1.00 | 3.0 ± 0.40 | 2.3 ± 0.30 | 12.2 ± 0.50 | 6.2 ± 0.40 |
| 13 | 11.9 ± 0.40 | 11.8 ± 0.70 | 3.1 ± 0.50 | 2.3 ± 0.30 | 13.3 ± 0.80 | 6.9 ± 0.80 |
- The table gives the data represented by Fig. 6. Percentages of rods and of RG-cones were determined in diffuse areas, in rosettes and in stratified spheres (laminar).
‘Rosetted’ spheres appear less organized (Fig. 2A for overview, Fig. 2C and E for details). In ten-day-old ‘rosetted’ spheres, a minor fraction of photoreceptors are detected within rosettes (Fig. 2A and C, circles; Figs 2E and 4A–B), while the majority are located in nonorganized areas outside of rosettes (Fig. 2C, arrows; Fig. 4; Table 1). Photoreceptors within rosettes (rosette rods/cones) constitute a cell layer cytologically similar to a normal ONL. Their morphology is depicted in 2, 4. Outer membranes of cell bodies are stained, but more pronounced staining is seen within the inner spaces of rosettes (cf. 2, 4), indicating formation of outer segments, previously detected by electron microscopy (Sheffield & Moscona, 1970; Wolburg et al., 1991). Processes (pedicles) which project laterally, indicate formation of an OPL (Fig. 4B). In contrast to this, photoreceptors in nonorganized areas (diffuse rods/cones) of ‘rosetted’ spheres are located randomly (arrows Fig. 2C). They are mostly round or elliptical, and present one or more processes (Fig. 4A, arrows).
A close spatio-temporal dependency of rod development on cones was found in both rosettes and in nonorganized areas of ‘rosetted’ spheres (Figs 2C and E,and 6A and B). All detectable rods were consistently surrounded by cones, whereas other areas were occupied exclusively by cones (Fig. 2E). This is also the case for rods which develop in stratified spheroids (Fig. 2D and F). Thus, rods develop only in areas where cone development had already commenced. In Fig. 6, the developmental course of rods and cones in relation to all DAPI-stained cells was determined for all three histological situations. In both rosettes and nonorganized areas of ‘rosetted’ spheres immunoreactive RG-cones appeared after four days in culture; it should be noted, however, that expression is first consistently detectable in nonorganized areas (Fig. 6A). In contrast, in stratified spheres cone development could be detected only at six days i.c. (Fig. 6C). Consistently, cone development sets in approximately 12–24 h before immunoreactive rods could be detected. In summary, these findings support the notion that rod development follows that of RG-cones, irrespective of the particular histological tissue organization in the spheres. Noticeably, the ratio of cones was independent of the tissue organization (in contrast to rods, see below). Their numbers were similar in both types of reaggregates, accounting for about 15% in ‘rosetted’ spheres and 13.3% in stratified spheres (Table 1), both numbers being somewhat lower than at a central location of a mature retina. It is noteworthy, however, that in ‘rosetted’ spheres, only a small percentage of rods and RG-cones are found within rosettes, whereas many more are located in nonorganized areas (cf. Figs 2A and C,and 6, Table 1). Taking into account all cells within ‘rosetted’ and stratified spheres, the ratio of RG-cones is tissue-independent.
Discrete steps of rod expression at three levels of tissue organization
The ratios of rods to RG-cones was determined on sections of both types of spheres and compared with that of the in vivo retina. Surprisingly, for each type considered, a distinctive and nearly even ratio was revealed (Fig. 7). In stratified spheres, where all photoreceptors are confined to a morphologically regular ONL, the ratio of rods to RG-cones was found similar to the normal adult retina. From their first appearance until thirteen days in culture, the rate of RG-cones increased to approximately 13% of all cells (Fig. 6C, Table 1). The number of rods remained at half this value, accounting for somewhat less than 7%. Thus, the ratio between rods and RG-cones turned out to be close to 0.5. In the ONL, of the stratified spheres, resides one rod per two RG-cones. This ratio is higher than in the centre of a normal adult retina (which is 0.3; Fig. 7); nevertheless, it comes close to the overall ratio in a mature retina, since in peripheral retina the ratio of rods to cones is higher.
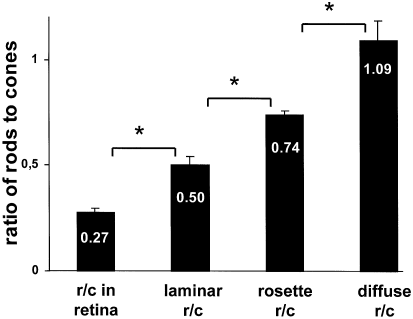
Rod to cone ratio increases as the degree of tissue organization decreases. Cryosections of mature stages of ‘rosetted’, of stratified spheres (13 days i.c.) and of embryonic chicken retinae (E20; central region) were double-labelled with the rod specific antibody rho4D2 and the RG-cone specific antibody CERN906. Ratios of rods to cones turned out to be 1.1 in diffuse areas, 0.74 in rosettes, and 0.5 in laminated areas, compared with a factor of 0.27 in the mature normal retina. Note that these ratios correspond closely to natural fractions of 1/1; 3/4; 1/2; 1/3, indicating distinct lineage relationships at each level of tissue organization. For statistics cf. Fig. 6.
In rosettes, the ratio of rods to cones is higher than in stratified spheres. After the appearance of cones in rosettes at day four i.c., followed a day later by rods (Fig. 6B, Table 1), their ratios increased during the next six days to a steady state by day ten. Significantly, at each time point, the number of rods was slightly lower than that of RG-cones. By day thirteen, 3% of all the cells within a sphere were rosette-located RG-cones and 2.3% were rods. This accounts for a rod/RG-cone ratio in rosettes of 0.74 (Fig. 7; for quantification see Fig. 5), equivalent to three rods per four RG-cones.
Finally, in nonorganized areas of ‘rosetted’ spheres, by far the highest ratio of rods to cones is reached in all three tested tissue environments. While at day five, cones still constituted the large majority of photoreceptors, this relation changed during the next five days (Fig. 6A, Table 1). After ten days i.c., the percentage of rods (11.8%) closely matches that of RG-cones (11.9%). This compares with only 2.3% of rods within rosettes and 6.9% in stratified spheres. Thus, in nonorganized areas of ‘rosetted’ spheres, the ratio of rods to RG-cones was 1.0, corresponding to one rod per one RG-cone. Remarkably, in our systems, we never could detect a higher ratio than one rod to one cone.
Discussion
With this study, retinal spheres have been used as models to analyze the plasticity of photoreceptor determination. To our knowledge, this is the first study using defined three-dimensional levels of tissue organization to unravel the plasticity of rod expression. Four major findings come out of this study: (i) cones precede rods during in vitro development; (ii) in both types of spheres, the total number of RG-cones is similar, but in ‘rosetted’ spheres, many of them are not integrated into an ONL; (iii) the ratio of rods to cones increases as tissue organization decreases and (iv) the ratio achieved at each level represents a value close to the natural fractions of 1/1 (diffuse rods/cones), 3/4 (rosette rods/cones), 1/2 (laminar rods/cones) and 1/3 (rods/cones in central mature retina). This indicates that the rod lineage(s) depend closely on the cone lineage, but – since the ratios differ in different environments – depends also on other determinants of the given three-dimensional structure.
These findings extend our understanding of photoreceptor determination. Monolayer experiments had revealed that rod differentiation depends on environmental factors, e.g. in low density cultures the numbers of rods was lowered (Sparrow et al., 1990; Altshuler & Cepko, 1992; Harris & Messersmith, 1992; Reh, 1992). Conversely, the number of rods increased by 40-fold in cocultures with postnatal retinal cells (Watanabe & Raff, 1992). Rod differentiation in vitro is also strongly influenced by growth factors (Anchan et al., 1991; Adler, 1993; Mack & Fernald, 1993; Kelly et al., 1994; Lillien, 1995; Araki, 1997; Levine et al., 1997; Kirsch et al., 1998). Some of these factors are possibly produced by amacrine or ganglion cells (Reh, 1992; Cepko, 1999). However, in these earlier studies the significance of particular tissue architecture was not considered. Using spheres, we could directly investigate how different three-dimensional cell organizations influence rod development.
Cone expression is independent of environment and precedes rods
The total ratio of RG-cones is similar in both ‘rosetted’ (11.9% + 3.1%) and in stratified spheres (13.3%); in both cases, this approaches the in vivo ratio. The expression of RG-cones consistently preceded that of rods. Both findings support the view, that determination of avian cones is cell-autonomous. In contrast, rod development was highly plastic, depending both on the presence of nearby cones and the given tissue organization. The total ratio of rods to cones is much higher in ‘rosetted’ spheres (11.8% diffusely outside, plus 2–3% within rosettes), compared with 6.9% in stratified spheres. Clearly, the vast majority of rods in ‘rosetted’ spheres are located in nonorganized areas. In no case could we detect rods preceding cones, as described for teleost fish (Stenkamp et al., 1996) or the rat (Morrow et al., 1998). Therefore, it is unlikely that there exists a cell-autonomous early period of rod expression in avian retina. Rods in nonorganized areas are mostly round or elliptical, presenting one or more processes, similar to that which has been found in monolayer cultures (Araki et al., 1990). It is remarkable that, in several retinal dystrophies, rods degenerate before cones. Thereby, the death of cones could be a consequence of the unavailability of rod-derived factors (Hicks & Sahel, 2000). Spheres should allow to directly test the interdependence of cone and rod development and degeneration.
How many rods and cones for an orderly ONL?
In both ‘rosetted’ and in stratified spheres, epithelial cell layers closely resembling a normal ONL are established. Before being integrated into an epithelium, the very first cones are always found in nonorganized areas (cf. Fig. 6A). It remains a fascinating issue, why then not all cones and rods find a place within rosettes. Apparently, the access of cones into forming rosettes is limited (e.g. spatial restrictions, availability of growth factors, etc., see below). Similarly, the number of rods to be integrated into an ONL-like structure is also limited, but it is significantly higher than in stratified spheres. The ratios of rods/cones in the ONLs of rosettes and of stratified spheres were different, both were, again, higher than in the central retina. The relative density of cones is highest within the retina (Walls, 1942; Engström, 1958). Concerning the question whether and how a rosette can be turned into a laminar ONL, it is noteworthy that in malformations, such as retinoblastoma, or in retinal transplants (Aramant et al., 1999; Ghosh & Ehinger, 2000), the tissue undergoes laminar distortions that lead either to the appearance of rosettes, or to a complete disintegration of the three-dimensional cytoarchitecture, similar to the situation prevailing in monolayer culture. Our results indicate that as retinal cells do not find a proper place within an organized tissue, the ratio of rods to cones increases; one way of interpreting this could be that rods develop according to a default pathway (Adler & Hatlee, 1989).
Even ratios between rods and RG-cones?
To us it seems more than coincidental that in four different situations the ratio of rods to cones in each case comes close to a fraction of even numbers. This suggests that cones not only control rod differentiation, but they ‘numerically’ control them. Most clearly so, in nonorganized areas, rods reach approximately the same percentage as their neighbouring cones, but never more under our culture conditions (cf. Watanabe & Raff, 1992). On the other side, in stratified spheres only half as many rods are produced; all of them are fully integrated within the laminar ONL, none of the cones or rods are misplaced. These findings indicate that at each tissue level precisely one and only one rod/RG-cone ratio will be established. Rod development decisively depends upon cones in a given tissue environment. The cones, together with the histological organization, dictate how many rods are induced. Noticeably, the formation of a coherent ONL depends on constraints other than only rod and cone cell numbers. With future experiments, the developmental dependence, not only of photoreceptors, but also that of other retinal cell types on their three-dimensional tissue environment can be analysed. Thus, retinal spheres as experimental model systems are most useful to analyse the developmental constraints for constructing a retinal cellular network.
Acknowledgements
This work was supported by the Deutsche Forschungsgemeinschaft (SFB 269/A2, B3, La 379–12), Human Capital & Mobility (HCM) and German Israeli Foundation (G.I.F., 512/96). We thank W. deGrip and D. Hicks for providing antibodies, A.A. Moscona for critically reading an earlier version of the manuscript, and L. Martinez-Millan, A. Robitzki, T. Saito and E. Willbold for helpful discussions. We would like to acknowledge the expert technical assistance by J. Huhn-Smidek.
Abbreviations
-
- DAPI
-
- 4′,6-diamidine-2-phenylindol-dihydrochloride
-
- i.c.
-
- in culture
-
- INL
-
- inner nuclear layer
-
- OPL
-
- outer plexiform layer
-
- ONL
-
- outer nuclear layer
-
- r/c
-
- rods and cones
-
- RG-cones
-
- population of red and green cones
-
- RPE
-
- retinal pigmented epithelium, RPE-CM, RPE-conditioned medium.


