Numerical simulation of domestic wastewater sewer performance
†Address for correspondence.
Abstract
The hydraulics of municipal sewers were considered with respect to flow rate fluctuations that sometimes cause accumulation and sometimes cause scouring of the sediments. The minimal slopes that would ensure self-cleaning conditions once a day and the required capacity for the yearly maximum peak flows were calculated. The range of fluctuations in shear stresses along the sewer walls and in the wastewater table were observed and compared for sewers of different diameters. From these computations a simple design rule for predicting minimal slopes was developed.
INTRODUCTION
Sediment accumulation within sewer systems and corrosion problems due to hydrogen sulfate emission from slimes are often recognised as creating serious maintenance problems. Moreover, deposits that have accumulated within a combined sewer can be flushed out during storms and transported to overflows, contributing significantly to the total discharge of pollution into nearby watersheds ( Ashley & Dąbrowski 1995; Ashley et al. 1992 ). To control both the destructive impact of deposits on sewer systems and the unwanted pollution discharge into surface waters, minimum slopes for wastewater sewers have been specified in various codes of practice. Unfortunately, in most countries these slopes are still based on a given value for a minimum flow velocity that is sometimes defined for the full pipe flow and sometimes for a daily peak flow rate. Modern laboratory investigations confirm that both the critical velocities that initiate deposit erosion ( Novak & Nalluri 1975) and the self-cleaning velocities that ensure transportation of all particulate matter ( Ghani 1993) depend on hydraulic radius, which is a function of the sewer diameter and flow depth. The idea of incorporating a hydraulic radius into required minimum flow velocity calculations was strongly supported by Nalluri and Dąbrowski (1994), who pointed out the inadequacy of the self-cleaning velocity criteria for full pipe flow when applied to sewers of flow depths much less than half of their cross-sectional height. Another modern approach to minimum sewer slopes is based on the required average shear stresses between waste water and the inside surface of the sewer wall. In summary, several approaches to minimum sewer slopes can be taken, including:
1. Required minimum flow velocity for a full-pipe flow.
2. Required minimum flow velocity for a part-height flow.
3. Required self-cleaning or critical velocity as a function of a hydraulic radius.
4. Required shear stress on the inside sewer wall surface when in direct contact with the waste water.
It is important to remember that this shear stress is not distributed homogeneously along the wet perimeter. Usually, minimum sewer slopes are predicted for extreme situations, such as full pipe flows or the highest or the lowest flow rates. The present paper shows how to predict minimum sewer slopes to ensure self-cleaning conditions for flow varying periodically over a given period of time.
METHODS
Waste water loading data
Most organic sediments show cohesive properties after several days or a few months. In municipal sewerage systems, shear stress usually ranges from 1.8 up to 2.5 N m–2, which is high enough to avoid serious deposit problems. Some old organic deposits, however, require shear stresses exceeding 2500 N m–2 to be removed from wastewater sewers ( Verbanck et al. 1994 ; Nalluri & Alvarez 1992; Wotherspoon & Ashley 1992), which is many times more than the highest values of the shear stress observed during maximum peak flows through sewer systems ( Wotherspoon & Ashley 1992). This is why reasonable design methods should be used to ensure either a critical velocity or a self-cleaning shear stress occurs regularly enough to avoid any visible cohesion of deposits. In all sewer systems, the flow rates display stochastic patterns and they should be considered in connection with the probability of return. Unfortunately, this probability is unique to each combined and storm sewer and strongly depends on local climate and seasonal variations. Even for separate municipal sewers, there are usually not enough data to evaluate sewer loads by stochastic methods and typical sustained peak mass loadings are better recognised. In municipal separate sewers, however, the hourly flow variation is similar on weekdays. It is assumed now that to ensure a minimum municipal sewer slope, the sewer should be designed in such a way as to fulfil both of the following requirements: (i) it should ensure flow capacity for the yearly peak flow rate; and (ii) it should ensure a self-cleaning shear or critical velocity at least once per typical working day. Based on these two requirements, sanitary sewers have been designed for flow rates rising gradually from 0 to 2 m3 s–1 and then velocities, shear stresses and flow height variations were investigated in these sewers by numerical experiments. To draw general conclusions from the results of calculations, a sewer with an average groundwater infiltration inflow that is constructed for a community of a typical population density is considered. The yearly peak flow and typical working day hourly maximum and minimum peak flow variations that are representative for this sewer system have been assumed to be the same as reported by the US EPA ( WPCF 1960). These peak flows have been used to produce the yearly maximum flow rate and typical working day maximum and minimum flow rates as a function of an average flow rate, as illustrated in Fig. 1.
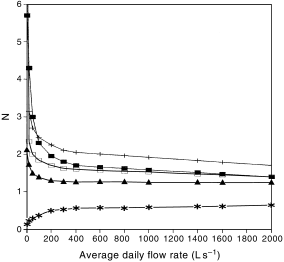
Flow-rate coefficients of non-uniformity according to the US EPA guidelines ( WPCF 1960) and Polish data. US EPA: (▪), Nmax; (+), Nh; (*), Nmin; Polish data: (□), Nh; (▵), Nmax.
Certainly, flow rate fluctuations are first of all a function of average daily flow rates, but they also depend on some individual circumstances such as the density of population, infiltration or exfiltration, discharges from industry and so on. To make general conclusions, it has been assumed that flow rate fluctuations are exclusively a function of the average flow rate. Some data on Nmin, Nh and Nmax are presented in Fig. 1, where Nmax is the ratio of the yearly maximum peak flow Qyear max to an average flow rate Qavr. The value of Nmax is equal to NhNd, where Nd is the ratio of the maximum daily flow rate in a year to the average daily flow rate, and Nh is the ratio of the maximum hourly flow rate to the average hourly flow rate in the day of maximum daily flow rate within a year. Some of the data shown in Fig. 1 are elaborated on by the US EPA ( WCPF 1960), some by the Institute of Environment Development (Poland) and some by the Technical University in Poznán (Western Poland). According to the Polish data, the fluctuations in flow-rate are lower than German guidelines dictate ( DVGW 1993) but are higher than advised by the US EPA. The results of calculations discussed in subsequent paragraphs are based on US EPA and Water Pollution Control Federation guidelines ( WPCF 1960).
Basic equations
The mean shear stress along the wetted perimeter was calculated using the formula:
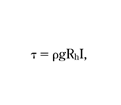
where τ is shear stress (N m–2), ρ is fluid density (kg m–3), g is acceleration due to gravity (m s–2), Rh is hydraulic radius (m) and I is sewer slope. The formula (eqn 1) can be derived from a comparison of the work done by external forces with the loss of the potential energy of the stream. The R (hydraulic radius) value can be calculated from the Manning equation:
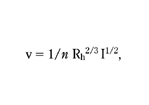
where v is the average flow velocity over the cross-section and n is the Manning roughness coefficient. The application of both equations 1 and 2 should be limited. Equation 1 should be limited to the cases in which both the side-wall effect and energy dissipation from turbulent eddies to thermal energy and noise is negligible and equation 2 to turbulent flows and sewers of moderate roughness ( Dąbrowski & Biedrón 1993). The last condition is fulfilled for the roughness coefficient n = 0.0013 that is assumed for the computations as specified in the Polish codes of practice for concrete sewers in moderate conditions. For circular sewers with no deposit, the side-wall effect is widely neglected in spite of sometimes visibly non-uniform shear stress distribution, with the number of local maxima extremes depending on the number of the secondary flow cells. Not only the Manning equation (eqn 2), but almost all empirical formulae for the hydraulic resistance to flow in sewers do not account for the impact of a thin layer of air when the cross-section is almost full. As a consequence, the computed values of the flow rate (Q) are highest for a water height somewhat lower than the height of a sewer (D). For the circular cross-section and for the Manning equation, this height is equal to 0.95D, which has not been confirmed by most experimental studies. In the calculations presented here, the Manning equation has been applied only for heights lower than or equal to 0.8D, which agrees well with the Imhoff rule of practice, according to which sanitary sewers should operate with sufficient ventilation and not be filled more than 0.8D.
Numerical program
Based on the Polish codes of practice, it was assumed here that municipal wastewater sewer cross-sections and slopes are to be designed to ensure a capacity equal to or greater than the maximum yearly peak-flow rate for a flow height (h) not exceeding 0.8 of the sewer diameter (D). For most days, flow rates in sewers are much lower than the yearly peak value, so shear stresses and flow velocities are smaller, especially during the night. The purpose of the present study was to observe daily fluctuations of the shear stress and the flow velocity in sewers designed for the yearly maximum peak flow. Because of a lack of data concerning the stochastic behaviour of flow rates in municipal sewerage, use has been made of an observation that the flow- fluctuation pattern is usually similar for all working days, which are different from weekends. It was assumed that self-cleaning circumstances have to occur at least once a day to ensure transportation of sediment towards a wastewater treatment plant.
Certainly, the calculations required the development of a numerical programme. The programme allows prediction of a sewer diameter and invert slope for one of the following requirements:
1. For an assumed flow velocity for the full cross-section.
2. For an assumed shear stress value for the full cross-section.
3. For an assumed flow velocity for a cross-section partially filled to the level ensuring an assumed flow rate.
4. For an assumed shear stress for a cross-section partially filled to the level ensuring an assumed flow rate.
5. For a given slope.
Calculations may be carried out for one given value of flow rate (Q), or the effects of altering several parameters may be simulated. Changes in variables such as shear stress, velocity of flow or water table height during an average day may be simulated and visualised on the screen. The parameters investigated may include those characterising resistivity to air flow, as ventilation is important not only for a proper sewer inspection and maintenance but also for corrosion control. In all dynamic simulations, the sewer dimension is calculated to have a capacity equal to or a little higher than required by the yearly peak flow, but the simulation of hydraulic and ventilation parameters refers to an average day.
RESULTS
In Fig. 2, an example of some results is presented for one set of data. In this example, the shear stress in a circular sewer in full-flow conditions was made equal to 1.8 N m–2. Given this, the slopes of circular sewers were calculated and are shown in Fig. 2 as a function of a daily average flow rate. Each time the slope drops down, a larger diameter was predicted, as presented in Fig. 3. In sewers designed in this way, the fluctuations in relative flow depths were calculated for an average day (the lowest and the middle values), as well as for the yearly maximum peak flow (the highest values). Flow-depth fluctuations are important for evaluation of ventilation efficiency and speed of corrosion processes. For the example of the calculations presented here, these fluctuations are shown in Fig. 4. As cohesive sediment that accumulates in sewers should be scoured quite often, only minimum and maximum daily repeated shear stresses were investigated, as shown in Fig. 5. From similar calculations, some practical conclusions were developed.
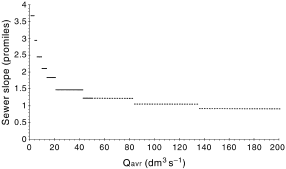
Slopes of circular sewers that ensure shear stress τ = 1.8 N m–2 for full-flow conditions.
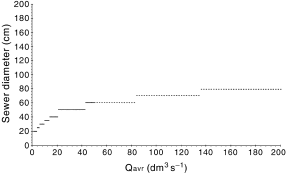
Diameters of circular sewers that are calculated according to the slopes shown in Fig. 2 and ensure the required shear stress τ = 1.8 N m–2 for the full pipe flow (η = 1).
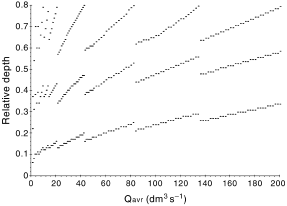
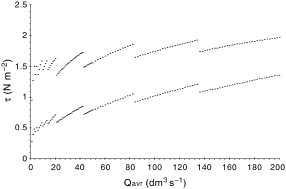
The results of the calculations may be briefly summarised by the following conclusions.
1. Sewers of minimal slopes chosen to ensure self- cleaning for full-flow conditions are not visibly affected by sediments as long as the water-table does not drop below 50% of the sewer height.
2. For larger sewers, calculated invert slopes are smaller giving the same shear stress on the boundary wastewater sewer for the full or real depth flow.
3. For the same relative flow depth, η = h/D (h is the flow depth and D is the sewer height), the slopes of sewer inverts should be inversely proportional to D when operating under the same shear stresses.
4. Conclusion 3 and the results of some other calculations confirm the rules proposed by Imhoff, which state that minimal slopes (Smin) of sewers should fulfil the relationship 1/D(mm) < Smin. However, this rule should not be applied to sewers in which flow depth does not periodically exceed 50% of the sewer height.
5. From the results of the calculations, some general guidelines may be drawn, enabling minimum sewer slope calculations without access to the software. For example, for circular cross-sections, the minimal slope (Smin) that would ensure that an average shear stress of 1.8–2.2 N m–2 or more was reached daily, is equal to the slope for which the shear stress τo (η = h/D = 1) at full flow for D(200–250 mm) was equal to τo (η = h/D = 1) = 2.5 (N m–2), for D (300–500 mm) to τo (η = h/D = 1) = 2.2 (N m–2) and for D(600–700 mm) to τo (η = h/D = 1) = 2.0 (N m–2).
ACKNOWLEDGEMENT
This paper was sponsored by the Swiss National Foundation under a grant for cooperation between universities in the Network for Environmental Assessment and Remediation (NEAR).


