The Escherichia coli SeqA protein destabilizes mutant DnaA204 protein
Abstract
In wild-type Escherichia coli cells, initiation of DNA replication is tightly coupled to cell growth. In slowly growing dnaA204 (Ts) mutant cells, the cell mass at initiation and its variability is increased two- to threefold relative to wild type. Here, we show that the DnaA protein concentration was two- to threefold lower in the dnaA204 mutant compared with the wild-type strain. The reason for the DnaA protein deficiency was found to be a rapid degradation of the mutant protein. Absence of SeqA protein stabilized the DnaA204 protein, increased the DnaA protein concentration and normalized the initiation mass in the dnaA204 mutant cells. During rapid growth, the dnaA204 mutant displayed cell cycle parameters similar to wild-type cells as well as a normal DnaA protein concentration, even though the DnaA204 protein was highly unstable. Apparently, the increased DnaA protein synthesis compensated for the protein degradation under these growth conditions, in which the doubling time was of the same order of magnitude as the half-life of the protein. Our results suggest that the DnaA204 protein has essentially wild-type activity at permissive temperature but, as a result of instability, the protein is present at lower concentration under certain growth conditions. The basis for the stabilization in the absence of SeqA is not known. We suggest that the formation of stable DnaA–DNA complexes is enhanced in the absence of SeqA, thereby protecting the DnaA protein from degradation.
Introduction
In Escherichia coli, initiation of DNA replication from the chromosomal origin, oriC, is a tightly controlled process (reviewed by Messer and Weigel, 1996). Each origin is initiated only once per cell cycle, and all cellular copies of oriC are initiated within a short time interval (Skarstad et al., 1986). In a wild-type strain, the cell mass at initiation of replication is the same for all cells in a given culture, reflecting a tight coupling between mass increase and initiation of replication (Boye et al., 1996). DNA replication is initiated after binding of the initiator protein, DnaA, to five sites, DnaA boxes, in oriC (Fuller et al., 1984; Matsui et al., 1985). DnaA performs strand separation at the three AT-rich 13-mers in oriC, creating an open complex (Bramhill and Kornberg, 1988; Gille and Messer, 1991). This event is followed by loading of the DnaB6 helicase/DnaC6 complex, DnaG primase and, finally, the DNA polymerase III holoenzyme, which replicates the chromosome bidirectionally from oriC (reviewed by Kornberg and Baker, 1992; Messer and Weigel, 1996). In addition to the DnaA protein, several other factors are important in facilitating open complex formation. Architectural elements, such as the IHF and HU proteins (Dixon and Kornberg, 1984; Skarstad et al., 1990; Hwang and Kornberg, 1992), negative DNA supercoiling and transcriptional activation (Baker and Kornberg, 1988; Skarstad et al., 1990) all stimulate the event.
The regulation of initiation of replication, i.e. which elements give the signal for initiation to occur, is largely unknown. Accumulation of DnaA protein may be the rate-limiting step for initiation in vivo (Løbner-Olesen et al., 1989; Skarstad et al., 1989; Atlung and Hansen, 1993). In the ‘initiator titration model’, the ratio of free DnaA protein to oriC has been suggested to be the most important parameter (Hansen et al., 1991a). The level of free DnaA protein results from a balance between de novo DnaA protein synthesis and accumulation of chromosomal DnaA binding sites (DnaA boxes) that serve as negative elements for replication (Kitagawa et al., 1998; Christensen et al., 1999). The DnaA protein may be in the active ATP form or the inactive ADP form (Sekimizu et al., 1987) and, thus, regulation of the conversion between the ATP and ADP forms may also contribute to regulation of the initiation event (Katayama et al., 1998)
The SeqA protein appears to be a negative regulator of initiation of replication. The protein is involved in the sequestration of newly replicated hemimethylated DNA (von Freiesleben et al., 1994; Lu et al., 1994). Lack of SeqA protein reduces the sequestration period of the origin and the dnaA promoter considerably and gives rise to over-replication and asynchronous initiations (von Freiesleben et al., 1994; Lu et al., 1994; Boye et al., 1996). Deletion of the seqA gene suppresses the growth defects of dnaA (Ts) mutants at the non-permissive temperature (von Freiesleben et al., 1994; Lu et al., 1994), and SeqA has been suggested to affect DnaA activity either directly or indirectly (von Freiesleben et al., 1994; Lu et al., 1994). In vitro studies have shown that SeqA inhibits initiation of replication from oriC both by affecting DNA topology and by interfering with the function of prepriming complexes (Wold et al., 1998; Torheim and Skarstad, 1999).
In this study, we have investigated whether the SeqA protein has a negative influence on the timing of initiation of replication under conditions in which the DnaA activity is reduced and thus already limiting the initiation frequency (Boye et al., 1996).
Results
Deletion of the seqA gene reduced the initiation mass of the dnaA204 mutant
When grown slowly, in either alanine medium or a chemostat, dnaA204 (Ts) mutant cells had a two- to threefold higher mass at initiation of replication than wild-type cells (Fig. 1A and C, right, Table 1). Deletion of the seqA gene reduced the initiation mass, so that the initiation mass of the dnaA204ΔseqA mutant was only 1.4 times higher than that of the wild-type cells (Fig. 1D, Table 1). This result shows that the SeqA protein exerts a negative influence on initiation of replication in the dnaA204 single mutant and contributes to the ‘delayed’ initiation and high mass of this mutant.
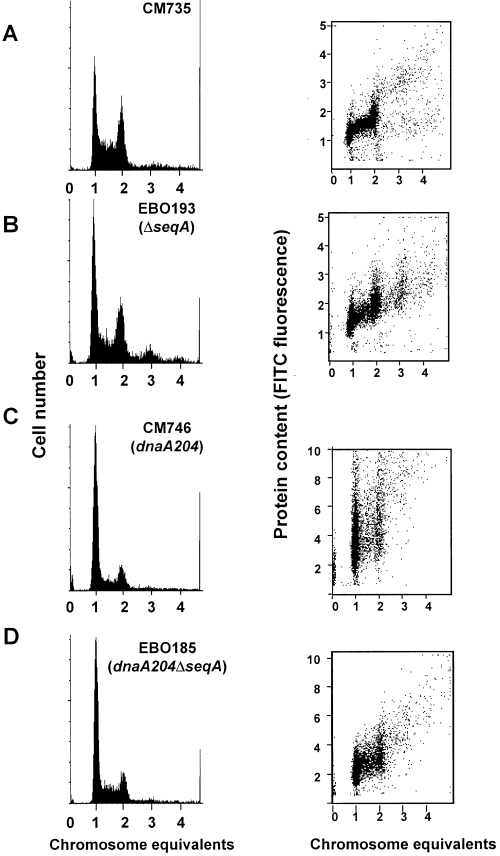
DNA histograms (left) and DNA versus protein content (FITC) dot plots (right) of strains CM735 (A), EBO193 (ΔseqA) (B), CM746 (dnaA204) (C) and EBO185 (dnaA204ΔseqA) (D) grown in a chemostat with 4 h doubling time. Note that the ordinate is changed from the two upper to the two lower right panels.
| Chemostata | Alanine medium | |||||
|---|---|---|---|---|---|---|
| Strain | τ(h) | Mass at initiation | CV % | τ(h) | Mass at initiation | CV % |
| Wild type | 4.0 | 1.0 | 16 | 3.5 | 1.0 | 20 |
| dnaA204 | 4.0 | 3.0 | 40 | 3.5 | 2.0 | 35 |
| ΔseqA | 4.0 | 0.9 | 15 | 6.0 | 0.9 | 22 |
| dnaA204ΔseqA | 4.0 | 1.4 | 21 | 3.5 | 1.4 | 28 |
- a . Values are the average of four experiments.
The variation in mass from cell to cell at the time of initiation of replication indicates how tightly the initiation event is coupled to cell growth. In the wild-type strain, the coefficient of variation (CV) of the mass at initiation was 15–20% (Table 1). The CV increased to about 40% in the dnaA204 mutant. Deletion of the seqA gene in the dnaA204 cells reduced the CV to 20–30% (Table 1), suggesting that DNA replication in the dnaA mutant cells is more tightly coupled to cell growth in the absence of SeqA protein.
DNA replication in rapidly growing cells
When grown rapidly in medium supplemented with glucose and casamino acids (glucose–CAA medium), the dnaA204 mutant cells were only slightly larger than wild-type cells (Table 2). The DNA per mass was 10% lower for dnaA204, 10% higher for ΔseqA and about the same as wild type for dnaA204ΔseqA.
| Strain | τ(min) | Cell mass | DNA content per cell | DNA per mass |
|---|---|---|---|---|
| Wild type | 60 | 1 | 1 | 1 |
| dnaA204 | 61 | 1.4 | 1.2 | 0.9 |
| ΔseqA | 87 | 1.2 | 1.3 | 1.1 |
| dnaA204ΔseqA | 62 | 1.4 | 1.4 | 1.0 |
Wild-type cells were found to initiate synchronously with an asynchrony index (A) of 0.15 (Fig. 2A), where the asynchrony index is the ratio of three- and five-origin cells to four-origin cells (see Experimental procedures). In the dnaA204 mutant, the fraction of cells with three, five, six or seven chromosomes was somewhat higher, giving an asynchrony index of 0.6 (Fig. 2B). In the dnaA204ΔseqA double mutant, the asynchrony index was high (A = 1.9; Fig. 2D). The ΔseqA single mutant did not yield histograms with separate peaks (Fig. 2C).
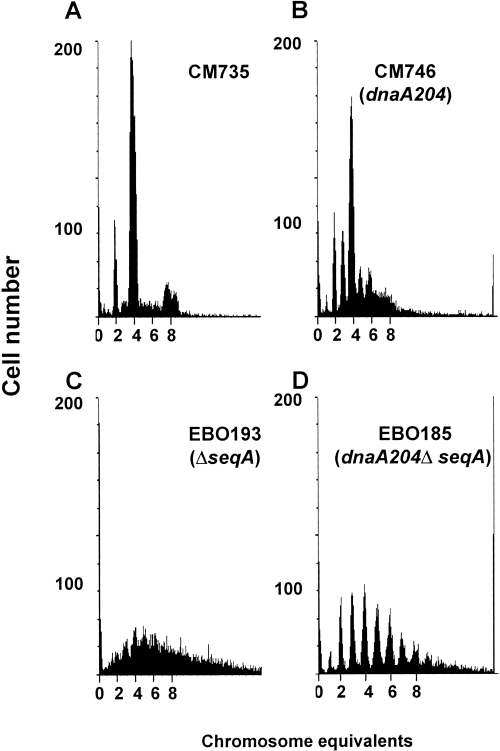
DNA histograms of cells grown in glucose–CAA medium and treated with rifampicin and cephalexin. Distinct peaks represent the accumulation of cells with integral numbers of chromosomes that reflect the numbers of origins at the time of drug action.
Thus, in accordance with earlier reports, we find that, in rich medium, DNA replication in the ΔseqA strain is somewhat aberrant (von Freiesleben et al., 1994; Lu et al., 1994), whereas it is fairly normal in the dnaA204 strain (Skarstad et al., 1988; Hansen, 1995; Hansen and Atlung, 1995).
Decreased DnaA protein concentration in dnaA204 mutant cells during slow growth
The fact that the cell mass of the dnaA204 mutant was more normal during rapid growth (Table 2) than during slow growth (Table 1) indicated that there might be a growth rate-dependent deficiency in the supply or activity of the DnaA204 protein. Wild-type cells grown in either glucose–CAA or alanine medium contained 10–20 ng of DnaA protein per mass unit (Fig. 3), in agreement with earlier studies (Hansen et al., 1991b). The DnaA concentration in the dnaA204 mutant was similar to the wild type, but higher in the ΔseqA and dnaA204ΔseqA strains in glucose–CAA medium. The reason for the increased DnaA concentration in the absence of SeqA might be an effect of the increased dnaA gene dosage during rapid growth. During slow growth, either in alanine medium or in a chemostat, the DnaA concentration in the dnaA204 mutant was reduced two- to threefold relative to wild type (Fig. 3). This deficiency was partly restored by deleting the seqA gene (Fig. 3).
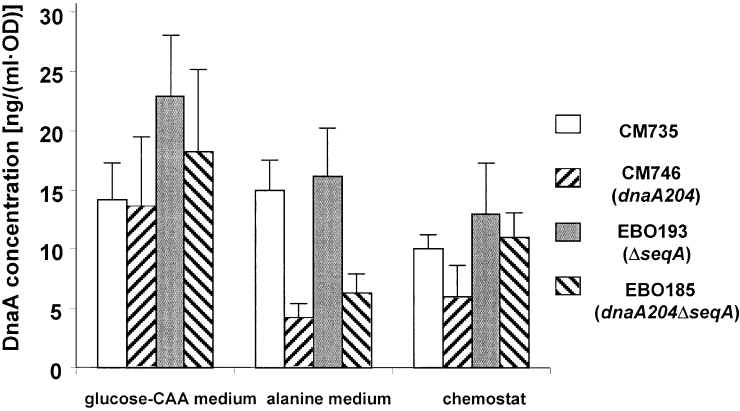
DnaA protein concentration in cells grown in glucose–CAA or alanine media, or in a chemostat. The concentration was determined by immunoblotting in parallel with purified DnaA of known concentration (see Experimental procedures). The ordinate unit is ng ml−1 culture of OD450 = 1. The values are the average of eight experiments. The standard error of the mean is indicated.
Derepression of the dnaA gene
The lower DnaA concentration in the slowly growing dnaA204 mutant could result from reduced synthesis of the protein. To monitor transcription of the dnaA gene, the lacZ reporter gene, placed behind the dnaA promoter (Braun et al., 1985), was introduced into the four strains (see Experimental procedures). The strains were grown in glucose–CAA and alanine media, and the dnaA promoter activity was monitored by an enzymatic assay for β-galactosidase activity. The dnaA promoter activity was similar in the wild type and the ΔseqA mutant in both media. Because the ΔseqA mutant has an increased dnaA gene copy number as a result of overinitiation, at least in rich media, the total dnaA gene transcription in the ΔseqA cells is higher than in the wild type (Bogan and Helmstetter, 1997).
In the dnaA204 mutants, the dnaA promoter activity was higher relative to the wild type during both rapid and slow growth (Fig. 4), suggesting that repression of synthesis was not the reason for the low levels of DnaA204 protein.
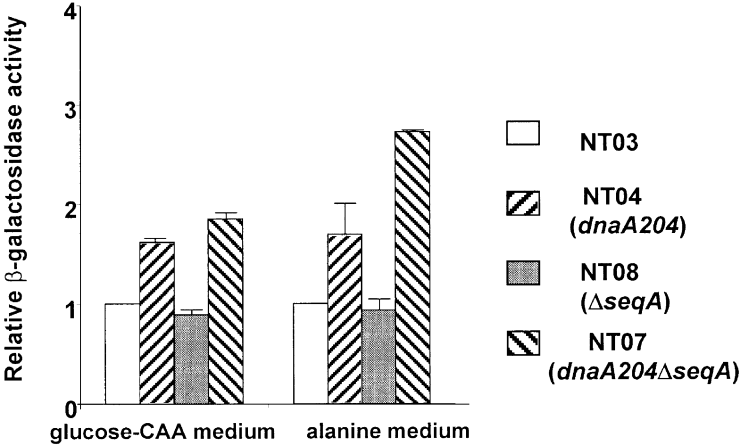
Relative activity of the dnaA promoter. Strains with the lacZ reporter gene under the control of the dnaA promoter, NT03, NT04(dnaA204), NT08 (ΔseqA) and NT07 (dnaA204ΔseqA) were grown in glucose–CAA or alanine media. The activity of the dnaA promoter was monitored by an assay for β-galactosidase activity (see Experimental procedures). The value for the wild-type strain was set to 1 for each medium. The standard error of the mean is indicated.
Degradation of mutant DnaA protein was suppressed in the absence of the SeqA protein
An alternative explanation for the low DnaA concentration in the dnaA204 mutant is protein degradation. To monitor the stability of the DnaA proteins, we measured the ratio of DnaA to total protein after inhibition of protein synthesis with chloramphenicol. The wild-type DnaA protein was stable for more than 24 h. However, in the dnaA204 mutant, the DnaA protein was unstable in both glucose–CAA and alanine medium (Fig. 5). The half-life of the DnaA204 protein was about 30 min in alanine medium and about 1 h in glucose medium. Thus, in alanine medium, the half-life of the protein is much shorter than the doubling time, whereas in glucose–CAA medium, the half-life is in the same range as the doubling time.
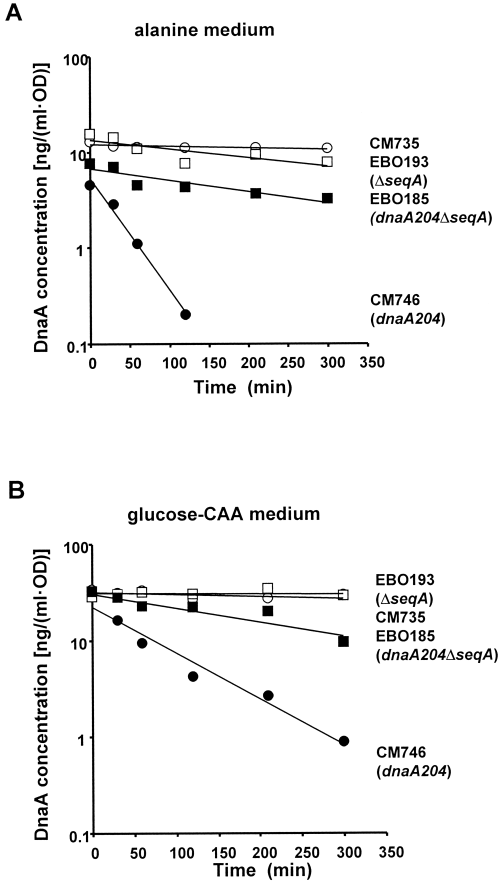
Degradation of the DnaA protein. The strains CM735 (wt; open circles), CM746 (dnaA204; filled circles), EBO193 (ΔseqA; open squares) and EBO185 (dnaA204ΔseqA; filled squares) were grown exponentially at 30°C in alanine medium (A) or glucose–CAA medium (B) and treated with chloramphenicol at time zero. The concentration of DnaA protein was determined by immunoblotting with purified DnaA protein as standard.
In the dnaA204ΔseqA mutant, the protein was more stable, with a half-life of about 3.5 h. Thus, the DnaA204 protein was highly unstable, and the absence of the SeqA protein stabilized the DnaA204 protein considerably. This result probably explains why deletion of the seqA gene reduced the initiation mass of slowly growing dnaA204 cells (Table 1).
In alanine medium, the SeqA concentration was the same in wild-type and dnaA204 cells (Table 3). The mass/DNA of alanine-grown dnaA204 cells was increased about twofold relative to wild type and, thus, the ratio of SeqA to DNA in these cells was also increased twofold. In glucose–CAA medium, the SeqA concentration was about 1.5-fold in dnaA204 cells compared with wild-type cells (Table 3), whereas the mass/DNA was similar to wild type. The fact that the ratio of SeqA to DNA was increased twofold in alanine-grown dnaA204 cells and only about 1.5-fold in glucose–CAA-grown dnaA204 cells may account for the more rapid degradation of DnaA204 protein in the former.
| Strain/media | SeqA concentrationa[ng/(ml · OD)] |
|---|---|
| CM735 glucose–CAA | 2.1 |
| CM746 (dnaA204) glucose–CAA | 3.1 |
| CM735 alanine | 3.2 |
| CM746 (dnaA204) alanine | 3.1 |
- a . Values are the average of two experiments, and each of these numbers is the average of two measurements.
DnaA stability in other dnaA (Ts) mutants
The half-lives of other mutant DnaA (Ts) proteins was estimated as described above (Table 4). The DnaA204, DnaA508 and DnaA205 proteins had short half-lives, whereas the ATP binding-deficient proteins DnaA5 and DnaA46 (Hwang and Kaguni, 1988; Hupp and Kaguni, 1993) were more stable.
| Strain | Half-life of DnaA protein (h) |
|---|---|
| CM735 wild type | > 24 |
| CM746 (dnaA204) | 1 |
| CM744 (dnaA205) | 1 |
| CM2555 (dnaA508) | 1 |
| CM740 (dnaA5) | 3 |
| CM742 (dnaA46) | 3 |
| EBO185 (dnaA204ΔseqA) | 3 |
| KS9826 (dnaA46ΔseqA) | 3 |
The DnaA46 protein was not stabilized by deletion of the seqA gene (Table 4), and the twofold increase in initiation mass of the dnaA46 mutant when grown slowly (Boye et al., 1996) was not improved in the dnaA46ΔseqA double mutant (data not shown). This indicates that the molecular mechanism behind the increased initiation mass caused by the dnaA46 mutation is of a different nature than that caused by the dnaA204 mutation.
Discussion
Initiation of replication in wild-type and dnaA204 strains occurs when the same amount of DnaA protein per cell is reached
We have shown that the DnaA204 (Ts) protein is highly unstable at the permissive temperature. In slowly growing cells, this results in a lower concentration of DnaA protein and a dramatic increase in the mass at initiation. The two- to threefold higher initiation mass in the dnaA204 mutant relative to wild type at slow growth together with the approximately threefold lower concentration of DnaA protein in this strain suggests that initiation of replication occurred at about the same amount of DnaA protein per cell and, thus, presumably with the same amount of DnaA per origin. These data indicate that the specific activity of the DnaA204 protein is similar to that of wild-type protein.
The present experiments do not address whether the DnaA204 protein is active and rapidly degraded at the non-permissive temperature. It is certainly a possibility that rapid degradation accounts for the cessation of initiation of replication at high temperature (Hansen and Atlung, 1995).
DnaA degradation is reduced in the absence of SeqA
The DnaA204 protein has a mutation in the C-terminal, DNA-binding domain (Hansen et al., 1992; Roth and Messer, 1995). It has been proposed that the DnaA204 protein is more stable at 42°C when bound to DNA (Hansen and Atlung, 1995a). In a ΔseqA background, the DnaA204 protein was stabilized. One could imagine that structural changes in the chromosome by loss of SeqA (Torheim and Skarstad, 1999; Weitao et al., 1999) favours DnaA binding, thus bringing about the observed DnaA stabilization. Alternatively, SeqA could compete with DnaA for binding sites or interfere directly with the building of the DNA-bound DnaA complexes. An observation in support of the notion that SeqA destabilizes DnaA204 by reducing its opportunity to bind to DNA is that degradation of DnaA204 is more rapid in alanine medium compared with glucose–CAA medium. In the latter medium, the ratio of SeqA to DNA is more like wild type than in the former, where it is increased twofold relative to wild type.
A third alternative is that SeqA is directly involved in the degradation of the DnaA204 protein by, for instance, functioning as a chaperone presenting the protein to the proteolytic machinery.
DnaA protein stability in other dnaA (Ts) mutants
Many dnaA (Ts) mutants exhibit an increased initiation mass during slow growth (Boye et al., 1996). However, not all mutant DnaA proteins were equally prone to degradation (Table 4). The DnaA204, DnaA205 and DnaA508 proteins were degraded quite rapidly, whereas DnaA5 and dnaA46 proteins were fairly stable.
The dnaA508 and dnaA204 mutants are only slightly affected in initiation synchrony, dnaA5 and dnaA46 are highly asynchronous and dnaA205 has an intermediate degree of asynchrony (Skarstad et al., 1988). Thus, the mutants retaining fairly normal synchrony of replication initiation exhibited a highly unstable DnaA protein, indicating that supply rather than specific activity of these proteins limits initiation of replication at the permissive temperature. The ATP binding-deficient proteins, on the other hand, could be affected in specific activity as well as, or instead of, stability.
Growth and replication defects of the seqA mutant are suppressed by the dnaA204 allele
In rich medium, the ΔseqA mutant exhibited several growth and replication aberrations. Initiations occurred more than once per cell cycle and were asynchronous. Run-out of replication after rifampicin treatment was impaired (Fig. 2C); the DNA concentration was higher and the growth rate lower than in the wild-type strain. Introduction of the dnaA204 allele suppressed all these phenotypes except for the asynchrony of initiation.
Lack of distinct DNA peaks after drug treatment could result from either rifampicin-resistant initiations or inhibition of replication elongation in the presence of rifampicin. Extensive rifampicin-resistant initiation was not observed in the ΔseqA mutant, as the DNA content per cell did not increase more in the mutant than in the wild type during drug treatment (data not shown). This indicates that replication elongation is at least partially inhibited. It is possible that the overinitiation found in SeqAless cells leads to deficiency in precursors for DNA synthesis, and thus stalled replication forks.
It is likely that the lower DnaA concentration in the dnaA204ΔseqA double mutant prevents overinitiation and thereby also relieves the elongation and growth impairment of the seqA mutant. Reduction in the ratio of DnaA to DNA by the introduction of extrachromosomal DnaA boxes also improved the growth rate and reduced the overinitiation of a seqA mutant (von Freiesleben et al., 1994). The dnaA204ΔseqA double mutant did, however, initiate replication asynchronously. Possibly, the initiation asynchrony of the seqA mutant results from the sequestration deficiency in the absence of SeqA (Lu et al., 1994), whereas overinitiation is caused by excess DnaA.
DnaA concentrations under different growth conditions
The DnaA concentration in wild-type cells grown in batch culture was found to be the same during rapid and slow growth. This is in accordance with the notion that DnaA protein is synthesized in proportion to bulk protein (Hansen et al., 1991b) and is not growth rate regulated.
A comparison of DnaA concentrations in wild-type cells grown in batch culture and in a chemostat indicates a lower value for the latter [about 10 instead of about 15 ng of DnaA (ml · OD); Fig. 3]. Thus, the DnaA concentrations differ even though the growth rate is the same. Growth in the chemostat is, however, limited by the supply of glucose. The growth conditions in the two situations thus differ considerably, and it would be reasonable to suppose that replication may be under different subsets of controls. A comparison of the initiation mass of batch-grown and chemostat-grown cells, both with a growth rate of 4 h, also revealed a difference: the chemostat-grown cells had a 50% lower initiation mass compared with the batch-grown cells (data not shown). The lower initiation mass combined with the lower DnaA concentration indicates that the amount of DnaA required per origin at the time of initiation in chemostat-grown cells is considerably lower than the amount required in batch-grown cells. This argues that, although DnaA concentration may be an important parameter in the control of initiation of chromosome replication, it cannot be the sole determinant under both the above growth conditions.
Experimental procedures
Bacterial strains
All strains are derivatives of the Escherichia coli K-12 strain CM735 metE46, trp-3, his-4, thi-1, galK2, lacY1 or lacZ4, mtl-1, ara-9, tsx-3, ton-1, rps-8 or rps-9, supE44 λ− (Hansen and von Meyenburg, 1979). CM746 (dnaA204), CM740 (dnaA5), CM742 (dnaA46), CM744 (dnaA205) and CM2555 (dnaA508) are isogenic dnaA (Ts) mutants (Table 5) (Hansen et al., 1984; 1992).
| Strain | Relevant features | Source or reference |
|---|---|---|
| CM735 | Wild type | Hansen and von Meyenburg (1979) |
| CM740 | dnaA5 | Hansen and von Meyenburg (1979) |
| CM742 | dnaA46 | Hansen and von Meyenburg (1979) |
| CM744 | dnaA205 | Hansen and von Meyenburg (1979) |
| CM746 | dnaA204 a | Hansen and von Meyenburg (1979) |
| CM2555 | dnaA508 | Hansen and von Meyenburg (1979) |
| SS211 | pBIP Kan, sacB+, seqAΔ10 | Slater et al. (1995) |
| EBO193 | P1 SS211 (ΔseqA) × CM735 | This work |
| EBO185 | P1 SS211 (ΔseqA) × CM746 (dnaA204) | This work |
| KS9826 | P1 SS211 (ΔseqA) × CM742 (dnaA46) | This work |
| NT01 | P1 (lacZ::Tn5) × CM735 | This work |
| NT02 | P1 (lacZ::Tn5) × CM746 (dnaA204) | This work |
| NT03 | (λRb1)b × NT01 (lacZ) | This work |
| NT04 | (λRb1) × NT02 (dnaA204lacZ) | This work |
| NT05 | P1 (lacZ::Tn5) × EBO193 (ΔseqA) | This work |
| NT06 | P1 (lacZ::Tn5) × EBO185 (dnaA204ΔseqA) | This work |
| NT07 | (λRb1) × NT06 (dnaA204ΔseqAlacZ) | This work |
| NT08 | (λRb1) × NT05 (ΔseqAlacZ) | This work |
| AQ3519 | dnaA850::Tn10 rnhA::cat thyA | Kline et al. (1986) |
- a . The dnaA204 allele bears the same mutation as the dnaA203 allele used in other studies ( Hansen and von Meyenburg, 1979; Hansen et al., 1992).
- b .λRb1: dnaA′–′lacZ translational fusion cloned into λNF1955 (Braun et al., 1985) .
ΔseqA strains (Table 5) were constructed by P1 co-transduction at of the pBIP Kan marker, with the sacB and seqAΔ10 genes (Slater and Maurer, 1993; Slater et al., 1995) into the recipient strains at 30°C or 37°C generating a co-integrant carrying both alleles of seqA. Selection for the crossing out of sacB, the Kan marker and the wild type or the seqAΔ10 allele was done by plating on 5% sucrose. The resulting wild-type or seqAΔ10 strain was identified by Southern blotting or polymerase chain reaction (PCR).
lacZ strains (Table 5) were constructed by P1 transduction (Miller, 1992) of lacZ::Tn5 into recipient strains. White colonies were selected on plates with 40 µg ml−1 Xgal (Sigma) and 50 µg ml−1 kanamycin (Fluka).
dnaA′–′lacZ (λRb1) strains, NT03, NT04 (dnaA204), NT07 (dnaAΔseqA) and NT08 (ΔseqA) were constructed by λ transduction of λRb1 into the lacZ strains (Braun et al., 1985). Blue plaques were selected on 80 µg ml−1 Xgal. These strains produce β-galactosidase as a function of dnaA promoter activity.
Strain AQ3519 dnaA850::Tn10 rnhA::cat thyA was used for preparation of cell extract without DnaA protein.
Growth conditions
Growth was in AB minimal medium (Clark and Maaløe, 1967) supplemented with thiamine (1 µg ml−1), tryptophan (20 µg ml−1) and (i) methionine (20 µg ml−1), histidine (22 µg ml−1) and alanine (0.2%) in batch culture (alanine medium); (ii) methionine (20 µg ml−1), histidine (22 µg ml−1) and limiting glucose (0.01%) in a chemostat with 4 h doubling time (Kubitschek, 1970); or (iii) glucose (0.2%) and casamino acids (0.5%) (Difco) in batch culture (glucose–CAA medium). If not otherwise stated, growth was at 30°C. Mass growth was monitored by measuring optical density at 450 nm (OD450).
Treatment with rifampicin and cephalexin
Rifampicin (150 µg ml−1; Fluka) and cephalexin (10 µg ml−1; Eli Lilly) were added to exponentially growing cells (OD450 = 0.15), and incubation continued for three or four doublings to complete ongoing rounds of replication. The cells were fixed and stained as described below.
Rifampicin inhibits transcription, which results in inhibition of initiation of DNA replication, whereas cephalexin inhibits cell division (Skarstad et al., 1986; Boye and Løbner-Olesen, 1991). Thus, after treatment with these drugs, cells end up with an integral number of chromosomes (Skarstad et al., 1986), which represents the number of origins present in each cell at the time of drug action. In a culture of cells with synchronous initiation, the integral number of chromosomes is two, four or eight. With increasing asynchrony, an increasing number of cells with three, five, six or seven chromosomes appear.
Fixation and staining
Exponentially growing cells (OD450 = 0.15) or cells treated with rifampicin and cephalexin were washed and resuspended in TE buffer, then diluted 10-fold in 77% ethanol for fixation. The cells were washed in 0.1 M phosphate buffer, pH 9.0, and stained overnight at 4°C in 1.5 µg ml−1 fluorescein isothiocyanate (FITC) in the same buffer (made from a freshly made 3 mg ml−1 stock solution) (Wold et al., 1994). This dye binds covalently to cellular proteins. The cells were washed twice in 0.02 M phosphate-buffered saline (PBS), pH 9.0, to remove unbound dye and resuspended in the same buffer. The DNA was stained by adding an equal volume of 3 µg ml−1 Hoechst 33258 in the same buffer (final 1.5 µg ml−1).
Staining of the flow cytometry DNA standard
An ethanol-fixed sample of slowly growing CM735 (the majority of which contained either one or two chromosomes) was used as an internal standard in all samples. The standard was included with every sample during incubation with the Hoechst 33258 stain (see above) and was not stained with FITC.
Flow cytometry
Flow cytometry was performed with a FACStar+ (Becton Dickinson) equipped with an argon ion laser emitting 0.5 W at 488 nm (Spectra Physics) and a krypton laser emitting 0.5 W in multiline UV-mode (351 and 357 nm; Spectra Physics). The fluorescence of FITC was filtered through a 510–545 nm interference filter. A 488 nm bandpass filter was used for collection of the 90° light scatter. A combination of a longpass 400 nm and a shortpass 480 nm interference filter was used collecting Hoechst 33258 fluorescence. Light scatter (90°) was used as the threshold parameter for calibration of the DNA content axis (Hoechst 33258 fluorescence). The standard (see above) in each sample was measured selectively for Hoechst 33258 fluorescence using a software gate to include only the FITC-negative cells. The sample was run for 2 min before stable Hoechst 33258 fluorescence readings were obtained. The one- and two-chromosome peaks were positioned at fixed channels using the PMT voltage. Without changing the sample differential pressure, the threshold parameter was changed to FITC fluorescence, and the software gate was disabled. Under these conditions, the control cells, lacking significant FITC fluorescence, were not registered as events, and only the signals from the test cells in the sample were acquired.
Analysis of flow cytometry histograms
The average cell mass was determined as average FITC fluorescence per cell. The average DNA content per cell was determined as average Hoechst fluorescence per cell. The average DNA per mass was found by dividing average DNA content by average cell mass. The cell mass at initiation for slowly growing cells was found by plotting the average cell mass of cells with 1.4, 1.5 and 1.6 chromosome equivalents as a function of DNA content and then extrapolating to one chromosome (Boye et al., 1996). The coefficient of variation (CV) of the mass at initiation was taken to be the same as the CV of the mass of cells with 1.4–1.6 chromosomes. The asynchrony index, A, was found by calculating the ratio of cells with three and five chromosomes to the cells with four chromosomes (Skarstad et al., 1988) in the histrogram of rifampicin- and cephalexin-treated cells.
Preparation of cell extract
Samples of exponentially growing cells (OD450 = 0.15 or 0.3) were harvested by centrifugation at 4°C. The cells were resuspended in Tris-EDTA buffer (TE), and OD450 was determined. A standard loading buffer for SDS–PAGE was added, and the samples were boiled for 5 min.
Alternatively, the samples were resuspended in a TE buffer containing 1% SDS and glycerol and boiled for 5 min. Total protein concentration was determined by a colorimetric assay (BCA kit from Pierce). A buffer containing SDS and β-mercaptoethanol was added, and the samples were boiled for 2 min.
Preparation of DnaA standards
Standards for the measurement of DnaA concentration were purified DnaA protein (0.1–5 ng) mixed with cell extract from a ΔdnaA strain grown in the same medium as the strains to be studied. No cross-reacting band the size of DnaA was detected. Standards for measurement of SeqA concentration were purified SeqA protein (0.1–5 ng).
Determination DnaA and SeqA protein concentrations
A fixed amount of cell extract (determined as described above) and DnaA or SeqA standards was subjected to SDS–PAGE (12% gels). The proteins were transferred to a polyvinylidene difluoride (PVDF) membrane by semi-dry blotting. The membrane was probed with DnaA or SeqA anti-rabbit antibody using standard procedures. Detection was carried out using a fluorescence kit (ECF kit from Amersham Pharmacia Biotech). The membranes were scanned on a Storm 840 (Molecular Dynamics), and quantification was performed using imagequant software (Molecular Dynamics). DnaA or SeqA standard curves were made, and the DnaA or SeqA concentrations in the cell extracts were determined by comparison with the standard curves.
Measurement of protein degradation
Chloramphenicol (100 µg ml−1; Sigma) was added to exponentially growing cells (OD450 = 0.15 or 0.3) to inhibit further protein synthesis. Samples were taken between 0 and 24 h for the determination of DnaA concentrations as described above.
β-Galactosidase assay for the determination of dnaA promoter activity
Samples (1 ml) from exponentially growing cultures (OD450 = 0.1–0.5) were mixed with toluene (100 µl) by vortexing for 20–30 s. The extracts (200 µl) were incubated with ONPG [1 ml of 0.66 mg ml−1 dissolved in Z-buffer (phosphate buffer with magnesium and chloride ions)] at 30°C for 1–2 h (Miller, 1992). Reactions were stopped by the addition of Na2CO3 (0.5 ml, 1 M). Optical density was measured at 420 nm. The specific activity was determined based on OD (Miller units) {1000 × OD420/[time (min) × volume (ml) × OD450]} or based on total protein {1000 × OD420/[time (min) × volume (ml) × total protein (ng ml−1)]}. The value for the wild-type strain based on OD was 30 U in glucose–CAA medium and 85 U in alanine medium.
Acknowledgements
We thank Anne Wahl and Kirsti Solberg for excellent technical assistance. This work was supported by the Norwegian Research Council (N.K.T. and K.S.) and by the Norwegian Cancer Society (A.L.-O., E.B., T.S. and K.S.).


