Expression of the phosphotransferase system both mediates and is mediated by Mlc regulation in Escherichia coli
Abstract
The ptsHIcrr operon encodes the cytoplasmic components of the phosphotransferase system (PTS). It is expressed from two major promoters, of which the upstream promoter has previously been shown to be induced by glucose and to be dependent upon cAMP/CAP. This promoter is now shown to be repressed by Mlc. Mlc is a transcriptional regulator controlling, among others, the gene ptsG, encoding EIICBGlc, the glucose-specific transporter of the PTS. Transcription of ptsH p0 and ptsG are subject to the same regulatory pattern. In addition to induction by glucose and repression by Mlc, mutations in ptsHIcrr, which interrupt the PEP-dependent phosphate transfer through the soluble components of the PTS, lead to high expression of both ptsH and ptsG, while mutations inactivating EIIBCGlc are non-inducible. Mutations in mlc lead to high constitutive expression and are dominant, implying that Mlc is the ultimate regulator of ptsHI and ptsG expression. Growth on other PTS sugars, besides glucose, also induces ptsH and ptsG expression, suggesting that the target of Mlc regulation is the PTS. However, induction by these other sugars is only observed in the presence of ptsG+, thus confirming the importance of glucose and EIICBGlc in the regulation of the PTS. The ptsG22 mutation, although negative for glucose transport, shows a weak positive regulatory phenotype. The mutation has been sequenced and its effect on regulation investigated.
Introduction
The PEP-dependent carbohydrate phosphotransferase system (PTS) is the major transport system for sugars in both Gram-positive and Gram-negative bacteria. The PTS sugars produce, in general, better growth rates than other non-PTS sugars, such as lactose, galactose or maltose in Escherichia coli. The soluble PTS proteins, enzyme I (EI) and HPr, are common to all (or nearly all) PTS sugars and function to funnel phosphate groups from PEP to the membrane-bound, sugar-specific transporters called enzymes II (EIIs). The EIIs are modular proteins consisting of three (or four) domains situated on one or several polypeptides (for a review, see Postma et al., 1996). The glucose transporter EIIGlc consists of two proteins, a soluble EIIAGlc component and a membrane-bound EIICBGlc protein. As well as being part of the phosphate cascade for glucose, the EIIAGlc component is an important regulator of sugar utilization, acting as a stimulator of adenylate cyclase activity or as an inhibitor of the transport or use of non-PTS sugars, depending upon its phosphorylation state (for reviews, see Lengeler, 1996; Saier et al., 1996).
The gene for EIIAGlc, crr, is part of an operon with the genes for EI and HPr, ptsH ptsI crr, and is not associated with the gene for the EIICB protein, ptsG. The expression of the ptsHIcrr operon is subject to complex regulation. There are at least two promoters upstream of ptsH plus an internal promoter for crr located within the ptsI gene (De Reuse et al., 1984; Saffen et al., 1987; De Reuse and Danchin, 1988). The upstream ptsH promoter (p0) has been shown to be subject to both induction by growth on glucose and activation by cAMP/CAP (De Reuse and Danchin, 1988; De Reuse et al., 1992; Ryu and Garges, 1994), while the second, downstream promoter (p1) is regulated by FruR (Cra), the repressor for the fructose PTS (Ryu et al., 1995). FruR is a pleiotropic regulator that seems to co-ordinate the switch from glycolytic to gluconeogenic metabolism (Saier and Ramseier, 1996).
More recent work has shown that the ptsG gene, encoding EIICBGlc, is also subject to complex regulation. In particular, it shows the same type of dual regulation as the ptsH p0 promoter, and it is both induced by glucose and dependent upon cAMP/CAP (Kimata et al., 1998; Plumbridge, 1998a). A higher level of expression in glucose than in glycerol is unexpected for a gene regulated by cAMP/CAP. Growth on glucose reduces the cAMP and cAMP receptor protein (CAP) concentrations in the cell, and so is expected to reduce the expression of cAMP/CAP-dependent genes (Epstein et al., 1975; Joseph et al., 1982; Ishizuka et al., 1993; 1994). In the case of the ptsG operon, this glucose induction is likely to be mediated by the Mlc protein (Kimata et al., 1998; Plumbridge, 1998a).
Glucose is also transported by a second PTS transport system, the so-called mannose PTS, encoded by the manXYZ operon, which is also regulated by Mlc (Plumbridge, 1998b). The mannose PTS is rather a ‘generic’ transporter capable of transporting several hexoses, including mannose (Man), glucose (Glc), glucosamine (GlcN), N-acetylglucosamine (GlcNAc) and fructose (Fru). Mlc also affects the use of at least one non-PTS sugar. The expression of the genes of the mal regulon is dependent upon the positive transcriptional regulator encoded by malT. Expression of malT is itself negatively regulated by mlc, so that Mlc indirectly regulates the mal regulon (Decker et al., 1998). Metabolism of maltose and maltodextrins produces intracellular glucose and glucose-1-P.
The Mlc protein thus acts as a repressor for several catabolic operons whose products are linked to glucose metabolism. The previously observed glucose induction of ptsHI expression prompted an investigation of the effect of Mlc on the expression of these genes encoding the central components of the pts operon, ptsHI. Moreover, mutations in ptsHI or ptsG have been shown to affect glucose induction of ptsHI expression (De Reuse and Danchin, 1991). These factors have therefore been reinvestigated in the light of Mlc regulation of ptsG and ptsHI.
Results
Mlc represses transcription from ptsH p0
The organization of the ptsH promoters is shown in Fig. 1. To test whether the transcription from the upstream ptsH p0 promoter, which has been shown previously to be induced by glucose, is also regulated by Mlc, ptsH mRNA levels were examined in mlc+ and mlc strains. S1 analysis showed that expression from p0 is strongly enhanced in mlc cells compared with the wild-type strain grown on glycerol (Fig. 2A, lanes 2 and 3). It is equally enhanced when wild-type or mlc bacteria are grown on glucose (lanes 4 and 5). The p1 promoter is not affected greatly, except that the p1 transcript is maybe a little stronger when p0 is not active, but this could be the result of the loss of promoter occlusion by transcription from the upstream p0 transcript (Adhya and Gottesman, 1982).

. Organization of the regulatory sites upstream of ptsH. The location of the Mlc, FruR and CAP binding sites are shown relative to the start site of the major p1a transcript (+ 1). The 5′ end of the p0 transcript is at −100. The locations of the oligonucleotides Pts1 to Pts3 are shown. Their 5′ ends, indicated by an asterisk, are Pts1-235, Pts2+50 and Pts3+201. The DNA sequence of the p0 and p1 promoter region is given. The −10 promoter sequences are underlined, and the start of the p0, p1a and p1b transcripts is indicated (Ryu et al., 1995).
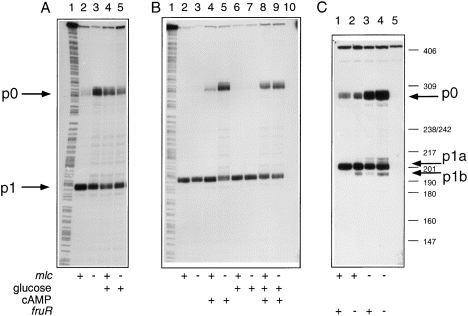
. S1 analysis of the ptsH transcripts. The probe used was the Pts1–Pts3 fragment labelled at Pts3. It was hybridized with 30 μg of total RNA overnight at 52°C in 80% formamide, 40 mM PIPES (pH 6.9) and 400 mM NaCl. The next morning, the temperature was allowed to fall to 49°C for 2 h before digesting with S1 nuclease (250 units ml−1 in 30 mM sodium acetate buffer, pH 4.5), 250 mM NaCl, 1 mM ZnCl2 and 5% glycerol for 30 min at 37°C. S1-resistant hybrids were analysed on a 6% denaturing acrylamide gel.A. RNA was prepared from JM101 (lanes 2 and 4) and IBPC1012 (mlc::Tc) (lanes 3 and 5) grown in glycerol (lanes 2 and 3) and glucose (lanes 4 and 5). B. RNA was prepared from the Δcya strain, TP2006 (lanes 2, 4, 6 and 8) and TP2006 mlc::Tc (lanes 3, 5, 7 and 9) grown in glycerol (lanes 2 and 3), glycerol + 2 mM cAMP (lanes 4 and 5), glycerol + 0.2% glucose (lanes 6 and 7) and glycerol + cAMP + glucose (lanes 8 and 9). In lane 10, hybridization was with 30 μg of tRNA. C. RNA was prepared from JM101 λRS/ptsG–lacZ (lane 1) and the same strain with the mutations fruR::Tn10 (lane 2), mlc::Tc (lane3) and fruR::Tn10, mlc::Tn10kan (lane 4) or 30 μg of tRNA (lane 5). A minor transcription start site (pX) downstream of p0 had been detected previously by primer extension (Ryu and Garges, 1994) and is seen in some lanes here (e.g. C3 and 4) when expression from p0 is high. Lanes A1 and B1 show an A + G sequencing reaction on the Pts1–Pts3 DNA probe. The molecular weight marker is pBR322 digested with MspI.
The effect of mlc on ptsH expression was quantified with a ptsH–lacZ fusion. The overall expression of ptsH is induced about fourfold by either an mlc mutation or growth on glucose (Table 1A) and repressed about threefold by the presence of Mlc on a multicopy plasmid (Table 1B). These observations, induction by growth on glucose or an mlc mutation and repression by excess Mlc, are consistent with Mlc acting as a repressor for p0 and growth on glucose generating an inducing signal for Mlc.
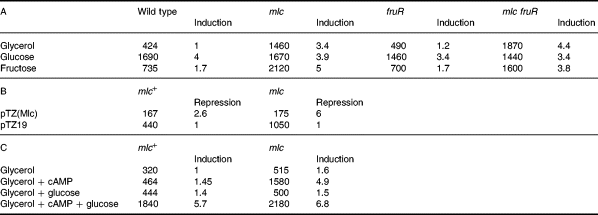
It has been shown previously that p0 is only expressed in a crp+cya+ background in vivo (De Reuse et al., 1992; Ryu and Garges, 1994). To investigate whether the requirement for cAMP/CAP is abrogated by the mlc mutation, mRNA prepared from a Δcya strain was examined (Fig. 2B). In the cya strain, the p0 transcript was not detected in the absence of cAMP (Fig. 2B, lanes 2, 3, 6 and 7). The addition of cAMP to the wild-type strain allowed a low level of ptsH p0 expression (Fig. 1B, lane 4), while it was increased considerably by either the mlc mutation (lane 5) or the presence of glucose (lanes 8 and 9). The p0 transcript was not detected in the absence of cAMP, irrespective of the addition of glucose or the presence of an mlc mutation (lanes 2, 3, 6 and 7). Measurement of the ptsH–lacZ fusion under the same conditions confirmed these observations (Table 1C). Thus, transcription from ptsH p0 is very strongly dependent upon cAMP/CAP, even in an mlc background.
DNase I footprinting (Fig. 3) localized a single Mlc binding site covering the + 1 to + 23 sequence relative to p0 (Fig. 1). The sequence protected is similar to the other known Mlc binding sites located in the promoter regions of the ptsG, manXYZ, malT and mlc genes (Fig. 1) (Decker et al., 1998; Plumbridge, 1998a,b).
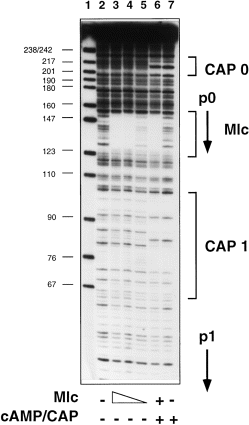
. Binding of Mlc and CAP to the ptsH regulatory region. The probe is the Pts1–Pts2 fragment labelled at Pts2. It was incubated with CAP (50 nM, with 0.2 mM cAMP in lanes 6 and 7) and with a bacterial extract containing overproduced Mlc protein from IBPC529C pTZ(Mlc) (lanes 3–6). Lanes 3 and 6, ≈ 33 μg ml−1 extract; lane 4, 11 μg ml−1; lane 5, 4 μg ml−1. Lane 2 gives the footprint in the absence of added protein. The binding buffer was 25 mM HEPES, 100 mM sodium glutamate (pH 8.0) containing 0.5 mg ml−1 BSA. The products were analysed on an 8% denaturing acrylamide gel. Lane 1 is a molecular weight marker, pBR322 digested with MspI.
Mlc and FruR act independently
A FruR binding site has been located upstream of the −35 sequence of promoter p1 (Ryu et al., 1995) (Fig. 1). It has been shown, at least in vitro, to produce a promoter switch from the major p1 promoter, p1a, to a weaker initiation site 8 bp downstream, p1b, which is under the control of CAP bound at the second CAP site (CAP1) (Fig. 1). The binding of FruR to its site prevented cAMP/CAP binding to the CAP1 site. In the absence of FruR, CAP can bind to this site and activate p1b (Ryu et al., 1995). S1 experiments using mRNA from fruR and the double mutant mlc, fruR compared with wild-type and single mlc mutant strains confirmed this observation; the minor p1b transcript is enhanced in the fruR strains (Fig. 2C, lanes 2 and 4). The fruR mutation had no effect on the mlc induction of p0 (lanes 3 and 4), and mlc did not affect the expression of p1a or p1b. Comparing the expression of ptsH in the mutant strains using the ptsH–lacZ fusion shows that the fruR mutation has only a small effect on expression in either the mlc or wild-type background (Table 1A). There was, however, a small induction by fructose in both fruR+ and fruR strains (see below). The range of regulation produced by Mlc is quantitatively more important than that of FruR.
Transport of glucose and other PTS sugars induces ptsH and ptsG expression
There are several indications, as described above, that Mlc controls genes involved in glucose metabolism and that growth on glucose seems to generate the inducing signal to relieve Mlc repression of ptsG and ptsH. However, as reported previously (Decker et al., 1998; Plumbridge, 1998a), we were unable to detect any common glucose derivative that could displace Mlc from its binding sites in vitro. It has been observed previously that growth on glucose-6-phosphate (G6P) did not induce ptsH expression, whereas the addition of α-methylglucoside (αMG), a non-metabolizable glucose analogue that is taken up by ptsG, does produce induction (De Reuse and Danchin, 1991). These results were confirmed for both ptsH–lacZ and ptsG–lacZ expression (Fig. 4). Neither G6P nor gluconate (Glt) produce significant induction of either gene. This is further evidence that the inducer is not derived from an intracellular glucose metabolite. Glc6P is taken up via a permease encoded by the uhp operon, producing intracellular G6P, which is also the product of the transport of glucose by the PTS. G6P is metabolized by the glycolytic Embden–Meyerhof pathway in E. coli, while gluconate is taken up by one of several permeases and then phosphorylated to give gluconate-6-P, which is metabolized via the pentose–phosphate or Entner–Doudoroff pathways (reviewed in Fraenkel, 1996). As neither of these carbon sources produces any significant induction of ptsH or ptsG expression (Fig. 4), it is difficult to envisage how a glucose-specific metabolite could be produced intracellularly to displace Mlc from its operators.
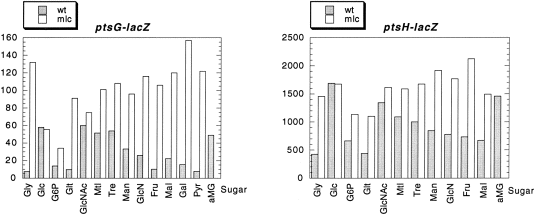
. Relative levels of ptsG–lacZ and ptsH–lacZ expression during growth on different carbon sources. The histograms give the relative expression levels of the two fusions in Miller units in JM101 (shaded bars) and IBPC1012 (open bars) with the different sugars shown on the horizontal axis. aMG = 0.2% Gly plus 0.1% α-methylglucoside.
In agreement with the idea that transport via the PTS is important for the induction of ptsG and ptsH expression, growth on various other PTS sugars besides glucose, in particular N-acetylglucosamine (GlcNAc), mannitol (Mtl) and trehalose (Tre), produces significant induction of both ptsG and ptsH expression in the mlc+ strain (Fig. .4). Two other PTS sugars, mannose (Man) and glucosamine (GlcN), produce rather lower levels of induction in expression in the mlc+ strain, while fructose has no effect on ptsG expression but does give a small increase in ptsH, which could be partly assigned to the effect via FruR (although it should be noted that fructose seems to produce some induction of ptsH–lacZ even in the fruR strain; Table 1A). Notably, the ‘good’ PTS sugars, which allow growth rates similar to glucose, GlcNAc, trehalose and mannitol, resulted in induction of both ptsG and ptsH that was only slightly less than glucose. Non-PTS sugars, such as galactose or maltose (Mal), produced levels of expression more similar to, but generally a little higher than, that of growth on glycerol. These results are in agreement with those of Rephaeli and Saier (1980), who showed that growth on PTS sugars but not on non-PTS sugars increased HPr, EI and EIIGlc phosphorylation activities.
For all sugars, except glucose, the expression of the fusions is higher in the mlc strain compared with the wild type. The final level of expression in the mlc background can be correlated with the level of catabolite repression generated by the different sugars, with G6P producing the lowest values (high catabolite repression) (Epstein et al., 1975; Joseph et al., 1982; Ishizuka et al., 1993; 1994; Hogema et al., 1997).
In general, the pattern of induction and expression seen for ptsH and ptsG with the different carbon sources was very similar, even though ptsH has a high basal level, as a result of the p1 promoter. The overall conclusion would appear to be that the majority of the PTS carbon sources are capable of inducing the expression of both ptsG and ptsH. As it is the PTS sugars themselves that are the better inducers, the role of the PTS in this induction was investigated further.
Repression of ptsG and ptsH expression requires the cytoplasmic components of the PTS
Previously, De Reuse and Danchin (1991) have shown that a deletion of the chromosomal copy of the ptsHIcrr operon provoked a derepression of a ptsH–lacZ fusion on a plasmid. Likewise, Rephaeli and Saier (1980) have shown that a strain with a mutation in EI had enhanced levels of HPr and EIIGlc, as measured by a PEP-dependent phosphorylation assay. Testing a series of ptsH, ptsI and crr mutations confirmed these results for both ptsG and ptsH expression. In particular, the ΔptsHIcrr, ΔptsIcrr or ptsI mutations produced a similar level of derepression to the mlc mutation (Table 2). A mutation in ptsH (ptsH5; Bolshakova et al., 1979; Grübl et al., 1990) had a smaller effect, producing only partial induction. This could be either because the mutation is leaky or because it is partially replaced by the Fpr protein of the fructose PTS (Lux et al., 1995). The crr deletion alone had no effect. It has been shown, however, that the EIIA domain of EIICBANag, encoded by the nagE gene, is capable of replacing EIIAGlc, encoded by crr, in its transport properties (Vogler et al., 1988). The introduction of a nagE mutation (nagE467 or nagE::Km) or a deletion of the nagE-BACD operons in the crr strain produced a complete derepression of the ptsG and ptsH fusions. Thus, interrupting the phosphorylation chain from PEP via EI, HPr and EIIAGlc to EIICBGlc provokes a derepression of ptsG and ptsH expression. Subsequent introduction of an mlc mutation into the ΔptsHIcrr strains had no further effect (Table 2), strongly suggesting that the pts mutations are affecting regulation by mlc.

Induction of ptsG and ptsH expression requires EIICBGlc
Glucose induction of ptsH was not observed in a ptsG mutant strain, which was interpreted as the need for efficient glucose transport to produce induction (De Reuse and Danchin, 1991). In this work, the effect of two ptsG mutations, ptsG22 (gpt-2 in Curtis and Epstein, 1975) and ΔptsG::Cm, a complete deletion of the ptsG structural gene (Buhr et al., 1994), have been tested on ptsG and ptsH expression. Both mutations prevented induction by glucose and, rather more surprisingly, they also prevented induction by the other PTS sugars, GlcNAc (Table 3) and mannose, trehalose and mannitol (data not shown). The ptsG strains grow rather slowly on glucose using the manXYZ-encoded mannose PTS, but grow almost normally on the other PTS sugars. A mutation in nagE, the major GlcNAc transporter, decreased the growth rate on GlcNAc and eliminated induction by GlcNAc, but had no effect on induction by glucose. In this case, the loss of induction by GlcNAc could be caused by the inefficient transport of GlcNAc via the manXYZ-encoded transporter. However, this is not the case for the loss of induction by GlcNAc in the ptsG strains, which grow efficiently on GlcNAc. This is strong evidence that the PtsG protein has a positive role in induction and is not just necessary to provide an efficient transporter for glucose.

The lack of induction by glucose of the strains carrying the ptsG mutations can also be contrasted with that of strains carrying ptsH mutations during growth on glucose. Both the ptsH1 and the ptsH5 mutations decrease growth on glucose similarly to that of the ptsG mutations (doubling times of about 200 min). The ptsH1 mutation is known to be slightly leaky (Fox and Wilson, 1968), and it has no or very little effect on ptsG–lacZ expression during growth on glycerol. As described above, the ptsH5 mutation produces partial derepression of the ptsG fusion in glycerol media. Strains carrying either the ptsH1 or the ptsH5 mutation grow slowly on glucose and exhibit high expression of the ptsH and ptsG fusions (Table 3). These results imply that, although efficient PTS sugar transport is needed for induction, slowing down the rate of PEP-dependent phosphorylation does not, by itself, prevent induction by glucose and confirms the particular role of ptsG in the induction.
Mutations in ptsG counteract the induction produced by the ptsHIcrr mutations
Combining the ΔptsG::Cm mutation with the different ptsHI and crr mutations shows that the non-inducible phenotype of ΔptsG::Cm is dominant. The ptsG::Cm mutation not only prevented induction by glucose of both the ptsG–lacZ and the ptsH–lacZ fusions, but also eliminated the enhanced expression resulting from the presence of ptsH, ptsI or crr nagE mutations (Table 2). The ptsG22 mutation had an effect similar to the complete deletion of ptsG with all the derepressed strains, except the triple deletion ΔptsHIcrr. In a strain carrying the ΔptsHIcrr and the ptsG22 mutation, the expression of both ptsG–lacZ and ptsH–lacZ was still derepressed, whereas with the ΔptsHIcrr, ΔptsG strain, their expression was only slightly higher than basal expression. As there was a quantitative difference in the effects of the ptsG22 and the ΔptsG::Cm mutations, with the ptsG22 allele allowing a weak positive regulatory phenotype, the ptsG22 mutation was studied further. The mutation was sequenced from the chromosome and determined to be a 4 bp deletion near the middle of the protein, which replaced amino acids 220–477 of the native protein with an out-of-phase tail of 63 amino acids from the + 1 reading frame (Fig. 5). The ptsG22 deletion is located in a region of the protein predicted to form a large cytoplasmic loop between membrane-spanning helices 6 and 7 of EIIC (Buhr and Erni, 1993). The ptsG22 allele is thus expected to produce a truncated protein consisting of six of the eight transmembrane helices of IICGlc.
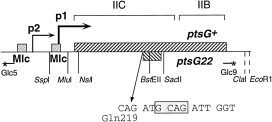
. The ptsG gene and location of the ptsG22 mutation. The ptsG gene is expressed from two promoters, p1 and p2, and controlled by two Mlc operators. The relative locations of the IIC and IIB domains of the protein are indicated. The ptsG22 mutation is the deletion of 4 bp (shown by the shaded box) after amino acid Gln-219. It produces a truncated protein with an out-of-phase tail of 63 amino acids (shown by backward hatching). The oligonucleotides Glc5 and Glc9 are shown with an asterisk at their 5′ end. Only relevant restriction enzyme sites are indicated. Sites indicated by dotted lines are derived from pBR322 vector sequences.
Effect of excess PtsG on ptsG expression
De Reuse and Danchin (1991) argued that the inducing signal was an increase in the amount of unphosphorylated EIIBCGlc produced as a result of glucose transport. They showed that a multicopy plasmid expressing PtsG led to an increased expression of ptsH–lacZ. Repeating their experiment with the ptsG–lacZ fusion confirmed their result, but only when ptsG is expressed from its own promoter (e.g. pMaG, Table 4). When the ptsG promoter was replaced by the lac promoter as in pTZ(PtsG), no effect on ptsG–lacZ expression was observed. Moreover, a plasmid just containing the ptsG promoter region, including the Mlc operator (SspI–NsiI, Fig. 5), also enhanced ptsG–lacZ expression, showing that the induction results from an operator titration effect displacing Mlc from its chromosomal locations. Thus, excess PtsG per se does not appear to enhance ptsG–lacZ expression; however, it is not known whether the PtsG overproduced from a plasmid is fully or partially phosphorylated.

PtsG on a plasmid, as expected, does complement the lack of PtsG in the ΔptsHIcrrΔptsG background, producing a reasonably high level expression of ptsG–lacZ (Table 4). Similarly, the ptsG22 allele, when overproduced from a plasmid, enhanced ptsG–lacZ expression in the ΔptsHIcrrΔptsG strain (Table 4), which is consistent with its effect when present on the chromosome. To investigate how the ptsG22 allele could complement the ΔptsG in the presence of ΔptsHIcrr, two control experiments were performed. One hypothesis was that, as in the case of EIICBANag complementation of EIIAGlc defects (Vogler et al., 1988; see above), there could be some complementation between the truncated PtsG22 protein and EIICBANag encoded by nagE. However, the introduction of the ΔnagEBACD mutation did not eliminate the increased expression caused by pTZ(PtsG22) (Table 4). (It is interesting that the ΔnagEBACD mutation did slightly reduce the basal level of expression of the fusion in the ΔptsHIcrr, ΔptsG background, suggesting that the chromosomal copy of NagE was responsible for the remaining low level of activation in this strain.) To check whether complementation was really caused by the truncated PtsG22 protein, two deletions were made within the ptsG22 plasmid. One removed a large region internal to the truncated protein (NsiI–BstEII, Fig. 5) to give pTZ(PtsG22ΔIIC), while a second removed DNA from 3′ of the mutation (SacII–ClaI, Fig. 5), giving pTZ(PtsG22ΔIIB). While deletion of the DNA corresponding to the truncated protein had little effect on the expression, removal of the downstream DNA eliminated the enhanced expression (Table 4). This shows that it is the 3′ region of DNA (after the PtsG22 termination codon but including all the EIIBGlc region) that is responsible for the increased expression. A possible explanation is that there is some translational restart (there are several in-phase Met codons to act as potential translational initiation sites) producing a polypeptide carrying the IIBGlc domain.
Discussion
Comparison of the glucose induction and Mlc repression of ptsH p0 and ptsG
Both ptsH and ptsG are transcribed from two promoters. For ptsG, the upstream promoter (p2) is much weaker than the major downstream promoter (p1), and both p1 and p2 promoters seem to be regulated by Mlc (Plumbridge, 1998a). There are Mlc binding sites upstream of both ptsG promoters, covering the −10 and + 1 region of p1 and the −35 region of p2. A single Mlc site is located adjacent to the ptsH p0 promoter, covering + 1 to + 23 relative to the initiation site. This is a similar location for Mlc binding to that in the malT and mlc operons (Decker et al., 1998). For ptsH, the two promoters, p0 and p1, are of similar strength, and they are differently and independently regulated.
The presence of glucose or an mlc mutation enhances the expression of both ptsG p1 and ptsH p0 promoters. Overall, as measured by the ptsH–lacZ fusion, the factor of induction of ptsH by mlc or glucose is only three- to fourfold compared with up to 20-fold for ptsG–lacZ. The lower factor of induction results from the constitutive expression from the ptsH p1 promoter. Both promoters are essentially inactive in the absence of cAMP/CAP; their transcripts are only detected in crp+cya+ strains. Despite the reduction in cAMP and CAP levels caused by growth on glucose (Epstein et al., 1975; Joseph et al., 1982; Ishizuka et al., 1994; Tagami et al., 1995), there is still sufficient cAMP/CAP in a glucose-grown culture to stimulate the expression of these two promoters. There is an interesting difference in the glucose-induced levels of the two genes. For ptsG, glucose induction corresponds to 40% of the expression observed in the mlc strain grown on glycerol. However, in the case of ptsH, growth of the wild-type strain on glucose results in the same level of ptsH–lacZ expression in the mlc strain grown on glycerol. This means that the cAMP/CAP concentration in a glucose-grown culture can support a higher level of ptsH p0 expression than ptsG. Two CAP binding sites are located in the ptsH regulatory region (Figs 1 and 3), and neither appears to be of high affinity, although some co-operativity was detected in their binding (De Reuse et al., 1992; Ryu et al., 1995). Normally, one might expect that weak binding sites should be more sensitive to changes in cAMP/CAP concentrations. The upstream site, CAP0, is of higher affinity and has been shown to be necessary for the induction of ptsH p0 (De Reuse et al., 1992), but the second site could perhaps contribute to the activation, as has been shown for artificial promoter constructs carrying two CAP binding sites (Joung et al., 1993; Busby et al., 1994). An alternative explanation could be that cAMP/CAP has a second role, e.g. controlling the expression of another gene involved in ptsH expression.
It is interesting to note that, recently, the gapA and gapB pgk operons, encoding glyceraldehyde 3-P dehydrogenase, erythrose 4-P dehydrogenase and phosphoglycerate kinase, have been shown to be induced by glucose in a EIICBGlc-dependent manner (Charpentier et al., 1998). As two of these genes are involved in the degradation of glucose, it raises the question of whether these glycolytic genes are also controlled by Mlc. However, inspection of the DNA sequences in the promoter regions of these genes shows no obvious sequences homologous to the known Mlc binding sites. It is of obvious interest to determine whether Mlc is responsible for all glucose induction phenomena in E. coli or whether other mechanisms exist.
Relative roles of Mlc and the PTS in regulating the expression of ptsHI and ptsG
Mutations in ptsHIcrr and ptsG have opposite effects on the expression of ptsG and ptsH: any mutation interrupting the PEP-dependent phosphorylation chain via EI, HPr and EIIAGlc (ΔptsHIcrr) causes high expression, while ptsG mutations result in the loss of both inducibility by glucose and constitutive expression caused by the ptsHIcrr mutations. As both ptsG and ptsH expression is affected in the same way by these mutations, it is extremely likely that it is the same regulatory mechanism affecting both genes. Mlc appears to be the ultimate regulator, as in all genetic backgrounds tested, mlc mutations produce high expression of both ptsG and ptsH p0. The effect of combining ΔptsHIcrr and mlc mutations is quantitatively the same as either alone, i.e. their inducing effects are not additive, which should be the case if they were affecting alternative pathways. Moreover, overexpression of Mlc from a multicopy plasmid reduces the high level of expression of ptsG–lacZ in the ΔptsHIcrr background, although not to such a low level as it does in an mlc strain (from 90 units to 5 units rather than 0.5 units, cf. Plumbridge, 1998a). This suggests that excess Mlc, from the plasmid, cannot completely overcome the inducing signal generated by the ΔptsHIcrr mutation.
Thus, three factors have so far been identified in the induction of ptsG and ptsHI expression: the PEP-dependent phosphorylation of the central PTS components, PtsG (EIIBCGlc) and the transcriptional regulator Mlc. Moreover, they exhibit a distinct hierarchy in their action: mlc is dominant over ptsG, which is dominant over ptsHIcrr.
What is the inducing signal that displaces Mlc and activates ptsG and ptsH expression?
For most specific transcriptional regulators, the co-activator or inducer is a low-molecular-weight metabolite related to the products of the regulated genes, e.g. for the mal regulon, the co-activator of MalT is maltotriose (Raibaud and Richet, 1987). In the case of Mlc, it has not yet been possible to identify any signalling molecule and, as described in the Results, the signal does not appear to be a simple metabolite of glucose. At the moment, it seems likely that growth on glucose is inducing ptsG and ptsH expression by relieving Mlc repression but, in the absence of the identification of the inducing signal between glucose and Mlc, this remains an assumption. A rather surprising characteristic is that induction is not restricted to growth on glucose, but other PTS sugars, notably GlcNAc, mannitol and trehalose, are also strong inducers. The induction of ptsG, as well as that of ptsHI, by these other PTS sugars was unexpected in the sense that, although all PTS sugars require HPr and EI (the gene products from the ptsHI operon) for their uptake, they are not transported by PtsG, and so its induction is not necessary for their efficient use. One interpretation of these observations is that Mlc is a regulator for the PTS, rather than just glucose specific. Alternatively, it underlines the importance of glucose as the major substrate of the PTS. The fact that induction of ptsG and ptsHI expression occurs during growth on glucose and in a ΔptsHIcrr strain, i.e. under conditions that should lead to the accumulation of non- phosphorylated EIICBGlc, strongly suggests that the non-phosphorylated form of EIIBCGlc (PtsG) is involved in the induction process (Fig. 6).
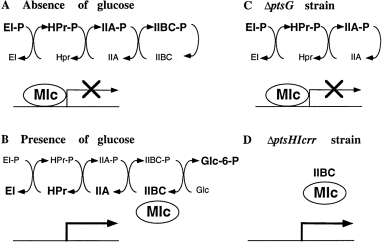
. A scheme for the regulation of Mlc-controlled promoters. In the absence of glucose (A), Mlc binds to its operators and represses expression. The proteins of the PTS cascade (EI, HPr, EIIAGlc and EIIBCGlc) are predominantly in the phosphorylated form, as indicated by the heavy type. In the presence of glucose (B) or in the absence of EI, HPr and EIIA (ΔptsHIcrr strain) (D), the Mlc-controlled genes are expressed. Under these conditions, the PTS proteins present are expected to be predominantly non- phosphorylated. In the absence of EIIBCGlc (ΔptsG) (C), Mlc-controlled genes are repressed and non-inducible by glucose. The expression of Mlc-controlled genes seems to be correlated with the presence of non- phosphorylated EIIBCGlc (encoded by ptsG) and might be explained by a physical interaction between EIICBGlc and Mlc.
It should be noted that GlcNAc induction of ptsG and ptsH is not the same as GlcNAc induction of the divergent nagE-BACD operon necessary for GlcNAc metabolism. These genes are controlled by NagC binding to operators that overlap the nagE-B promoters. The inducer, which prevents NagC from binding to its operators, has been shown to be GlcNAc-6-P (Plumbridge, 1991). Despite the fact that NagC is homologous to Mlc and that binding of NagC to both the ptsG and the ptsH operators can be detected by DNAse I footprinting in vitro, there is no effect of a nagC mutation on the expression of either ptsG or ptsH (Table 2). GlcNAc induction of ptsG and ptsH requires both a functional GlcNAc transporter encoded by nagE and an active ptsG gene. The former is presumably required to sustain a sufficiently rapid growth on GlcNAc, which is not achievable via the alternative transporter encoded by manXYZ. The requirement for a wild-type ptsG gene in GlcNAc induction of ptsG and ptsH expression is further evidence for the role of PtsG as a positive regulator.
What is the mechanism of positive regulation by PtsG?
De Reuse and Danchin (1991) proposed a signal transduction mechanism to explain the need for an active EIICBGlc to activate ptsH expression in glucose. The experiments described here have confirmed and extended their observations and have identified Mlc as a likely candidate for the effector molecule. They noted a weak homology between the C-terminal IIB domain of PtsG and the sensor kinases of the so-called two-component regulatory systems and proposed that PtsG interacted with an unidentified effector molecule. However, as Mlc shows no homology to any of the known effector components of two-component systems, e.g. OmpR, PhoB, NtrC, this would seem to exclude a classical two-component-type regulatory mechanism.
Another potentially interesting analogy exists between the pattern of induction observed for ptsG and ptsH described here and that of the PTS operons regulated by transcriptional antitermination mechanisms in E. coli (bgl) and Bacillus subtilis (sacPA, sacB, bgl and ptsG) (reviewed by Rutberg, 1997) and the lev operon in B. subtilis regulated by the LevR activator. The specific antitermination proteins, BglG, SacT, SacY, LicT and GlcT, and the LevR activator undergo reversible phosphorylation by their corresponding EII protein in the absence of a transportable sugar (reviewed in Stülke et al., 1998; see also Chen et al., 1997; Martin-Verstraete et al., 1998). The result of this phosphorylation is the inactivation of the antiterminator or the transcriptional activator function of the proteins, so that the sugar utilization genes are not induced. Thus, PTS-dependent phosphorylation is known to control the activity of several PTS operons in B. subtilis and the bgl operon in E. coli. However, Mlc does not contain the conserved histidine-containing region called a PTS regulation domain (PRD) that is the target of the EII-dependent phosphorylation (Stülke et al., 1998). Another significant difference is that null mutations affecting the EIIBA domains of the sugar transporter in these PRD-dependent regulators produce constitutive expression, but ptsG mutations are non-inducible in E. coli.
Nevertheless, the fact that mutations interrupting the phosphorylation chain from PEP to EIIBCGlc at any point (EI, HPr or EIIA) provoke derepression suggests strongly that PTS-dependent phosphorylation is important for induction and would implicate the soluble IIB domain of PtsG, which contains Cys-421 phosphorylated by IIAGlc, in the regulatory cascade. The analysis of the ptsG22 mutation seemed to argue against this idea. It exhibited a weak PtsG+ regulatory phenotype but encoded a truncated protein missing all of the IIB region. However, deletion analysis of this allele carried on a plasmid in fact showed that it is the DNA corresponding to the IIB domain of PtsG that is essential for the residual regulation. A plausible explanation is that there is some low-level translational reinitiation occurring within the ptsG gene, which produces a polypeptide including the IIB domain. In the absence of any evidence for phosphate transfer to Mlc, an alternative model can be proposed to explain the role of PtsG in induction. An intriguing possibility is that there is some physical interaction between PtsG and Mlc dependent upon the phosphorylation state of the EIIBGlc (see Fig. 6 for a model). In this case, interaction between Mlc and PtsG would sequester Mlc to the cytoplasmic membrane and prevent it binding to its chromosomal operators. Some evidence in favour of this hypothesis is that extracts of cells overproducing PtsG from a plasmid can inhibit the binding of Mlc to its target DNA operators in a bandshift assay. As this experiment has only been performed with cellular extracts, it does not exclude the involvement of other components. It does, however, provide a working hypothesis that is open to experimental analysis.
Finally, it should be mentioned that there are precedents for the involvement of transport proteins in controlling the activity of transcription factors. It has been shown recently that MalK, a component of the ABC-type transporter for maltose in E. coli, interacts physically with MalT to downregulate its transcriptional activity (Panagiotidis et al., 1998).
Experimental procedures
Bacteriological methods
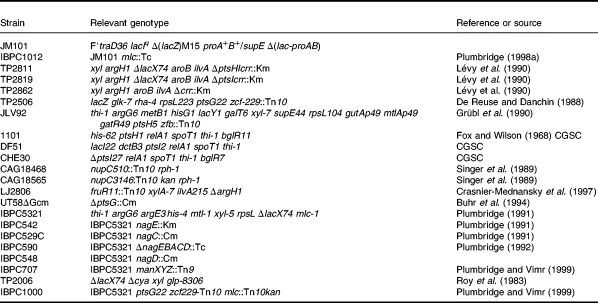
The bacterial strains used are listed in Table 5. The effect of different mutations on the expression of ptsG–lacZ or ptsH–lacZ fusions was tested in the JM101 background. Mutations inactivating genes by the insertion of an antibiotic resistance gene or transposon were introduced into JM101 carrying the fusions on λ lysogens by P1vir transduction, selecting for the antibiotic resistance. Point mutations in genes were introduced by P1 transduction selecting for an adjacent marker. The markers used were: for ptsG22, zcf229::Tn10; for ptsH1, ptsI2 and ptsI27, nupC::Tn10 or occasionally nupC:: Tn10kan; for ptsH5, zfb:Tn10; for nagE467, zbf507::Tn10 or nagD::Cm. The presence of the ptsH or ptsI mutations was detected by loss of growth on mannitol (and reduced growth on glucose). The presence of the ptsG22 mutation produces slightly slower growth on glucose minimal medium plates, and candidates were confirmed by introducing the manXYZ:: Tn9 allele, which eliminates nearly all growth on glucose. The very slow remaining growth on glucose in the ptsG, manXYZ strain results from glk-encoded glucokinase (Curtis and Epstein, 1975). The presence of a nagE mutation, which slows down growth on GlcNAc, was confirmed by introducing the manXYZ::Tn9 mutation, which eliminated all growth on GlcNAc. Mutations in manXYZ, nagD, nupC or the other transposon marker locations had no effect on either ptsG–lacZ or ptsH–lacZ expression.
Construction of a ptsH–lacZ fusion
A ptsH–lacZ protein fusion was made by inserting the polymerase chain reaction (PCR)-generated Pts1–Pts3 fragment (Fig. 1) using Pwo thermoresistant polymerase and pDIA3274 as template (De Reuse et al., 1992) into pRS414 digested with SmaI. The fusion junction is at Gly-13 in HPr. The sequence of the ptsH insert was verified by sequencing, and the fusion was transferred to λRS45 (Simons et al., 1987; Plumbridge, 1998a). Bacteriophage λ carrying the fusion were used to lysogenize bacteria at low multiplicity, and several independent lysogens were analysed to identify monolysogens. The ptsG–lacZ fusion has been described previously (Plumbridge, 1998a). β-Galactosidase activities were measured in bacteria growing at 30°C in minimal MOPS media (Neidhardt et al., 1974) with 0.2% sugar as carbon source except glycerol, which was used at 0.4%, as described previously. Cultures with plasmids included 0.5% casamino acids, 0.5 mg ml−1 ampicillin and 1 mM IPTG when necessary to induce expression from the lac promoter on a plasmid. Aliquots to be tested were removed at four points during the exponential growth phase, and β-galactosidase activities were measured as described previously (Miller, 1972).
S1 analysis and DNAse I footprinting
The probe used for the S1 mapping of ptsH transcripts was the Pts1–Pts3 PCR-synthesized fragment labelled at the Pts3 oligo with [γ-32P]-ATP and polynucleotide kinase. RNA preparations, hybridization and S1 analysis were carried out as described previously (Plumbridge, 1998a). The probe used to locate the Mlc binding site was the Pts1–Pts2 PCR-synthesized fragment with the Pts2 oligonucleotide labelled with [γ-32P]-ATP and polynucleotide kinase. Extracts of strains overproducing Mlc, complex formation and DNase I digestion were as described previously (Plumbridge, 1998a).
PtsG plasmids
The pMaG plasmid expressing wild-type PtsG has been described previously (Buhr et al., 1992). Plasmids containing a similar DNA fragment and expressing the wild-type and ptsG22 mutant allele were made by PCR, using Pwo, a thermoresistant polymerase with increased fidelity (Boehringer Mannheim) on total chromosomal DNA from wild type (JM101) and a ptsG22 mutant strain (IBPC1000). The oligonucleotides used were Glc5, upstream of ptsG (Plumbridge, 1998a), and Glc9 (ATCTGGCTGCCTTAGTCTC), located 40 nucleotides after the 3′ of the ptsG structural gene (Fig. 5). The Glc5 to Glc9 fragments were digested by SspI and inserted into pBR322 digested with EcoRV to give pBR(PtsG) and pBR(PtsG22). Both pMaG and the pBR(PtsG) plasmids carry the ptsG p1 promoter and a single Mlc binding site. Plasmids expressing PtsG and PtsG22 under the control of the lac promoter were made by inserting the MluI–EcoRI fragment (Fig. 5) (MluI was made blunt with T4 DNA polymerase) into pTZ19R digested with SmaI and EcoRI to give pTZ(PtsG) and pTZ(PtsG22). Deletions within the IIC domain [ΔNsiI–BstEII, pTZ(PtsG22ΔIIC)] and the IIB domain [ΔSacII–ClaI, pTZ(PtsG22ΔIIB)] were made by cutting with the indicated restriction enzymes, blunting the sites with T4 DNA polymerase and religation. The deletion within the IIC domain is not in phase and does not create a IIB protein expressed from the ptsG initiation codon.
To identify the mutation of the ptsG22 allele, PCR- generated fragments covering the whole ptsG gene from wild type and mutant were sequenced using the ThermoSequenase radiolabelled terminator cycle sequencing kit (Amersham Pharmacia) and a series of internal oligonucleotide primers. The presence of the mutation was confirmed on the pBR(PtsG22) plasmid.
Acknowledgements
I would like to thank Hilde de Reuse, Bernhard Erni, Joseph Lengeler and the CGSC for their generous gifts of strains and plasmids. I am also very grateful to Annie Kolb, Hilde de Reuse and Josef Deutscher for many useful discussions.


