The effects of chamber pressurization on soil-surface CO2 flux and the implications for NEE measurements under elevated CO2
Abstract
Soil and ecosystem trace gas fluxes are commonly measured using the dynamic chamber technique. Although the chamber pressure anomalies associated with this method are known to be a source of error, their effects have not been fully characterized. In this study, we use results from soil gas-exchange experiments and a soil CO2 transport model to characterize the effects of chamber pressure on soil CO2 efflux in an annual California grassland. For greater than ambient chamber pressures, experimental data show that soil-surface CO2 flux decreases as a nonlinear function of increasing chamber pressure; this decrease is larger for drier soils. In dry soil, a gauge pressure of 0.5 Pa reduced the measured soil CO2 efflux by roughly 70% relative to the control measurement at ambient pressure. Results from the soil CO2 transport model show that pressurizing the flux chamber above ambient pressure effectively flushes CO2 from the soil by generating a downward flow of air through the soil air-filled pore space. This advective flow of air reduces the CO2 concentration gradient across the soil–atmosphere interface, resulting in a smaller diffusive flux into the chamber head space. Simulations also show that the reduction in diffusive flux is a function of chamber pressure, soil moisture, soil texture, the depth distribution of soil CO2 generation, and chamber diameter. These results highlight the need for caution in the interpretation of dynamic chamber trace gas flux measurements. A portion of the frequently observed increase in net ecosystem carbon uptake under elevated CO2 may be an artifact resulting from the impact of chamber pressurization on soil CO2 efflux.
Introduction
Soil CO2 efflux is known to play a major role in the terrestrial carbon cycle. At the global scale, the annual flux of CO2 from soils to the atmosphere is estimated to average 68 Pg C y–1 ( Raich & Schlesinger 1992), roughly 10 times the current annual contribution from fossil fuel combustion ( Andres et al. 1996 ). Soil-surface CO2 flux measurements have been widely used to construct ecosystem C budgets (e.g. Singh et al. 1988 ; Norman et al. 1992 ; Hungate et al. 1997 ) and, when used as a measure of the metabolic activity of soil microbes and plant roots, to characterize the environmental controls over soil respiration (e.g. Kucera & Kirkham 1971; Gupta & Singh 1981; Lloyd & Taylor 1994). Due to the methodological problems associated with measuring soil CO2 flux, however, there is considerable uncertainty surrounding these data.
Several techniques have been used to measure soil-surface CO2 flux including soil CO2 profile, micrometeorological, and static and dynamic chamber methods. Although the soil CO2 profile technique and micrometeorological techniques such as eddy covariance avoid confounding chamber effects, their application has generally been limited by a combination of cost and methodological requirements ( de Jong et al. 1979 ; Baldocchi & Meyers 1991; Verma et al. 1992 ). In particular, the soil CO2 profile technique requires the estimation of soil transport coefficients, while eddy covariance typically requires specific atmospheric conditions and an estimation of above-ground plant respiration.
A majority of soil CO2 flux studies have relied on the static chamber technique because it is relatively inexpensive and easy to employ ( Gupta & Singh 1981; Bowden et al. 1993 ; Toland & Zak 1994; Marra & Edmonds 1996). In this method, CO2 diffusing from the soil is absorbed inside a closed chamber using either an alkali solution (e.g. KOH, NaOH) or soda lime ( Reinke et al. 1981 ; Edwards 1982). Although this technique offers some practical advantages, several studies have shown that it tends to overestimate CO2 flux at low flux rates and severely underestimate CO2 flux at high flux rates ( Rochette et al. 1992 ; Nay et al. 1994 ; Jensen et al. 1996 ). The bias appears to be driven by the chamber’s impact on the CO2 concentration gradient at the soil–atmosphere interface ( Nay et al. 1994 ). The static chamber gas chromatograph technique described by Raich et al. (1990) uses shorter incubation times and may eliminate some of this bias by minimizing changes in the CO2 concentration gradient.
Dynamic chamber techniques have also been used to measure soil CO2 efflux in numerous studies ( Kucera & Kirkham 1971; Ewel et al. 1987 ; Hall et al. 1990 ; Norman et al. 1992 ; Luo et al. 1996 ). Dynamic chambers are generally considered more accurate than static methods ( Cropper et al. 1985 ; Rochette et al. 1992 ; Nay et al. 1994 ), and can be operated as either closed or open systems. In closed dynamic systems, air is circulated in a closed loop between the chamber head space and an infrared gas analyser (IRGA). Soil CO2 efflux is then calculated using the difference in CO2 concentration between the beginning and end of the measurement period. In open dynamic systems, ambient air is passed continuously through the chamber head space, and soil CO2 efflux is calculated using the difference in CO2 concentration between air entering and leaving the chamber. Open systems are typically preferred for continuous measurements over periods of hours to days because the flow of outside air into the system maintains near ambient chamber temperature and CO2 concentration.
Early studies using open dynamic chambers reported a correlation between chamber flow rates and measured soil CO2 efflux ( Golley et al. 1962 ; Reiners 1968). Later studies found significantly lower soil CO2 efflux when air was blown versus drawn through the chamber ( Kucera & Kirkham 1971; Kanemasu et al. 1974 ). Kanemasu et al. (1974) noted that chamber pressure was greater than ambient when air was blown through the chamber and less than ambient when air was drawn through the chamber. This led them to suggest that pressure differences of several Pascals were large enough to drive changes in both the advective and diffusive fluxes of soil CO2. In a similar study, Nakayama & Kimball (1988) reported substantial decreases in soil CO2 concentration and a 50–80% reduction in soil CO2 flux at chamber pressures of several Pascals above ambient. To minimize this differential pressure, some open dynamic systems simultaneously blow and draw air through the chamber at equal flow rates ( Cropper et al. 1985 ; Ham et al. 1995 ). Recent work by Fang & Moncrieff (1996), however, has shown that it is extremely difficult to eliminate pressure gradients between the air inside and outside the chamber, even when flow rates are balanced using a micromanometer. Despite the implications of these findings for dynamic chamber flux experiments, the size of these effects and the mechanisms behind them have not been thoroughly described.
In this paper, we present data from soil gas-exchange experiments and model simulations designed to systematically characterize the effects of greater than ambient chamber pressure on soil-surface CO2 flux. We discuss the mechanisms behind these effects and also the implications of our findings for soil and whole-ecosystem gas-exchange results. We focus, in particular, on net ecosystem CO2 exchange results from elevated CO2 experiments. In doing so, we hope to provide a detailed framework that can be used to identify and possibly correct a potential bias in dynamic chamber flux data.
Methods
Field site
We carried out our experiments at Stanford University’s Jasper Ridge Biological Preserve (37°24′N 122°13′W) as part of the Jasper Ridge CO2 Experiment. Field CO2 fumigations began in 1991 in adjacent sandstone and serpentine grasslands using polyethylene open-top chambers (OTCs) measuring 1 m tall × 0.64 m diameter. Ambient air, or a mixture of tank CO2 and ambient air, was forced through the OTCs at 3500 L min–1 (i.e. 10 air changes per minute) using blowers located at the base of each chamber. Additional information on project infrastructure, species, etc. can be found in Field et al. (1996) . The sandstone site was used for the experiments and simulations described in this paper, and is located on a loamy, Lithic Xerochrept soil (Dibble Variant series); bulk density for the upper 30 cm of the soil profile averages 1.35 g cm–3.
Soil CO2 flux measurement
We measured soil-surface CO2 flux using a modified LI 6200 closed gas-exchange system (LI 6200; LI-COR Inc., Lincoln, NE) similar to the design described by Norman et al. (1992) . The system utilizes an infrared gas analyser (IRGA) and an open-ended cylindrical soil respiration chamber (SRC) measuring 19.9 cm long × 4.4 cm in diameter. Air is pumped into the bottom of the SRC and drawn out the top at a rate of roughly 30 mL s–1. The SRC has a surface measurement area of 20.3 cm2, and is equipped with a 11.4 cm long × 0.3 cm internal diameter balance tube to allow for pressure equilibration between the air inside and outside the SRC. We calculated soil-surface CO2 flux by multiplying the system volume by the change in CO2 concentration per unit time and then dividing by ground surface measurement area.
We measured soil-surface CO2 flux inside a single ambient CO2 OTC on 20 March, 5 May, and 17 May 1996. In November 1995, we inserted a 5 cm long × 5.1 cm diameter PVC collar to a depth of 3 cm in the soil at the centre of this OTC to provide a good seal with the base of the SRC. To look at the effects of OTC pressure on soil CO2 efflux, we made flux measurements first at ambient pressure and then at progressively higher chamber pressures over the course of several hours. We repeated ambient pressure flux measurements at the end of the pressure series. By restricting the air flow leaving the top of the OTC and varying the blower flow into its base, we were able to generate pressures inside the OTC ranging from 0 to 40 Pa above ambient. We measured the difference between ambient pressure and OTC pressure using a micro differential pressure sensor with a resolution of 0.5 Pa (MDPS MPM; Cambridge Accusense Inc., Shirley, MA). The MDPS is a thermistor based flow-through sensor which exhibits good temperature compensation between 15 and 30 °C. We used a single point pressure measurement at the soil surface immediately adjacent to the SRC to characterize OTC pressure; preliminary pressure measurements showed very little spatial variation within the OTC. To minimize the effect of OTC air flow on our pressure measurements, we oriented the pressure transducer’s inlet orifice perpendicular to the direction of air flow at the soil surface. Because the SRC is equipped with a pressure equilibration tube (see description above), we assumed that the pressure inside the SRC was equal to the pressure inside the OTC (i.e. use of the SRC to measure soil-surface CO2 flux does not introduce additional pressure artifacts).
At each pressure step, we made flux measurements with the SRC CO2 concentration just below, equal to, and just above the OTC CO2 concentration. This series of three measurements was made over a period of no more than 60 s and was repeated two times at each pressure step on 20 March, and three times at each pressure step on 5 May and 17 May. We made simultaneous measurements of soil-surface temperature and soil temperature at a depth of 7 cm. We measured 0–15 cm volumetric soil water content using the time-domain reflectometry (TDR) method ( Topp 1980); two 15 cm-long waveguides spaced 5 cm apart were installed vertically in the soil near the centre of the OTC and connected via coaxial cable to a TDR cable tester (1502C; Tektronix Inc., Beaverton, OR). Apparent waveguide length was converted to volumetric water content using an empirically determined calibration polynomial. Volumetric water content was then converted to water-filled pore space (WFPS) using a soil porosity of 0.45.
Whole-ecosystem CO2 flux measurement
We measured whole-ecosystem CO2 flux using an open gas-exchange system with an IRGA (LI 6262; LI-COR Inc., Lincoln, NE) in differential mode. OTCs were modified for whole-ecosystem gas-exchange measurements by adding a polyethylene lid fitted with a 0.3 m long × 0.03 m diameter PVC chimney and a closed loop air-to-air heat exchanger (HE-15; McLean Midwest, Brooklyn Park, MN). To obtain a measurable differential CO2 signal, we reduced flow into the OTC from 3500 to 330 L min–1 (i.e. roughly one air change per minute) by inserting a restriction into the tubing connecting the blower motor and chamber base. We calculated half-hourly averages of ecosystem CO2 flux by multiplying the inlet flow rate by the difference between inlet and outlet CO2 concentrations and then dividing by unit ground area. Net C uptake was calculated by integrating the flux measurements over time.
To look at the effect of greater than ambient chamber pressure on whole-ecosystem CO2 flux measurements, we switched three of six replicate ambient CO2 OTCs from a flow rate of 330 to 40 L min–1 midway through a week long gas-exchange run started on 25 April 1996. We made simultaneous measurements throughout the flux run of soil temperature at 7 cm depth and air temperature at 15 cm height in the low- and high-flow chambers. OTC pressure and 0–15 cm soil volumetric water content were measured at the end of the flux run.
Soil-gas transport model
We used the transport model STEAC (Simulation of the soil Transport and Emission to the Atmosphere of CO2) to simulate the effects of chamber pressure on the advective and diffusive fluxes of CO2 across the OTC soil–atmosphere interface. STEAC is a modified version of a transient, three-dimensional, finite-difference simulation package (named START) designed to predict radon flows in near-surface soils ( Riley et al. 1996 ).
STEAC applies a three-step procedure to predict the steady-state diffusive CO2 entry rate into the OTC. First, the soil-gas pressure and velocity fields in the soil adjacent to the chamber are computed. Second, STEAC combines the soil-gas velocity field and a CO2 mass balance equation to determine the CO2 concentration field in the soil. Finally, integrating the diffusive and advective CO2 flux across the soil surface bounded by the OTC gives the diffusive and advective entry into the chamber. These steps are outlined in the following three subsections (see Appendix 1 for definition of terms).
Soil-gas pressure and velocity fields
STEAC can simulate both Darcy and non-Darcy flows of soil-gas, as appropriate. For the cases considered here, the pressures imposed on the system result in flow rates within the linear regime, so Darcy’s law suffices to relate the pressure and velocity fields ( Riley 1996):
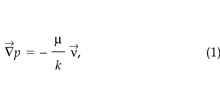
where p is the soil-gas disturbance pressure (Pa), ν→ is the darcy velocity (m s–1), k is the soil permeability (m2), μ is the dynamic viscosity (kg m–1 s–1), and —→ is the gradient operator (m–1).
We assume the soil-gas is incompressible since the disturbance pressures in the system are small relative to atmospheric pressure. This assumption gives the simplified continuity equation:
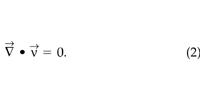
STEAC discretizes (1) and (2) with a modified SIMPLE algorithm ( Patankar 1980), and the pressure and velocity fields are calculated on staggered grids using an alternate direction implicit method. The solution procedure terminates when the computed pressure at each point changes fractionally by less than 10–6 over successive iterations. For this study we use a Cartesian, 2D, steady-state, finite-difference representation of the soil and OTC. The simulations apply boundary conditions of a zero normal soil-gas pressure gradient (no flow) at the two sides and the bottom of the soil block, and a fixed pressure on the soil surface. Two-dimensional simulations, although computationally efficient, do not accurately describe the dynamics of soil-gas movement in some systems (e.g. Healy et al. 1996 ). To test the appropriateness of a 2D model, we performed several 3D simulations of a rectangular flux chamber. We found essentially identical results indicating that in our system, 2D simulations do capture the physical processes responsible for the transport and efflux of CO2.
Soil-gas CO2 concentration field
Given the soil-gas velocity field, STEAC calculates the CO2 concentration field from the steady-state CO2 mass balance equation:
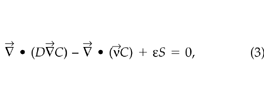
where C is the soil-gas CO2 concentration (μmol m–3), S is the CO2 generation rate into the soil-gas (μmol m–3 s–1), D is the molecular diffusivity of CO2 in air reduced for air-filled porosity and tortuosity (m2 s–1), and ε is the air-filled porosity of the soil (–). Riley (1996) describes the discretization of (1), (2), and (3) in more detail. The boundary conditions for the CO2 concentration field simulations also impose a zero normal gradient at the two sides and the bottom of the soil block; the CO2 concentration at the soil surface is held constant at 360 ppmv.
Diffusive and advective CO2 flux into the OTC
The diffusive CO2 flux, FD (μmol m–2 s–1), crossing the soil–atmosphere interface under the OTC is given by:
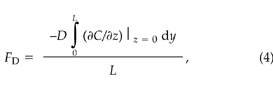
where z is the depth into the soil (m), y is the horizontal coordinate (m), and L is the horizontal dimension of the chamber (m).
The advective CO2 flux, FA (μmol m–2 s–1), crossing the soil–atmosphere interface is given by:
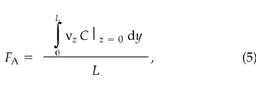
where νz (m s–1) is the vertical component of the darcy velocity at the soil surface. Equations 4 and 5 represent line averages since we are performing 2D simulations; 3D simulations would require an area average of the fluxes.
Model validation
The soil-gas pressure and velocity calculations of the model have been tested previously, as have the concentration calculations for the case of soil-gas radon transport ( Riley 1996; chapter 5). STEAC modifies the concentration calculations in START simply by removing the radioactive decay necessary to simulate radon transport. We tested STEAC against analytical solutions of steady-state and transient advective and diffusive CO2 transport in a 1D soil column. Excellent agreement was found between model predictions and analytical solutions. START has also been tested successfully against results from field experiments of soil-gas and radon entry into an experimental basement structure ( Fisk et al. 1992 ).
System characteristics and simulations
We simulated the effect of chamber pressure on the advective and diffusive fluxes of CO2 using a 6 m wide × 1.5 m deep soil block and a 0.64 m wide OTC. Additional simulations were also performed using chamber widths of 0.2, 1, and 2 m. The computational space is divided into 660 control volumes, with fine resolution grid spacing (1 cm × 1 cm) near the chamber transitioning to coarser spacing (80 cm × 80 cm) at the boundaries. The bottom boundary condition implies a water table depth of 1.5 m. The simulations considered chamber pressures ranging from – 1 Pa to + 50 Pa and soil permeabilities corresponding to WFPS values of 22, 36, 46, and 73%. We assumed that soil water content was constant within the simulated soil block.
Soil permeability decreases with increasing soil water content; this effect is often modelled with a multiplicative relative permeability, kr(–), i.e.:
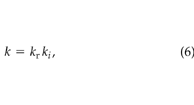
where ki (m2) is the soil permeability at the minimum value of liquid saturation. We took ki to be 2.7 × 10⁻¹⁰ m2, based on measurements taken at the site using the technique of Garbesi et al. (1993) . Wyllie (1962) gives the following simple method to estimate the relative permeability:
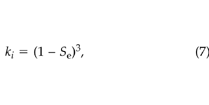
where Se is the effective liquid saturation (–), given by:
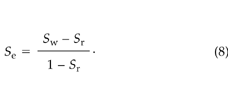
Here, Sw is the fractional WFPS and Sr is the minimum fractional WFPS (taken to be 0.11). Thus, kr = 0.69, 0.37, 0.23, and 0.027 for WFPS values of 22, 36, 46, and 73%, respectively. Applying (6) gives soil permeabilities at these WFPS levels of 1.9 × 10⁻¹⁰, 1.0 × 10⁻¹⁰, 6.3 × 10⁻¹¹, and 7.3 × 10⁻¹² m2, respectively.
We performed simulations using an exponentially decaying profile of CO2 generation with depth:

where S0 is the CO2 generation rate at z = 0 (μmol m–3 s–1) and d (m) defines the rate at which the generation rate decays with depth. For S0, we used a value of either 200 or 1400 μmol m–3 s–1 to generate low-flux and high-flux cases, respectively. For d, we assigned values ranging from 0.05 to 0.5 m. Simulated fluxes ranged from 0.5 to 6 μmol CO2 m–2 s–1 at the soil surface under ambient pressure conditions, representative of the range of typical values observed at the Jasper Ridge experimental site. Table 1 summarizes the input parameter values for the simulations carried out in this study.
| Simulation scenarios | S 0 (μmol m–3 s–1) | WFPS(%) | Permeability(m2) | d (m) | Width(m) | Pressure(Pa) |
|---|---|---|---|---|---|---|
| Effect of WFPS | 1400 | 22 | 1.9 × 10⁻¹⁰ | 0.1 | 0.64 | 0 to + 50 |
| 1400 | 46 | 6.3 × 10⁻¹¹ | 0.1 | 0.64 | 0 to + 50 | |
| 1400 | 73 | 7.3 × 10⁻¹² | 0.1 | 0.64 | 0 to + 50 | |
| Low vs. high flux | 200 | 22 | 1.9 × 10⁻¹⁰ | 0.1 | 0.64 | 0 to + 50 |
| 1400 | 22 | 1.9 × 10⁻¹⁰ | 0.1 | 0.64 | 0 to + 50 | |
| 200 | 46 | 6.3 × 10⁻¹¹ | 0.1 | 0.64 | 0 to + 50 | |
| 1400 | 46 | 6.3 × 10⁻¹¹ | 0.1 | 0.64 | 0 to + 50 | |
| Effect of decay constant | 1400 | 46 | 6.3 × 10⁻¹¹ | 0.05 | 0.64 | 0 to + 50 |
| 14001400 | 4646 | 6.3 × 10–116.3 × 10⁻¹¹ | 0.10.5 | 0.640.64 | 0 to + 500 to + 50 | |
| ‘Best-fit’ | 1400 | 22 | 1.9 × 10⁻¹⁰ | 0.5 | 0.64 | –1 to + 50 |
| 1400 | 36 | 1.0 × 10⁻¹⁰ | 0.2 | 0.64 | 0 to + 50 | |
| 1400 | 46 | 6.3 × 10⁻¹¹ | 0.09 | 0.64 | –1 to + 50 | |
| Effect of chamber width | 1400 | 36 | 1.0 × 10⁻¹⁰ | 0.2 | 0.20 | 0 to + 50 |
| 1400 | 36 | 1.0 × 10⁻¹⁰ | 0.2 | 1 | 0 to + 50 | |
| 1400 | 36 | 1.0 × 10⁻¹⁰ | 0.2 | 2 | 0 to + 50 | |
| Chamber barrier | 1400 | 46 | 6.3 × 10⁻¹¹ | 0.1 | 0.64 | 2 |
Results and discussion
Soil CO2 flux experiment
OTC pressure had a pronounced effect on soil-surface CO2 flux ( Fig. 1). Flux rates in Fig. 1 are normalized to the corresponding initial ambient pressure flux and plotted against chamber pressure in Pascals above ambient; the initial ambient pressure fluxes on 22 March, 17 May, and 5 May were 4.5, 3.7, and 1.4 μmol CO2 m–2 s–1, respectively. Soil-surface CO2 flux decreased as a nonlinear function of increasing chamber pressure; this decrease was not correlated with changes in soil temperature and became more pronounced in drier soils. Soil temperatures at the soil surface and at a depth of 7.5 cm varied by less than 3 °C over the course of each pressure series, and surface CO2 flux typically returned to its initial ambient pressure value within 2 h of applying and then removing the last pressure step (unpubl. data). With one exception, the coefficients of variation for the average flux values shown in Fig. 1 did not exceed 23%. WFPS on 22 March, 17 May, and 5 May, for the 0–15 cm depth increment, averaged 46, 36, and 22%, respectively (corresponding volumetric water content of 20, 16, and 9.8%). Figure 1 shows the impact of chamber pressure on soil CO2 efflux for these three soil water contents.
Fractional reduction in soil-surface CO2 flux vs. OTC pressure on March 20, WFPS = 46% (triangles), May 17, WFPS = 36% (squares), and May 5, WFPS = 22% (circles). Soil-surface CO2 flux values for each date are normalized to the initial ambient pressure flux value on that date. Chamber pressure is expressed as pressure above ambient pressure. Data are means of three flux measurements.
The results from this experiment are consistent with both the general patterns described by Kanemasu et al. (1974) and the significant reduction in soil CO2 flux reported by Nakayama & Kimball (1988) at pressures in the range of 1–4 Pa. Moreover, our results show that pressures of less than 1 Pa can also substantially reduce soil CO2 efflux. For the dry soil case shown in Fig. 1 (i.e. WFPS = 22%), a gauge pressure of 0.5 Pa reduced the measured soil CO2 efflux by roughly 70% relative to the control measurement at ambient pressure. Finding similar sensitivity, Fang & Moncrieff (1996) noted that accurate measurements of soil CO2 efflux might only be obtainable at chamber pressures within a few tenths of a Pascal of ambient. These are extremely small differential pressures; for comparison, a change of roughly 1 Pa in atmospheric pressure requires only a 10 cm change in altitude. The apparent correlation between the size of the fractional reduction at a given pressure and soil moisture supports Hutchinson & Mosier’s (1980) speculation that this type of error should be largest in dry soils (see below for discussion of mechanisms). In our study, soil CO2 efflux was entirely suppressed in dry soil at chamber pressures greater than 20 Pa above ambient. It was never entirely suppressed in wet soil, however, even at chamber pressures greater than 40 Pa above ambient.
Whole-ecosystem CO2 flux experiment
OTC pressure also had a pronounced effect on whole-ecosystem CO2 flux measurements ( Fig. 2). Increasing chamber pressure caused an apparent increase in ecosystem CO2 uptake during the day and an apparent decrease in ecosystem CO2 efflux at night. This result agrees well with data from our soil CO2 flux experiment. Net ecosystem CO2 flux values for the two sets of OTC flux chambers (sets #1 and #2) used in this experiment were similar for the first half of the flux run, but then diverged dramatically at 10.00 hours on 27 April when the flow rate for chamber set #1 was reduced from 330 L min–1 to 40 L min–1. Pressure in these low-flow chambers dropped from the operational value of 5.7 Pa to less than 0.5 Pa. Soil temperature at a depth of 7 cm and air temperature at a height of 15 cm were not affected by the reduction in chamber air flow.
Mean half-hourly net ecosystem CO2 flux in sandstone grassland in late April at high (circles) and low (squares) chamber pressure. Data are averaged over three replicate plots. At 10:00 h on April 27 (see arrow), chamber pressure in one set (set #1 in text) of flux chambers was reduced from 5.7 Pa (open circles) to less than 0.5 Pa (open squares). Mean half-hourly air temperature at 15 cm and soil temperature at 7 cm are shown for these chambers by the dotted and dashed lines, respectively. Chamber pressure for a second set (set #2 in text) of flux chambers (filled circles) was maintained at roughly 5.7 Pa throughout the flux run as a control. Air and soil temperature data for control chambers are not shown.
Integrating flux values for the 24-h period directly preceding the change in flow rate shows an apparent net C uptake of 4.1 and 3.7 g C m–2 for chamber sets #1 and #2, respectively. For the 24-h period following the change in flow rate, integrated flux values show a net C uptake of 0.5 and 3.8 g C m–2 for chamber sets #1 and #2, respectively. The apparent decrease in net C uptake for chamber set #1, from 4.1 to 0.5 g C m–2, is driven by the decrease in chamber pressure. As chamber pressure decreases towards ambient, soil CO2 flux increases, and the calculated net C uptake decreases towards its true value. Chamber set #2 was maintained at the operational pressure throughout the experiment and thus shows no change in net C uptake. These data demonstrate that the net C uptake values of 4.1, 3.7, and 3.8 g C m–2 are sizable overestimates.
Simulation results
Chamber pressurization effects on soil CO2 concentration and efflux.
Figure 3 illustrates the mechanisms acting to reduce the CO2 flux at the soil surface when the OTC is pressurized (in this and the following sections, results were obtained using a chamber width of 0.64 m unless otherwise stated). Figure 3(a) shows the soil CO2 iso-concentration lines for the high-flux case with a CO2 generation rate decay constant, d, of 0.5 m and zero overpressurization in the chamber; our high-flux soil CO2 profiles are similar to the experimental profiles described by Nakayama & Kimball (1988 ) and Castelle & Galloway (1990). Pressurizing the OTC generates an advective flow of air into the soil. Figure 3(b) shows the soil-gas streamlines and isobars for a soil permeability of 6.3 × 10⁻¹¹ m2 (WFPS = 46%) and an overpressurization of 1 Pa in the OTC. The advective flow of air flushes CO2 from the soil adjacent to the chamber, distorting the iso-concentration lines ( Fig. 3c). The result is a smaller CO2 gradient at the soil surface, and therefore a smaller diffusive flux across the soil–atmosphere interface (see eqn 4). There is also an advective flux of CO2 into the soil, but this flux has no effect on the chamber head space concentration because measurements are made at or near ambient CO2 concentration, and air flowing from the OTC into the soil is continually replaced with ambient air from outside the chamber. With increasing chamber pressure, there is a larger advective flow of air into the soil, a larger perturbation of the soil CO2 profile, and thus a larger reduction in diffusive flux across the soil–atmosphere interface. Experimental data from Nakayama et al. (1988) show similar changes in the soil CO2 profile with chamber pressurization.
(a) Normalized soil-gas CO2 iso-concentration lines with no overpressurization in the OTC. (b) Soil-gas streamlines and isobars for the case of a 1 Pa overpressurization in the OTC. For clarity, the streamlines are only shown on one side of the chamber. (c) Normalized CO2 iso-concentration lines for the case described in (b). Fig. 3(a), (b), and (c) correspond to the high-flux case with a WFPS of 46% and a CO2 generation decay constant of 0.5 m. The axes labelled Y and Z are defined as the horizontal distance and depth into the soil in meters, respectively. Iso-concentration lines are normalized relative to ambient CO2 concentration which is held constant at 360 ppmv.
Effects of soil moisture and soil texture.
Varying the WFPS has a large effect on the predicted soil CO2 efflux into the OTC. Figure 4 shows the predicted soil CO2 efflux for the high-flux case with a CO2 generation decay constant of 0.1 m and WFPS values of 22, 46, and 73%. At a given pressure, STEAC predicts a larger fractional reduction in CO2 efflux at lower WFPS values, or, equivalently, larger soil permeabilities. This prediction is consistent with our experimental data (see Fig. 1). The reduction in soil CO2 efflux is greatest in dry soil because, as WFPS decreases, the advective flow of air from the chamber head space into the soil increases. As noted above, this leads to a larger perturbation in the soil CO2 profile and thus a larger decrease in the diffusive CO2 flux. Although the reduction in soil CO2 flux is smallest in wet soils, the predicted flux reductions for the 73% WFPS case (i.e. field capacity for the soil at our sandstone site) indicate that chamber pressure can be problematic for soils at field capacity.
Simulated soil-surface CO2 flux vs. chamber pressure for high-flux case with a CO2 generation rate decay constant of 0.1 m and WFPS values of 73% (triangles), 46% (squares), and 22% (circles). All flux values are expressed as a fraction of the ambient pressure soil CO2 efflux.
In general, coarse-textured soils have higher intrinsic permeabilities (i.e. soil permeability at the minimum value of liquid saturation) than fine textured soils ( de Marsily 1986). The predicted fractional reduction in soil CO2 efflux caused by chamber pressurization should thus be a function of both the WFPS and soil texture, with dry and coarse textured soils showing the greatest sensitivity to chamber pressure anomalies.
Low vs. high-flux cases and non-linearity of pressure response.
Simulations for the low-flux case with a CO2 generation rate decay constant of 0.1 m and WFPS values of 22 and 46% show the same fractional reductions as the high-flux case, indicating that the predicted fractional reduction in CO2 emission from the soil surface is independent of the magnitude of the ambient pressure soil CO2 efflux. Low-and high-flux simulations also show a distinct nonlinearity in the response to increasing chamber pressure (see 1, 4, 5). Both results are consistent with a simple 1D approximation to the soil-gas CO2 profile which shows that the fractional reduction in soil CO2 flux scales with the inverse of the Peclet number (the ratio of advective to diffusive flux).
Simulated soil-surface CO2 flux vs. chamber pressure for high-flux case with a WFPS of 46% and CO2 generation rate decay constants of 0.05 m (triangles), 0.1 m (squares), and 0.5 m (circles). All flux values are expressed as a fraction of the ambient pressure soil CO2 efflux.
Effect of the depth distribution of soil CO2 generation.
Figure 5 shows the predicted soil CO2 efflux for the high-flux case with a WFPS of 46% and three different CO2 generation rate decay constants (d = 0.05, 0.1, and 0.5 m). Changing the depth distribution of the CO2 generation rate in the soil profile has a large effect on the predicted soil CO2 efflux into the OTC. At a given pressure, STEAC predicts a larger fractional reduction in the CO2 emission rate at higher d (i.e. when CO2 is being generated at greater depths in the soil). Qualitatively, this effect occurs because, as the CO2 generation moves deeper into the soil, diffusion limits the soil’s ability to replenish the CO2 profile near the surface, where the flushing effect dominates. Changes in d have the same general effect at WFPS values ranging from 22 to 73%; changes in WFPS, however, have a much smaller effect on the predicted reduction in CO2 efflux when d is large.
‘Best-fit’ approximations.
To estimate the CO2 generation rate decay constant under field conditions, we manually adjusted d at each experimental water content until we achieved good qualitative agreement between observed and predicted flux values. Figure 6(a) presents the ‘best-fit’ cases for the three experimental curves shown in Fig. 1. For the measured WFPS values of 46, 36, and 22%, we obtained ‘best-fit’d-values of 0.09, 0.2, and 0.5 m, respectively. This trend in the values of d is reasonable, since we expect the distribution of soil CO2 generation to change as the growing season progresses and the soil dries. Early in the season in this annual system, plant roots and associated microbial activity are concentrated in the upper portion of the soil profile, and thus d should be small. As the season progresses, plant roots penetrate deeper into the soil profile and the surface soil begins to dry. Under these conditions, proportionally more CO2 generation will occur at depth, and thus d should increase, consistent with our results.
(a) Observed (open symbols) and simulated ‘best-fit’ (closed symbols) soil-surface CO2 flux vs. chamber pressure for WFPS values of 46% (triangles), 36% (squares), and 22% (circles). CO2 generation rate decay constants for the simulated ‘best-fit’ cases are 0.1, 0.2, and 0.5 m, respectively. (b) Simulated soil-surface CO2 flux vs. chamber pressures ranging from 0 to 1 Pa above ambient for ‘best-fit’ cases of 46% WFPS (triangles) and 22% WFPS (circles).
Our decay constant estimates have several potential limitations. First, we assume a uniform soil water content in our simulations. In our experimental soil profiles, soil moisture typically increases with depth. Second, our simulated fluxes, unlike the fluxes measured with the SRC, represent an integrated flux across the width of the OTC. Despite these limitations, these simulations suggest that the fractional reduction in soil CO2 efflux at a given pressure can be predicted given the WFPS profile, the intrinsic soil permeability, and the depth distribution of the CO2 generation rate.
Figure 6(b) shows the effect of chamber pressures ranging from 0 to 1 Pa above ambient on soil CO2 flux for the ‘best-fit’ WFPS cases of 22 and 46%. In this pressure range, STEAC still predicts a substantial decrease in CO2 efflux. This predicted decrease is, again, more pronounced for the dry soil case. For chamber pressures below ambient, STEAC predicts soil CO2 effluxes which are greater than the ambient rate (unpubl. data). Under these conditions, there is an advective flow of air from the soil into the chamber head space. This flow of air carries soil CO2 into the chamber at a rate faster than the diffusional flux rate at ambient pressure. Interestingly, the predicted fractional change in flux at a given pressure below ambient is larger than the predicted change at a greater than ambient pressure of the same magnitude. Fang & Moncrieff (1996) noted a similar pattern in their experimental data. We believe this observation results from an increase in the effective soil CO2 source volume at less than ambient chamber pressures. This nonlinearity is discernible even at differential pressures of less than 1 Pa and suggests that the effects of random chamber pressure fluctuations about ambient will not cancel to yield an unbiased estimate of soil CO2 flux.
Effect of chamber width.
Varying the width of the simulated flux chamber also has a large effect on the predicted fractional reduction in soil CO2 efflux. Figure 7 shows the predicted soil CO2 efflux for the high-flux case with a CO2 generation decay constant, d, of 0.2, a WFPS of 36%, and chamber widths of 0.2, 1, and 2 m. At a given pressure, STEAC predicts a larger fractional reduction in CO2 efflux for smaller chamber widths. This effect occurs because the advective flow of air into the soil is greatest at the chamber periphery where flow path length, and thus the resistance to flow, is smallest (see soil-gas streamlines in Fig. 3b). As chamber width increases, the ratio of chamber perimeter to basal chamber area decreases, and therefore the average path length for flow leaving the chamber increases. With an increase in average path length, there is less advective flow into the soil per unit basal chamber area, and a smaller reduction in the diffusive CO2 flux.
Simulated soil-surface CO2 flux vs. chamber pressure for high-flux case with a WFPS of 36%, a CO2 generation rate decay constant of 0.2 m, and chamber widths of 2 m (triangles), 1 m (squares), and 0.2 m (circles). All flux values are expressed as a fraction of the ambient pressure soil CO2 efflux.
Implications for soil gas-exchange measurements
Our experimental and modelling results show that chamber pressurization can have a large effect on soil trace gas flux measurements. Because open dynamic systems rely on a continuous flow of air through the chamber to maintain ambient temperature and gas concentrations, data from these systems should be considered suspect, particularly when the incoming and outgoing air flows have not been carefully balanced. Soil trace gas efflux will be underestimated when the incoming air flow exceeds the outgoing air flow (i.e. at greater than ambient chamber pressures) and overestimated when the outgoing air flow exceeds the incoming air flow (i.e. at less than ambient chamber pressures). The size of the measurement bias will depend on the magnitude of the differential pressure, the soil air permeability (i.e. soil moisture and texture), the depth distribution of soil trace gas generation, and the diameter of the flux chamber.
Although chamber pressurization is likely to be the dominant source of bias in data from open dynamic systems, there are other potential sources of error. For example, flux chambers may dampen naturally occurring pressure fluctuations at the soil surface. Several studies have demonstrated a positive correlation between the magnitude of ambient pressure fluctuations and rates of surface trace gas flux ( Kimball & Lemon 1971; Baldocchi & Meyers 1991).
Chamber pressurization and pressure dampening may also be a source of measurement bias in the closed dynamic systems described by Hall et al. (1990) and Norman et al. (1992) . There are no published data, of which we are aware, showing typical chamber pressures in closed dynamic systems. Although these designs generally incorporate a pressure equilibration vent, system leaks, depending on their location, can lead to chamber pressures that differ from ambient by as much as ± 20 Pa (J. Norman, pers. comm.). Nay et al. (1994) used a similar system to measure a known CO2 efflux and found that the closed dynamic chamber consistently underestimated CO2 efflux by 15%. As the authors point out, however, this underestimate may have resulted simply from using a linear rather than nonlinear model to calculate the flux from the change in head space concentration. Closed dynamic chambers may prove to be a reliable alternative for measuring soil trace gas flux in some situations, but, as noted earlier, they are not well suited for continuous flux measurements.
Implications for NEE measurements under elevated CO 2
The majority of elevated CO2 studies have measured net ecosystem CO2 exchange (NEE) using modified OTCs as open dynamic chambers. Gas-exchange results from these studies often show a large increase in net carbon uptake under elevated CO2, an increase that is typically larger than what can be accounted for by summing measured changes in C pool sizes ( Diemer 1994; Ball et al. 1995 ; Stocker et al. 1995 ; Drake et al. 1996 ). Because statistical power to detect changes in soil C pools is quite low ( Hungate et al. 1996 ), several investigators have suggested that the rhizosphere is the likely sink for this missing C ( Ball et al. 1994 ; Diemer 1994; Stocker et al. 1995 ; Drake et al. 1996 ). We believe, however, that a large portion of the frequently observed increase in net ecosystem CO2 uptake under elevated CO2 may be an artifact resulting from the effects of chamber pressurization on soil CO2 efflux.
To illustrate this point, we consider a hypothetical scenario in which both ambient and elevated CO2 treatments have an annual net ecosystem production (NEP) of zero. For both treatments, we assume a gross primary productivity to net primary productivity ratio of two and a root to shoot ratio of one. Using a value of 400 g C m–2 y–1 for gross photosynthesis under ambient CO2 gives values of 100, 100, and 200 g C m–2 y–1 for shoot, root, and microbial respiration, respectively. Assuming a gross photosynthesis of 560 g C m–2 y–1 under elevated CO2 (i.e. a 40% increase), we calculate shoot, root, and microbial respiration values of 140, 140, and 280 g C m–2 y–1, respectively. We assume, based on our model results, that the fractional decrease in soil CO2 efflux at a given chamber pressure is independent of the ambient pressure flux rate. If we measure 100% of the soil CO2 efflux (i.e. sum of root and microbial respiration) over the course of the year, the integrated NEE measurements would show an NEP of zero for both treatments, and we would correctly conclude that elevated CO2 has no effect on C storage. If, on the other hand, we measure only 90% of soil CO2 efflux due to the effects of greater than ambient chamber pressure, integrated NEE measurements would show an NEP of 30 g C m–2 y–1 for the low CO2 treatment and an NEP of 42 g C m–2 y–1 for the high CO2 treatment. We would thus incorrectly conclude not only that C was being stored under ambient CO2 but also that ecosystem C storage increased by 40% under elevated CO2. When we consider a hypothetical scenario in which the elevated CO2 treatment has a positive NEP (i.e. C storage) and the ambient treatment has an NEP of zero, C storage and its stimulation under elevated CO2 are again overestimated. Measuring more or less than 90% of soil CO2 efflux changes the absolute magnitude of the NEP values, but not the apparent relative increase in NEP under elevated CO2. The size of the apparent relative increase in NEP is governed by the relative increase in gross canopy photosynthesis under elevated CO2. The between-treatment bias thus results from the pressure effect acting in conjunction with an increase in photosynthesis under elevated CO2.
We were unable to make a quantitative assessment of the potential bias in NEE data from published studies because such an assessment requires site specific data on chamber pressure, soil moisture, the intrinsic soil permeability, and the depth distribution of soil CO2 generation. Several lines of evidence, however, are consistent with our hypothesis that some of the observed increase in NEP under elevated CO2 is a methodological artifact. First, our results, and the results of Fang & Moncrieff (1996), have shown that soil CO2 efflux is sensitive to pressures on the order of several tenths of a Pascal. Chamber pressures greater than 5 Pa are easily generated when air blown into the base of the chamber is not balanced by an equal amount of air being drawn out at the top. The majority of OTC gas-exchange systems do not balance incoming and outgoing air flows. Second, data from Nakayama et al. (1988) and Luo et al. (1996) show significantly lower soil CO2 efflux in OTCs than in unchambered control plots. And third, our whole-ecosystem gas-exchange results show that a reduction in soil-surface CO2 flux can have a major impact on apparent ecosystem net CO2 exchange (see Fig. 2).
Ham et al. (1995) attempted to minimize chamber pressurization in their flux OTCs by balancing incoming and outgoing air flows using a variable speed fan at the top of the chamber. As Fang & Moncrieff (1996) have shown, however, controlling pressure to within less than ± 1.0 Pa of ambient in open dynamic chambers is difficult, even when flow rates are balanced using a micromanometer. Owensby et al. (1997) used large diameter chambers (4.5 m) in conjunction with a 1 m deep soil barrier to minimize the potential impact of chamber pressurization. In addition to looking at the effects of increasing chamber width, we performed simulations using an impermeable soil barrier and found that this approach can also mitigate the impacts of chamber pressurization on soil CO2 flux. With 2 Pa of overpressurization, a WFPS of 46%, and a d of 0.1, introducing a 45 cm deep soil barrier in our 1.5 m profile increased the predicted soil CO2 efflux from roughly 60% to 80% of the control measurement at ambient pressure. To eliminate the treatment bias discussed in the hypothetical NEP scenario above, these precautionary measures must be 100% effective. In the case of the soil barrier, this is achieved only when the bottom edge of the barrier penetrates a soil layer with a very low air permeability (e.g. the water table). Our analysis of data from Ham et al. (1995 ; Table 3) shows a 21% decrease in soil CO2 efflux inside the chambers relative to nonchamber control plots (P < 0.005, two-tailed paired t-test), and suggests that chamber pressurization may be problematic for open dynamic chambers even when careful precautions are taken to minimize its effects.
Conclusions
Our experimental and modelling results demonstrate the challenging nature of soil-surface CO2 flux measurements and highlight the need for caution in the interpretation of dynamic chamber trace gas flux data. Dynamic chamber techniques will undoubtedly see continued use until improved methods for measuring soil and whole-ecosystem trace gas flux are developed. Future applications of this method should include efforts to identify and minimize chamber pressure artifacts; chamber pressure measurements will be a key part of these efforts. If chamber pressure is characterized along with the soil moisture profile, the intrinsic soil permeability, and the depth distribution of soil CO2 generation, there is some hope that pressure biased flux data may potentially be corrected using a modelling framework similar to the one described here.
Acknowledgements
The Jasper Ridge CO2 Experiment was supported by NSF grants BSR-9020134 to C. B. Field, BSR-9020347 to H. A. Mooney, and BSR-9020135 to F. S. Chapin, III. CPL was supported by the U. S. Department of Energy’s Graduate Fellowships for Global Change Program administered by ORISE. WJR and LLP were supported by a NASA EOS/IDS grant to P. J. Sellers and H. A. Mooney. We thank everyone involved in the Jasper Ridge CO2 Project with special thanks to Howard Whitted and Art Fredeen for technical and engineering assistance. G. Joel and J. Osborn provided valuable comments on the manuscript. This is CIWDPB publication number 1375.
Appendix
Appendix 1: STEAC nomenclature
C CO2 concentration in the soil-gas (μmol m–3)
d decay constant for the CO2 generation rate (m)
D diffusivity of CO2 through bulk soil (m2 s–1)
F A advective CO2 flux across the soil–atmosphere interface (μmol m–2 s–1)
F D diffusive CO2 flux across the soil–atmosphere interface (μmol m–2 s–1)
k soil permeability (m2)
k r relative soil permeability (–)
k i soil permeability at the minimum value of liquid saturation (m2)
L horizontal dimension of the flux chamber (m)
p soil-gas disturbance pressure (Pa)
S generation rate of CO2 into the soil-gas (μmol m–3 s–1)
S e effective liquid saturation (–)
S r minimum value of liquid saturation (0.11)
S w fractional water-filled pore space (–)
S 0 CO2 generation rate at z = 0 (μmol m–3 s–1)
y horizontal coordinate (m)
ν→ darcy velocity (m s–1)
νz darcy velocity in the z direction (m s–1)
z depth into the soil (m)
ε air-filled porosity of the soil (–)
μ dynamic viscosity (kg m–1 s–1)
—→ gradient operator (m–1)
Note: (–) indicates a nondimensional variable.


