GABAA and GABAB receptors on neocortical neurons are differentially distributed
Abstract
The distribution of functional neurotransmitter receptors on the surface of neurons is highly relevant for synaptic transmission and signal processing. To map functional GABAA and GABAB receptors on the somadendritic membrane of rat neocortical layer V pyramidal neurons we used patch-clamp recording in combination with infrared-guided laser stimulation to release γ-aminobutyric acid (GABA) photolytically. The data strongly suggest that relatively more GABAA receptors are located at the apical dendrite and relatively more GABAB receptors near the soma. Such a specific distribution of GABAA and GABAB receptors may serve to compensate for differences in electrotonic voltage attenuation between GABAA and GABAB receptor-mediated inhibitory postsynaptic potentials (IPSPs).
Introduction
Inhibition is of prime importance in the integration of all activity within the mammalian brain. In neocortex, inhibition is mediated mainly by GABA. As in hippocampus (Alger, 1991), there are two main classes of GABA receptors, GABAA and GABAB, described as fast and slow, respectively (Connors et al., 1982; Deisz & Prince, 1989). The GABAA response is chloride dependent and causes the ligand-gated fast inhibitory postsynaptic potential (IPSP). GABAB receptors activate a potassium-dependent conductance via a G protein-coupled mechanism. Activation of the GABAB receptor mediates the slow IPSP (Benardo, 1994). The distribution of GABAA and GABAB receptors on the surface of neurons appears to be of high relevance for the integration of these synaptic inputs (Johnston et al., 1996). Previous studies using the methods of radioligand binding and immunocytochemistry have already revealed differences in the density of GABAA and GABAB receptors in various areas of the central nervous system (Bowery et al., 1987; Chu et al., 1990; Hendry et al., 1990; Huntsman et al., 1994; Sakurai et al., 1994; Schwark et al., 1994). To functionally map neurotransmitter receptors on single neurons, and to mimic synaptic transmission, fast and localized application of the agonist is required (Denk, 1994; Katz & Dalva, 1994; Pettit et al., 1997). For this purpose we used the recently developed infrared-guided laser stimulation in combination with whole-cell patch-clamp recording. This technique allows one to evoke local GABA responses with high temporal and spatial resolution. This study is the first report on the distribution of functional GABAA and GABAB receptors on the apical dendrite of rat neocortical layer V pyramidal neurons in brain slices.
Materials and methods
Electrophysiology
Neocortical slices (300 µm thick, cut in a sagittal plane) were prepared according to standard procedures (Stuart et al., 1993), from 14- to 21-day-old male Sprague–Dawley rats. Before decapitation, the animals were deeply anaesthetized with ether. Brain slices were placed in the recording chamber of the ‘infrapatch’ set-up (Luigs & Neumann, Ratingen, Germany) and superfused with solutions containing (in mm): NaCl, 125; KCl, 2.5; NaH2PO4, 1.25; CaCl2, 2; MgCl2, 1; NaHCO3, 25; glucose, 25 (saturated with 95% O2, 5% CO2; pH 7.4). Whole-cell recordings from visually identified somata and apical dendrites from layer V pyramidal neurons of somatosensory cortex were made at room temperature (22–24 °C) with a standard intracellular amplifier (npi, Tamm, Germany) in bridge mode. Patch-clamp electrodes with open-tip resistances of 4–7 MΩ for the somatic and 8–11 MΩ for the dendritic recordings were used which contained (in mm): K-gluconat, 130; KCl, 5; EGTA, 0.5; Mg-ATP, 2; HEPES, 10; glucose, 5; pH 7.2 (Andreasen & Hablitz, 1994). Series resistances were 15 ± 0.1 ΜΩ for the somatic (n = 44 neurons) and 22 ± 0.8 ΜΩ for the dendritic recordings (n = 13 neurons). The neurons included in this study (n = 57) had on average a resting potential of −60 ± 0.3 mV and an input resistance of 99 ± 6 MΩ. Reversal potentials were measured by simultaneously applying GABA near the recording site and shifting the potential of the neuron by current injection. The data were stored and analysed with a Macintosh-based recording system and standard software (Pulse 8.00, Heka, Lambrecht, Germany; Igor Pro 3.01, WaveMetrics, Lake Oswego, OR, USA). All values are expressed as mean ± standard error of the mean (SEM).
Photostimulation
Neurons in neocortical slices were visualized with infrared light and a new contrast system, ‘gradient contrast’ (GC) (Dodt et al., 1999). The power of an ultraviolet (UV) laser (Enterprise II, Coherent, Dieburg, Germany) was adjusted with its remote control to evoke a hyperpolarizing GABA response of 3–6 mV at the recording site in response to 3-ms shuttered light pulses. The laser beam was focused by the objective (60×, 0.9 numerical aperture, Olympus, Hamburg, Germany) to a 1-µm-spot in the specimen plane. GABA was applied by photolysis of γ-CNB-caged GABA (Molecular Probes, Leiden, The Netherlands), added at a concentration of 1 mm to the superfusion solution, which was oxygenated in a recirculation system. Control experiments (n = 8 neurons) showed that the amplitude of GABAA responses was stable 20 min after the beginning of the superfusion. This means that 20 min after the beginning of the superfusion the caged compound reached its final concentration in the brain slice and an equilibrium between the pipette solution, and the intracellular medium was established. The GABAA responses were evoked at the apical dendrite (300 µm from the centre of the soma) and recorded at the soma. All photostimulation experiments were started at least 30 min after the addition of caged GABA, tetrodotoxin (TTX; Sigma, Deisenhofen, Germany) and the specific antagonist picrotoxin (75 µm, Sigma) or CGP35348 (200 µm, kindly gift from Ciba-Geigy). The final adjustment of the laser power at the recording site was made after this pharmacological isolation of GABAA or GABAB responses. To avoid influences of the geometry of the neuron, the response amplitude at a distance of 40 µm from the centre of the soma was set to 100%. The tapering of the soma into the dendrite ends approximately at this distance. To record close to this point, the pipette was positioned on the region of the soma where it tapers into the dendrite.
Numerical simulations
Voltage attenuation of GABAA and GABAB responses travelling along the apical dendrite of neocortical layer V pyramidal neurons was simulated with an equivalent cylinder model using the equations 8–12 of Spruston et al. (1993). The parameters used in the model were the electrotonic length (L), the membrane time constant (τm) and the frequency (f) of the voltage response. The electrotonic length was estimated by using the equations 1 and 2 of Spruston et al. (1993). For this calculation, the values of the specific membrane resistance (Rm), the intracellular resistivity (Ri) and the length (l), as well as the radius (a) of the apical dendrite were required. Values of Rm were obtained from the measured τm using the equation τm = Rm · Cm, assuming a specific membrane capacitance (Cm) of 1 µF/cm2 (Stuart & Spruston, 1998). For neurons which were treated with CGP35348 or picrotoxin, we obtained a specific membrane resistance of 27 ± 3 or 20 ± 1 kΩcm2, respectively (for each antagonist, n = 10 neurons). For the intracellular resistivity we assumed a value of 100 Ωcm, as recently determined for neocortical layer V pyramidal neurons by Stuart & Spruston (1998). The length and the radius of the apical dendrite were estimated as 1000 and 1 µm, respectively. The resulting value of the electrotonic length was calculated to be approximately 1. Probably due to the reduction of the specific membrane resistance by TTX (our unpublished observation; Müller & Somjen, 2000), this value was higher than previously described by Spruston et al. (1994) and Johnston et al. (1996). For the frequency parameter in the simulation, we used the time-to-peak of the hyperpolarizations, which was obtained from responses evoked and recorded at the soma. This kinetic parameter was 35 ± 2 ms for GABAA (n = 13 neurons) and 327 ± 11 ms for GABAB responses (n = 11 neurons). These values give frequency parameters of 29 and 3 Hz, respectively. For dendritic recordings, no differences for the time-to-peak of GABA responses, which were evoked near the dendritic recording pipette (200 µm from the centre of the soma), could be observed [38 ± 4 ms for GABAA (n = 6 neurons) and 317 ± 12 ms for GABAB responses (n = 7 neurons), P > 0.5, Student's t-test]. This result strongly suggests that somatic as well as dendritic GABAA and GABAB receptors have similar properties. The analytical solutions were computed using Microsoft Excel.
Results
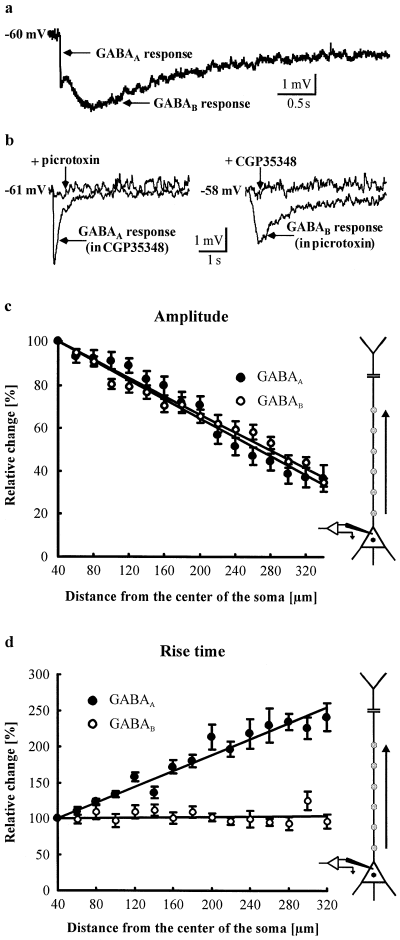
Responses to GABA, delivered to various sites along the apical dendrite of neocortical layer V pyramidal neurons, were recorded from the neuronal soma or apical dendrite at the resting potential of the neuron. After a stable, whole-cell patch-clamp recording had been established, the recording chamber was perfused with solution containing caged GABA (1 mm). TTX (1 µm) was added to isolate the neuron under study from synaptic inputs. Caged GABA was photolysed by 3-ms light pulses of a UV-laser eliciting mixed GABAA/GABAB responses (Fig. 1a). GABAA responses with fast kinetics or GABAB responses with slow kinetics were isolated pharmacologically by means of specific antagonists: for GABAA receptors, picrotoxin, and for GABAB receptors, CGP35348 (Fig. 1b) (Howe et al., 1987; van Brederode & Spain, 1995). GABA was applied to sites 20 µm apart along the apical dendrite.

Dependence of dendritic GABAA and GABAB responses on the distance from the soma. (a) Focal photolysis of caged GABA elicits mixed GABAA/GABAB responses. (b) Addition of the specific GABAB receptor antagonist CGP35348 (200 µm) to the extracellular solution isolates pure GABAA responses, which can be blocked completely by the GABAA receptor antagonist picrotoxin (75 µm). Pure GABAB responses can be isolated by picrotoxin and blocked by CGP35348. Single sweeps shown. (c) Both the GABAA (●) and GABAB (○) response amplitudes show a nearly equal and linear decrease from the soma towards the distal apical dendrite (n = 13 neurons for GABAA and n = 11 neurons for GABAB). R2 for the linear regression fits (solid lines) is 0.96 for GABAA and 0.97 for GABAB. (d) Only the rise time of GABAA responses increases with the distance from the recording site, the rise time of GABAB responses stayed constant (n = 11 neurons for GABAA and GABAB). R2 for the linear regression fits is 0.94 for GABAA and 0.96 for GABAB.
At every dendritic site stimulated, GABAA as well as GABAB responses could be elicited. The amplitudes of the hyperpolarizing responses were expressed in percentage of a response evoked near the soma (at a distance of 40 µm from the centre of the soma), thus eliminating the influence of the greater membrane area which would be stimulated by somatic application. Both the GABAA and GABAB response amplitudes showed a nearly equal and linear decrease towards the distal dendrite (n = 13 neurons for GABAA and n = 11 neurons for GABAB, Fig. 1c). At all stimulation points, no significant difference between the normalized GABAA and GABAB response amplitudes was found (P > 0.05, Student's t-test). Without further analysis, this result suggests that the distribution of GABAA receptors equals the distribution of GABAB receptors. Such a conclusion presupposes that the measured GABA sensitivity of the stimulated membrane area is directly proportional to the number of activated receptors. Such a correlation can be assumed for the following reasons. First, synaptic inputs, which could coincide with the photolytically evoked GABA responses, were blocked by the addition of TTX. Second, the somatic reversal potential for GABAA responses was −70 ± 1 mV (n = 13 neurons), and for GABAB responses −92 ± 0.6 mV (n = 8 neurons). No differences for the reversal potentials, measured by dendritic recordings (200 µm from the centre of the soma) could be observed (−70 ± 0.2 mV for GABAA, n = 3 neurons and −92 ± 1 mV for GABAB responses, n = 3 neurons). Furthermore, no difference between the somatic and dendritic resting potentials could be observed (P > 0.3, Student's t-test). The resting potential was −60 ± 0.4 mV at the soma (n = 44 neurons) and −61 ± 0.7 mV at the dendrite (n = 13 neurons). Thus, obviously the driving force for Cl– and K+ ions is equal at the soma as well as at the dendrite. Third, the time-to-peak of GABAA and GABAB responses evoked and recorded at the soma equals the time-to-peak of GABAA and GABAB hyperpolarizations, which were elicited and recorded at the dendrite (see Materials and methods section). This result strongly suggests that somatic as well as dendritic GABAA and GABAB receptors have equal intrinsic properties. Fourth, activation of the hyperpolarization-activated conductance Ih results in a slow, partial repolarization of the neuron (Spain et al., 1987; Stuart & Spruston, 1998). Such a ‘sag’ could never be observed when the membrane potential was shifted from the resting potential to −70 mV by injection of negative current pulses. Therefore, an Ih current obviously does not affect our measurements.
However, because of their faster kinetics, the amplitudes of GABAA responses should be more attenuated travelling down the dendrite than GABAB response amplitudes, as predicted by the cable theory (Spruston et al., 1993, 1994). Therefore, the observed equal decrease of the amplitudes of GABAA and GABAB responses towards the distal dendrite suggests that the ratio of the number of GABAA to GABAB receptors is higher at remote areas of the dendrite.
That, in fact, the cable theory can be applied here is demonstrated by another prediction of this theory which corresponded well with the experimental results. The cable theory predicts that kinetics, as well as the amplitudes of voltage responses, are influenced by the passive cable properties of dendrites (Spruston et al., 1993, 1994). In particular, the theory predicts that, in contrast to the amplitude, an electrotonic slowing of the rise time cannot be compensated by increasing the number of GABA receptors. This means that, due to the stronger electrotonic deceleration of fast kinetics (Spruston et al., 1993), the rise time of GABAA responses should be more prolonged than the rise time of GABAB responses for dendritic stimulation sites. This is what we found in our experiments. The rise time (20–80%) of GABAA responses increased clearly with distance from the recording site near the soma (to 241 ± 19% at 320 µm), whereas no change was observed for the GABAB responses (96 ± 9% at 320 µm, n = 11 neurons for GABAA and GABAB, Fig. 1d). These results confirm the stronger influence of electrotonic attenuation on GABAA responses. The absolute rise time of responses evoked near the recording site (soma) was 5.1 ± 0.3 ms for GABAA (n = 13 neurons) and 171 ± 9 ms for GABAB hyperpolarizations (n = 11 neurons).
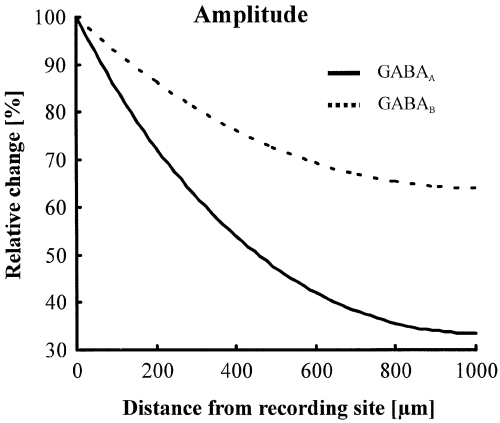
To quantify the electrotonic attenuation of GABAA and GABAB responses predicted by the cable theory, we made numerical simulations using the equivalent cylinder model developed by Rall & Segev (1985). These calculations predict a stronger electrotonic attenuation of GABAA response amplitudes (38% for GABAA and 19% for GABAB at 340 µm, Fig. 2).

Numerical simulation of electrotonic voltage attenuation. A cable equation was used to simulate the decrease of GABAA (solid line) and GABAB (broken line) response amplitudes by the passive cable properties of the apical dendrite. Due to their faster kinetics, the voltage attenuation is much stronger for GABAA responses.
To estimate the relative density of GABAA and GABAB receptors along the apical dendrite, we applied the cable theory; we divided the equations describing the linear regression fits for the values measured (see Fig. 1c) by the corresponding equations of electrotonic voltage attenuation shown in Fig. 2. This division mathematically eliminated the electrotonic effect on our measurements. As the voltage response amplitudes are proportional to the number of activated receptors, the equations we obtained in this way give the relative number of activated GABAA and GABAB receptors. If one now divides the resulting equation for GABAA receptors by the corresponding equation for GABAB receptors, one obtains the relative ratio of GABAA to GABAB receptors. This ratio shows a preponderance of GABAA receptors with increasing distance from the soma (1.25 at 340 µm, compared with 1.0 at 40 µm).
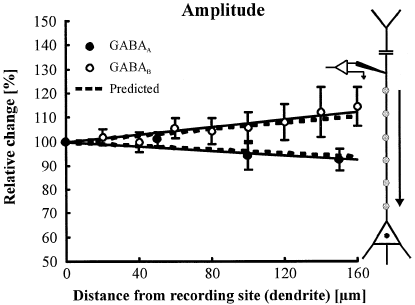
To verify our results on GABA receptor distribution, we carried out a kind of ‘inverse’ experiment. We made dendritic recordings to see whether theoretical predictions, based on the data of the somatic recordings, matched with the experimental results. We performed dendritic whole-cell recordings at a distance of 200 µm from the centre of the soma and released GABA at various dendritic sites between the soma and the patch-pipette. The linear regression fits for both the GABAA and GABAB response amplitudes (n = 6 neurons for GABAA and n = 7 neurons for GABAB) correspond well with the values predicted by numerical simulations for this experimental design (Fig. 3).

The ‘inverse’ experiment. Dendritic recording and photolytic GABA application. After establishing stable dendritic whole-cell recordings at a distance of 200 µm from the centre of the soma, GABAA (●) or GABAB (○) responses were elicited photolytically on the dendrite stepwise towards the soma. The fits for the measured response amplitudes (solid lines; r2 = 0.96 for GABAA, n = 6 neurons; and r2 = 0.87 for GABAB, n = 7 neurons) correspond well with the predictions obtained by numerical simulations (broken lines).
The graphs, predicted by theory for the dendritic recordings, were obtained as follows. The slopes of the graphs describing the relative number of activated receptors obtained by somatic recording were inverted, as we now look at the GABA receptor distribution along the dendrite from the opposite direction. As electrotonic attenuation also has to be taken into account for dendritic recordings, we again applied the cable equation on the inverted graphs. This was done by multiplying the equations describing these graphs with the equations describing the electrotonic voltage attenuation.
The final results of these multiplications are the graphs indicated as ‘predicted’ in Fig. 3. The nearly perfect match of the graphs, predicted from theory with our experimental measurements, suggests the correctness of our numerical simulations. In particular, applying the cable equation two times, as in our calculations described earlier, would amplify any deviation of the theoretical from the experimental results. Thus, the ‘inverse’ experiment confirms the finding that the ratio of the number of GABAA to GABAB receptors increases towards the distal apical dendrite of neocortical pyramidal neurons.
Discussion
This study is the first report on the distribution of functional GABAA and GABAB receptors on the apical dendrite of rat neocortical layer V pyramidal neurons. Our data strongly suggest that relatively less GABAB receptors are located at the apical dendrite and relatively less GABAA receptors near the soma. One could argue that the smaller GABAB responses at the dendrite may not be caused by a lower density of GABAB receptors but rather by a lower density of G protein-coupled, inwardly rectifying K+ (GIRK) channels. However, this possibility seems to be very unlikely as not a lower but a higher concentration of the essential Kir3.1 subunit of the GIRK channel was found at the dendrite (Yamada et al., 1998). Furthermore, electrophysiological experiments also provide strong evidence for a relatively higher density of GIRK channels in dendrites of rat neocortical pyramidal neurons (Takigawa & Alzheimer, 1999).
We were able to show that GABAA, as well as GABAB responses, could be elicited at every somatic and dendritic site stimulated. As neocortical pyramidal neurons are innervated by GABAergic interneurons at the axon initial segment, the soma and the proximal as well as the distal dendritic segments (Thomson et al., 1996), our result suggests that pure GABAA and GABAB IPSPs as well as mixed GABAA/GABAB IPSPs could be generated at the soma as well as at the apical dendrite of the neuron. Evidence for inhibitory neurons mediating pure GABAA or GABAB IPSPs has been provided (Benardo, 1994). Whether single interneurons generate mixed GABAA/GABAB IPSPs in cortical regions has been a controversial issue for some time (Nurse & Lacaille, 1997). Recently, such interneurons were found in the neocortex (Thomson et al., 1996), as well as in the hippocampus (Thomson & Destexhe, 1999). However, the mechanism of such a coactivation of GABAA and GABAB receptors at single synapses is not yet clear. The observed colocalization of GABAA and GABAB receptors at every site where GABA was applied may indicate a colocalization of GABAA and GABAB receptors at the postsynaptic density. However, also a coactivation of GABA receptor subtypes by a spillover of GABA is possible.
Our results provide evidence that neocortical layer V pyramidal neurons can compensate for differences in electrotonic voltage attenuation between GABAA and GABAB responses by a different distribution of the GABA receptor subtypes. This compensatory mechanism could be one of several mechanisms to compensate for electrotonic voltage attenuation. Voltage-activated conductances, which are located at the dendrites, often counteract passive cable properties (Johnston et al., 1996). For example, dendritic P-type Ca2+ channels can compensate for electrotonic voltage attenuation of excitatory synaptic inputs to cerebellar Purkinje cells (De Schutter & Bower, 1994). Furthermore, a linearization of synaptic inputs via N-methyl-d-aspartate (NMDA) receptors and K+ channels has been described for hippocampal neurons (Cash & Yuste, 1998). NMDA receptors as well as K+ channels are differentially distributed along the dendrite (Johnston et al., 1996; Hoffman et al., 1997). Our finding of GABA receptor distribution means that the soma receives the same ratio of GABAA to GABAB response amplitudes from every application site at the apical dendrite. Interestingly, a similar distribution of fast and slow receptor subtypes was found for the excitatory transmitter glutamate; we recently showed that relatively faster α-amino-3-hydroxy-5-methyl-4-isoxazolpropionate (AMPA) receptors are located at the apical dendrite of neurons than slow NMDA receptors (Dodt et al., 1998).
The physiological relevance of our findings is obvious for GABAergic interneurons, which elicit mixed GABAA/GABAB IPSPs. Differential electrotonic attenuation of GABAA and GABAB voltage responses would be compensated by the GABA receptor distribution. Thus, the effect of synaptic potentials elicited by such interneurons would be more similar, whether the potentials are mediated by GABAA or GABAB receptors. The differential distribution of ligand-gated receptor subtypes may be a basic mechanism of neurons to counteract passive cable properties.
Acknowledgement
This study was supported by a grant of the SFB 391.
Abbreviations
-
- AMPA
-
- α-amino-3-hydroxy-5-methyl-4-isoxazolpropionate
-
- Cm
-
- specific membrane capacitance
-
- GABA
-
- γ-aminobutyric acid
-
- GC
-
- gradient contrast
-
- GIRK channel
-
- G protein-coupled inwardly rectifying K+ channel
-
- IPSP
-
- inhibitory postsynaptic potential
-
- NMDA
-
- N-methyl-d-aspartate
-
- Rm
-
- specific membrane resistance
-
- τm
-
- membrane time constant
-
- TTX
-
- tetrodotoxin
-
- UV
-
- ultraviolet.


