Confirming a Biological Pathway in the Metabolic Syndrome—Insight from the NHANES 1999–2002
Abstract
The objective of this study was to examine the role of obesity in the development of the metabolic syndrome (MS). A total of 3,596 whites aged 19 years and above, who participated in the National Health and Nutrition Examination Survey (NHANES) 1999–2002, were included for analysis. Anthropometric measurements, biochemical profiles, and high-sensitivity C-reactive protein (CRP) were measured. A structural equation model (SEM) was constructed to elucidate a pathway in which obesity initiated the cascade leading to full MS. The results of SEM demonstrated that obesity was positively associated with elevated CRP level (B = 0.05, P < 0.001). This higher inflammatory state directed to insulin resistance (B = 0.32, P < 0.001), which in turn was positively associated with dyslipidemia (B = 0.06, P < 0.001). Obesity could also directly and positively affect blood pressure (B = 0.51, P < 0.001), without the mediation of insulin resistance and/or inflammation. The results of the cross-sectional analysis in the white subjects have shown that obesity has a strong influence on hypertension that obtains little additional influence from inflammation or insulin resistance. The metabolic profile in the NHANES group has been confirmatory with the statement that there is a sequential effect from obesity to inflammation, insulin resistance, and dyslipidemia. This approach has allowed to inferring important biological insights about the nature of the relationships among the components of MS.
Introduction
The metabolic syndrome (MS) is a cluster of metabolic abnormalities with insulin resistance originally considered to be a major characteristic (1). In recent years, the syndrome has been broadened to encompass features as central obesity, glucose intolerance, atherogenic dyslipidemia, hypertension, a proinflammatory state with increases in acute-phase reactants, and a prothrombotic state. MS was defined as the presence of at least three of the following criteria in Adult Treatment Panel (ATP) III 2001: (i) waist >102 cm in men or >88 cm in women, (ii) serum triglyceride (TG) >150 mg/dl, (iii) high-density lipoprotein cholesterol (HDL-C) <40 mg/dl in men and <50 mg/dl in women, (iv) systolic blood pressure (SBP) >130 mm Hg or diastolic blood pressure (DBP) >85 mm Hg, and (v) fasting glucose >110 mg/dl (2). The International Diabetes Foundation MS consensus definition requires ethnicity-specific central obesity plus two other factors (fasting glucose criterion set at 100 mg/dl) (3).
Recent studies found that the attempt to relate MS as the result of insulin resistance is problematic (4). On the other hand, evidence points out that chronic systemic inflammation plays a major role in the pathological process associated with the MS. The serum levels of an inflammatory marker, C-reactive protein (CRP), not only correlate with all components of MS but also correlate with insulin resistance, endothelial dysfunction, and impaired fibrinolysis (5,6). It is likely that the proinflammatory state of obesity induces insulin resistance, triggers a vicious cycle of positive reinforcement between inflammation and insulin resistance, and leads to clinical and biochemical manifestations of MS (7,8).
Previous attempts to explore and model the complex interaction among the metabolic components were attempted with various statistical models, such as principal component and factor analysis. Haffner and colleagues verified the existence of a single factor that linked all of the core components (9). Also, Ford showed that patterns of factors of variables, often associated with MS, tended to be similar among whites, African Americans, and Mexican Americans (10). However, the interaction among various components of MS is far more complicated than what conventional statistical methods can deal with. Issues such as the sequential relationship, mutual confounding, and relative impacts among each component must be considered as a whole, which is the superiority of structural equation modeling. Structural equation model (SEM), sometimes called causal models, is a technique encompassing aspects of confirmatory factor analysis, path analysis, and regression simultaneously (11). Lin et al. have demonstrated that SEM could be used to explore the association between metabolic risk factors and atherosclerotic complications and also the relative contribution of each metabolic derangement (12,13).
According to current understanding of MS, we built a biological model for the pathogenesis of MS, and verified the comparability of the model with the data from the National Health and Nutrition Examination Survey (NHANES) 1999–2002.
Methods and Procedures
Study design and population
The NHANES is a population-based survey designed to collect information on the health and nutrition of the US household population. The NHANES used a stratified and cluster-sampling design to obtain a representative sample of the noninstitutionalized civilian US population. The survey data are released every 2 years. Detailed Survey Operations Manuals, Consent Documents, and Brochures of the NHANES 1999–2002 are available in the NHANES website. None of the authors has a direct involvement in the NHANES study.
Anthropometric and biochemical data
Data were collected at all study sites by trained personnel according to standardized procedures. Sociodemographic information such as age, gender, and race/ethnicity was collected during the household interview. Laboratory measurements were performed in a mobile examination center. Weight and height were measured using standard methods and digitally recorded. BMI was calculated as weight in kilograms divided by the square of height in meters. Waist circumference was measured at the iliac crest to the nearest 0.1 cm. Three and sometimes four blood pressure (BP) determinations were taken using a mercury sphygmomanometer by a physician. BP was measured in the right arm unless otherwise specified. Averaged SBP and DBP were obtained.
Fasting blood was sampled, processed locally, then stored and shipped to central laboratories for analysis. Levels of total serum cholesterol and TGs (measured in the morning examination session only) were measured enzymatically, levels of HDL-C were measured using precipitation, and levels of low-density lipoprotein cholesterol (LDL-C) were calculated using the Friedewald equation. Plasma glucose levels were processed by using hexokinase enzymatical method. Serum insulin levels were determined by radioimmunoassay. Serum CRP levels were measured by latex-enhanced nephelometry.
Data restriction
Lipid and glucose profiles in the African Americans and the Hispanics in the NHANES data set were mostly incomplete. Therefore, the analysis was restricted to the white participants aged ≥19. Subjects with medication, such as antihypertensive, oral hypoglycemic agents, insulin, and lipid-lowering agents, were excluded so as not to distort the estimation of the relationship among CRP, glucose, lipid profile, and BP.
Statistics
The comparison between anthropometric and biochemical measurements was made between men and women by Student's t-test. The prevalence of MS, with ATP III 2001 criteria when NHANES 1999–2002 was conducted, and individual components was compared with χ2-test.
SEM
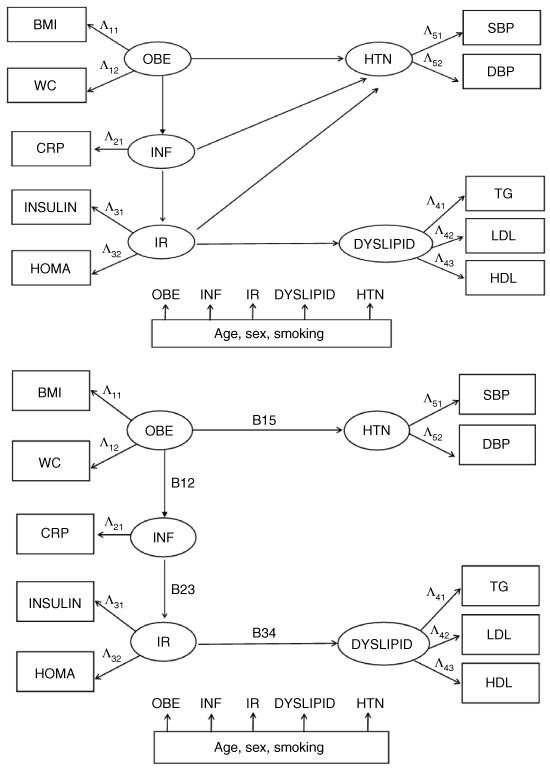
A SEM was used to confirm the hypothesis that obesity (OBE) played the initiating role and was sequentially followed by inflammation (INF), insulin resistance (IR), and then dyslipidemia (DYSLIPID). Hypertension (HTN) could be directly associated with OBE or related to OBE through the intermediation of INF or IR. The model depicted a biological pathway from OBE to INF, from INF to IR, and then from IR to DYSLIPID. On the other hand, OBE, INF, and IR could associate with HTN directly. Potential confounding factors, including sex, age, and smoking status were adjusted by controlling their effects on the five latent variables (OBE, HTN, INF, IR, and DYSLIPID) (1).

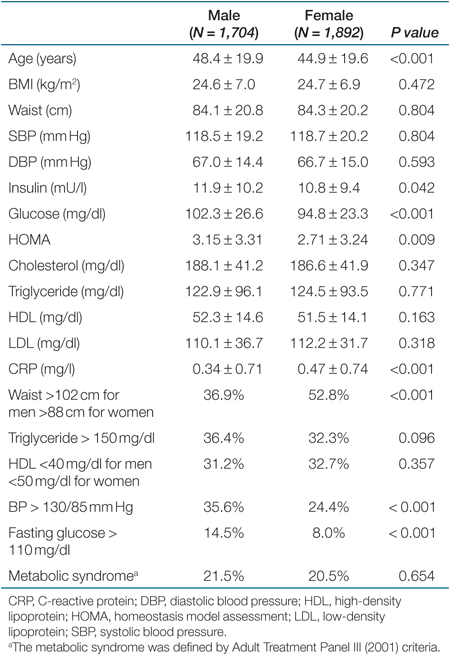
(a) A structural equation model shows the relationship among obesity (OBE), inflammation (INF), insulin resistance (IR), dyslipidemia (DYSLIPID), and hypertension (HTN). (a) The links from INF to HTN and from IR to HTN are not statistically significant in the SEM analysis. The final structural equation model shows OBE → INF, INF → IR, IR → DYSLIPID, and OBE → HTN. (Adapted from ref. 27).
The latent variable OBE loaded on both BMI (Λ11) and waist circumference (WC, Λ12), indicating that an increased waist size might provide additional information for defining obesity. Inflammation (INF) could be solely represented by serum CRP level (CRP, Λ21). Insulin resistance (IR) loaded on insulin level (INSULIN, Λ31) and the homeostatic model assessment (HOMA, Λ32). Fasting glucose level was not used because it was already a part of calculation of HOMA. Dyslipidemia (DYSLIPID) was represented as serum levels of TG (Λ41), LDL (Λ42), and HDL (Λ43). Hypertension (HTN) loaded on both SBP (Λ51) and DBP (Λ52). Each latent variable might be interpreted as a linear combination of manifest variables of relative significance. Loading factors (Λ s) are allowed to have values >1 after correlation adjustment.
The correlation matrix between the manifest variables (BMI, waist circumference, CRP, INSULIN, HOMA, TG, LDL, HDL, SBP, DBP, AGE, SEX, and SMOKING) was calculated with the execution of a SIMPLIS code on a pair-wise basis. Pearson correlation, polyserial correlation, and polychoric correlation were used for two continuous variables, one continuous and one ordinal variable, and two ordinal variables, respectively.
The correlation matrix was imported into a LISREL program (LISREL 8.71; Scientific Software International, Lincolnwood, IL) to estimate the parameters in the SEM. The links between any two latent variables were removed when the regression coefficients did not reach statistical significance (P > 0.05). The model was repeated stepwise until all the links were significant. Another iteration process began and set the errors between any two manifest variables correlated rather than independent if statistical significance was found. The correlation specification between error terms was iterated until the goodness-of-fit index was >0.90, the non-normed fit index was >0.90, and the root mean square error of approximation was ≤0.05. The regression coefficients between latent variables (B), the loading factors from the latent variables onto the manifest variables (Λ), model fitness, and the residual correlation matrix were reported.
Results
Demography
A total of 3,596 whites were included for following analysis. No subject was further excluded on a list-wise basis due to incomplete data collection. The mean age was 48.4 ± 19.9 (n = 1,704) for men and 44.9 ± 19.6 for women (n = 1,892). The anthropometric measurements and the laboratory results were shown in Table 1. Data completion rate ranged from 29 (LDL) to 87% (CRP). Men had significantly higher serum insulin, higher fasting glucose, but lower CRP levels compared with those of women. BMI, waist, BP, and lipid profiles were not different between men and women. The prevalence of abnormal metabolic components and MS were summarized in Table 1. Based on ATP III (2001) criteria, a higher proportion of women had central obesity, whereas a higher proportion of men reached the definition of elevated BP and glucose intolerance. The crude prevalence of MS was 21.5 and 20.5% for men and women, respectively.
 |
SEM
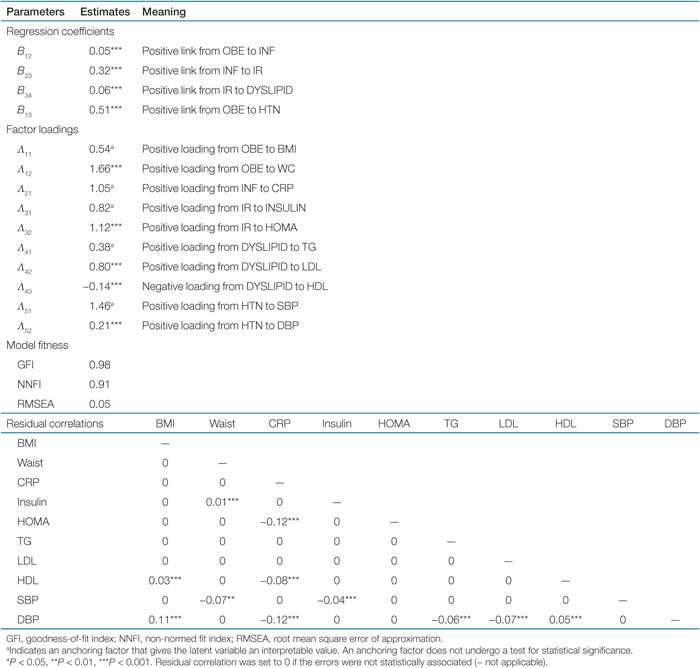
The results of the complex interactions between the main components of MS were conceptualized in 1. After adjustment of the effect of age, sex, and smoking, the SEM showed that OBE led to INF (B12 = 0.05, P < 0.001), which in turn led to IR (B23 = 0.32, P < 0.001). Consequently, IR directed to DYSLIPID (B34 = 0.06, P < 0.001). The parameter (B) was the same as a regression coefficient in a multiple linear regression model. Each s.d. above the average in OBE would be associated with and predictive of 0.05 s.d. increase in INF (B12). Although OBE only explained a small portion of variance of INF, this link was statistically significant (P < 0.001). The correlation between OBE and HTN was stronger. Each s.d. increase in OBE was associated with 0.51 SD (B15, P < 0.001) increase in BP. However, the links from INF to HTN and from IR to HTN were not statistically significant, and therefore, removed from the model. The final parameter estimates and model fitness of SEM were summarized in Table 2.
 |
Confirmatory factor analysis of the SEM demonstrated that in addition to BMI (Λ11 = 0.54), waist circumference provided information for defining the severity of OBE (Λ12 = 1.66, P < 0.001) in spite of a high correlation between the two measures (0.925, P < 0.001). CRP alone could represent the extent of inflammation (Λ21 = 1.05). The correlation between fasting glucose and insulin, and between fasting glucose and HOMA was 0.272 (P < 0.001) and 0.573 (P < 0.001), respectively. Although there was a near-linear correlation between insulin and HOMA (r = 0.914, P < 0.001), confirmatory factor analysis was still able to find statistically significant loadings onto these two factors. IR could be best represented by increased insulin level (Λ31 = 0.82) and worsening HOMA (Λ32 = 1.12, P < 0.001). Dyslipidemia was manifested as increased TG (Λ41 = 0.38), increased LDL (Λ42 = 0.80, P < 0.001), and decreased HDL (Λ43 = −0.14, P < 0.001). HTN loaded positively to both SBP (Λ51 = 1.46) and DBP (Λ52 = 0.21, P < 0.001).
In terms of model fitness, goodness-of-fit index was 0.98 and non-normed fit index was 0.91. Root mean square error of approximation was equal to 0.05. All of these indicators showed a good fitness of the data to the final model. The complex interaction between variables in these subjects could be perfectly conceptualized by the structure shown in 1. Residual correlations between the measured variables were reported in Table 2.
Discussion
Our model has demonstrated that obesity directed to an inflammatory process, which could be the precursor of insulin resistance and dyslipidemia (8,14). Many reports have linked inflammatory response to the development of insulin resistance (15,16). Also, inflammatory cell infiltration within adipose tissue may be involved in altering adipocyte lipid and cytokine production, which may in turn have downstream effects on other metabolically important tissues (17).
In addition, there is a positive direct association between increased body component and elevated BP. Arterial hypertension in obesity is thought to be related to high circulating volume (18), reduced bioavailability and lower production of nitric oxide, increased vascular tone (19), upregulated sympathetic tone (20), and increased expression of angiotensinogen by adipose tissue (21). The SEM analysis here is not sensitive to the possibility that insulin resistance and BP are interrelated through a mechanism other than obesity (9). Development of hypertension has been linked to chronic low-grade inflammation, but it is not clear whether the connection is direct or mediated by features of MS (22). In a Dutch study aiming to investigate the relationship between CRP and MS components, the association between CRP and BP was weak and not statistically significant after careful stratification by overweight status (23). Our model has suggested that the relationship between high BP and insulin resistance/inflammation could be attributed to sharable common causes, i.e., obesity.
The good quality and internal consistency of model fitness suggested the link would represent a potential direction among these entities. Although the essence of SEM is to verify a model based upon cross-sectional data, a precise causal relationship should be relied on further prospective studies. In addition, the good fit in our model does not rule out other equally good fit by another model consistent with a different hypothesis. For example, clear evidence also shows that glucose challenge and increased free fatty acids could increase inflammatory response (24,25,26). Although it is confirmatory that obesity leads to a chronic inflammatory state that interferes with metabolic signal transduction, the reverse could also apply where aberrant metabolic control and inflammatory consequences accelerate obesity. We did try to modify our model by switching the sequence between OBE, INF, and IR. However, the SEM did not obtain a convergence in parameter estimation, indicating a lack of confirmation that insulin resistance precedes inflammation or obesity in the NHANES data set.
Due to plenty of missing data in the lipid profiles of other ethnic groups, only the white adults were included for analysis. However, the authors later applied the same model to the metabolic profiles in a group of Taiwanese obese population and cross-validated the model. Clinical implications are almost the same between the white and the Taiwanese (27) participants. The obesity-inflammation link seems relatively unimportant (standardized regression coefficient is only 0.05) in the general U.S. population but much bigger in the Taiwanese obese group (B = 0.69, P < 0.001). This discrepancy may reflect either racial variation or even a stronger nonlinear association with worsening obesity (27).
One of the limitations of this study was that we did not measure inflammatory markers other than CRP, nor did we evaluate biomarkers related to the development of endothelial dysfunction and impaired fibrinolysis. Other factors associated with metabolic derangement contributing equal to or more than obesity, e.g., physical inactivity, unhealthy diet, and socioeconomic status, were not considered and will be analyzed in future studies.
The results of the cross-sectional analysis in the white participants have shown that obesity has a strong influence on hypertension that obtains little additional influence from inflammation or insulin resistance. The metabolic profile in the NHANES group has been confirmatory with the statement that there is a sequential effect from obesity to inflammation, insulin resistance, and dyslipidemia. This approach has allowed to inferring important biologic insights about the nature of the relationships among the components of MS.
Acknowledgment
J-.W.L. has full access to all of the data in the study and takes responsibility for the integrity of the data and the accuracy of the data analysis. Part of this manuscript has been presented by J.-W.L. and L.-Y.L. in the poster session of the Arteriosclerosis, Thrombosis, and Vascular Biology Annual Conference 2007, Chicago, USA. The same methodology was applied to a Taiwanese cohort to make a cross-racial validation. Another manuscript entitled “Illustrating the Roles of C-Reactive Protein in the Development of the Metabolic Syndrome in Women—a Cross-Racial Validation” will be published on Nutrition, Metabolism and Cardiovascular Disease (e-pub ahead of print 29 March 2008).
Disclosure
The authors declared no conflict of interest.


