Investigation of optimal position for implantable loop recorders by potential mapping with Reveal DX
Abstract
Background
Electrode positioning is important for the operation of implantable loop recorders (ILRs). This study aimed to investigate optimal electrode positions for the implantation of ILRs.
Methods
Fifteen male subjects participated in the study and R wave amplitude data were collected from 15 areas in the left anterior chest area, with 4 variations of electrode angles and body positions.
Results
The estimated minimum R wave amplitude values were greater than 0.3 mV (manufacturer-recommended value) when electrodes were angled vertically and positioned on the midclavicular line of the third and the forth intercostal spaces or on the left sternal border of the fourth and fifth intercostal space and when angled at 45° to the right on the left sternal border of the third and the forth intercostal space.
Conclusions
Exploring areas around the left sternal border of the fourth intercostal space – where the R wave amplitudes are least affected by body positions – is a reliable method for choosing implantation locations for ILRs.
1 Introduction
Implantable loop recorders (ILRs) were introduced in Japan in October 2009 as an effective diagnostic tool for unexplained recurrent syncope [1]-[3]. By August 2012, ILRs had been implanted in approximately 850 patients. Representative randomized trials explored and provided evidence for their efficacy in patients with neurally-mediated syncope (NMS), and these include RAST [4] (Randomized Assessment of Syncope Trial), ISSUE [5]-[7], and ISSUE2 [8]. The PICTURE [9] trial revealed the usefulness of early implantation of ILRs, and the number of cases has increased remarkably ever since the introductory phase. Furthermore, as ILRs are smaller in size than other cardiac devices, such as pacemakers, implantable cardioverter defibrillators, and devices for cardiac resynchronization therapy, the implantation procedure is relatively safe.
In order to accurately diagnose the causes of syncope, ILRs should be implanted in a region with higher R wave amplitude [10]. However, R wave amplitude often varies depending on body position, and this can lead to temporary undersensing, resulting in false diagnoses of bradycardia, cardiac arrest, or chronic R wave amplitude decrement, all of which demand surgical intervention [11], [12].
At present, the most efficient approach to the selection of electrode positions is still undetermined; thus, surgical time is extended while the best position is sought for each procedure.
In order to reduce surgical duration times and to maintain the sensitivity and specificity of ILRs, it is important to characterize each potential electrode position.
This study investigated the changes in R wave amplitude at different locations and angles of implanted electrodes, as well as different body positions of the patient, using a Reveal® cardiac monitor (Medtronic Inc., Minneapolis, MN, USA). The aim was to locate the optimal position for implantation in order to avoid false detection of arrhythmias.
Basic information regarding this device is as follows. Distance between the electrodes is 40 mm, the size of this device is 19×62×8 mm. The manufacturer-recommended implant zones are either between the first intercostal space and the fourth rib (the V3 area) or between the fourth and the fifth rib. At these locations it is possible to obtain an R wave amplitude greater than 0.3 mV.
2 Materials and methods
Fifteen healthy adult men participated in this study. The left anterior chest area was subdivided into 15 regions based on 5 longitudinal points (from the second to the sixth intercostal spaces) and 3 lateral points (including the left sternal border, midclavicular line, and anterior axillary line) (Fig. 1). The R wave amplitude was recorded by identifying the center of the simulant bipolar electrodes in each area by rotating the electrodes to the vertical axis (A), horizontal axis (B), 45° to the left (C), and 45° to the right (D) (Fig. 1).
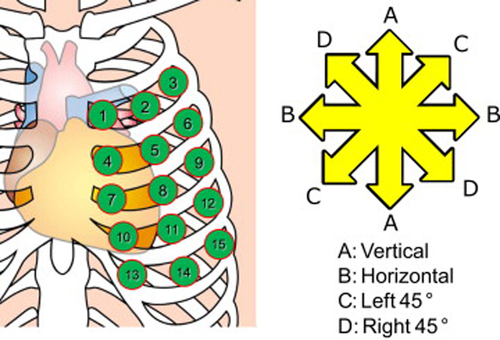
Electrode sites and directions of rotation.
Additionally, each participant assumed 4 body positions: supine, right lateral, left lateral, and a standing position. When each point, angle, and body position was combined, the R wave amplitude was recorded, for a total of 240 patterns per participant.
In addition, there is a flap-electrode attached to the package of the Reveal DX (Fig. 2), and it is possible to measure the R wave amplitude using this electrode. However, the flap-electrode is single-use, and this trial required the measurement of many patterns; thus, the durability of the electrode was unknown.
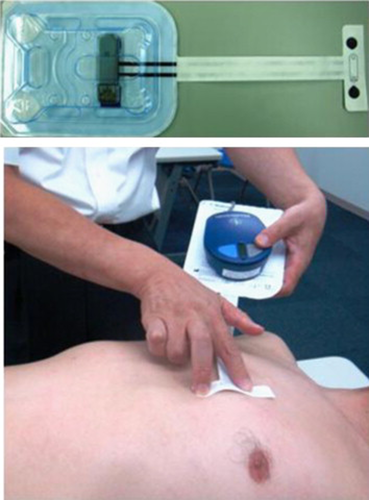
Measuring method using an electrode included with the Reveal DX.
Thus, we used a normal disposable electrode with the same electrode spacing as the Reveal DX to measure the R wave amplitude in the present study (Fig. 3).
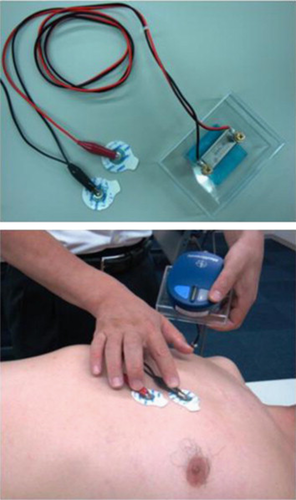
Measuring method using a disposable electrocardiogram electrode used in this experiment.
All subjects in this study provided informed and written consent.
3 Results
3.1 Distribution of R wave amplitude
The R wave amplitude data was recorded in each electrode position and angle for all 15 participants and was analyzed under the assumption of normal distribution. The data were recorded on normal probability paper and tested for a good fit. The determination coefficient was 0.961±0.033, and the R wave amplitude data were assumed to fit a normal distribution pattern.
3.2 Variation of the R wave amplitude in the supine position (mV)
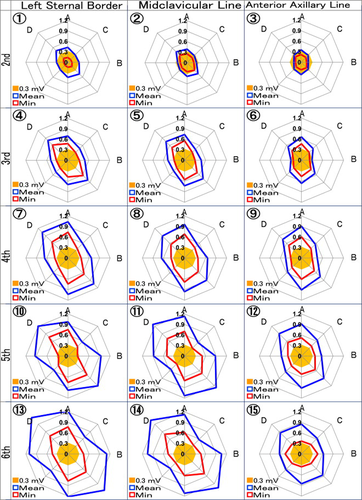
As the R wave amplitude data were considered to be normally-distributed, minimum amplitude values were estimated by subtracting double the value of the standard deviation from the mean value of each participant's R wave amplitude data collected in the supine position. The estimated minimum amplitude values (Min) and the mean values were illustrated as cobweb charts and are presented in Fig. 4. A total of 97.7% R wave amplitudes recorded in this study had an amplitude greater than the value of the estimated minimum amplitude.
Variation of the R wave amplitude in the supine position.
In addition, the labels 1–15 displayed in Fig. 4 correlate to the site labels in Fig. 1.
The axes of the cobweb charts represent the angles of the electrodes (A, B, C, and D respectively correspond to the vertical, horizontal, 45° left, and 45° right angles as in Fig. 1). The positive and negative values for each axis of ABCD are also shown. The minimum value of each axis was 0 mV, and the maximum value was 1.2 mV, with a scale interval of 0.3 mV.
The area in orange (Fig. 4) represents the R wave amplitude and is lower than the manufacturer-recommended amplitude (0.3 mV). Moreover, the mean (blue line in Fig. 4) designates the average value, and Min (red line in Fig. 4) designates the estimated minimum amplitude.
The estimated minimum amplitude less than 0.3 mV was observed at every electrode position on the second intercostal space (1, 2, and 3, regardless of electrode angle) at electrode positions 5, 6, and 9 (with a horizontal angle) (B).
The mean R wave amplitude value was greatest in area 13 with angle D (1.46 mV), followed by areas 14D (1.36 mV), 11D (1.27 mV), 13A (1.22 mV), and 10D (1.20 mV). As an overall trend, the area at the lower intercostal space had a higher R wave amplitude, while lower values were observed at the lateral position (near the anterior axillary line) (Fig. 4).
3.3 Rate of change of R wave amplitude due to postural change originating from the supine position (mV)
Fig. 5 shows the impact of body position on the R wave amplitude for each electrode position and angle. The thick, black line represents the base supine position. The scale represents the differences in R wave amplitudes as measured in each body position (right lateral position: red line; left lateral position: green line; standing position: blue line) and compared to the supine position within a range of −0.5 to +0.5.
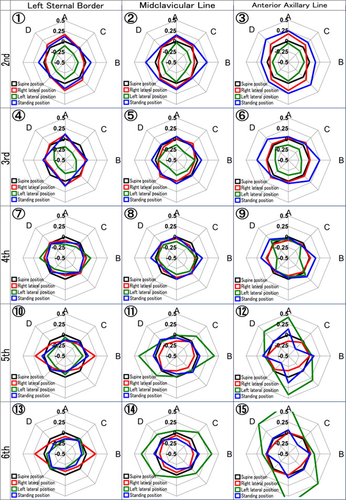
The rate of change of the R wave amplitude due to postural change from the supine position.
Variation in R wave amplitudes was small at positions 7 and 8 for all angles except horizontal. Relatively less variation was observed at every area on the left sternal border and the fourth intercostal space. However, if electrodes were moved superiorly, inferiorly, or outside of this position, R wave amplitude changed depending on participants' body positions. If electrodes moved superiorly, the amplitude increased in the standing position and decreased in the left lateral position, and vice versa if electrodes moved inferiorly.
3.4 Variation of R wave amplitude in all body positions
Fig. 6 illustrates variations in the R wave amplitude in each participant and all body positions. In this cobweb chart, the area in yellow (0.3 mV) indicates values below the manufacturer-recommended reference base, the red line indicates the minimum amplitude (Min), and the blue line represents the mean value (Mean).
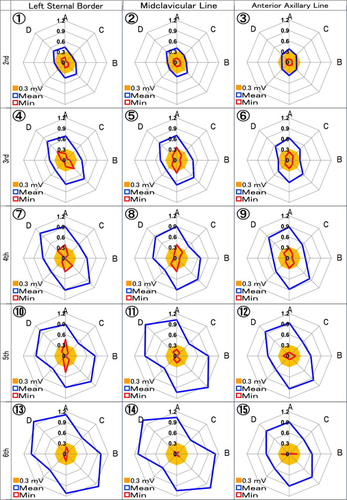
Variation of the R wave amplitude in all body positions.
On average, high R wave amplitude was attained at positions 13 and 14 on the sixth intercostal space and at position 11 on the fifth intercostal space. However, R wave amplitude varied widely in these electrode positions, and the estimated minimum amplitude values fell below 0.3 mV. The electrode positions with an estimated minimum amplitude greater than 0.3 mV were 5, 7, 8, and 10 with angle A (vertical) or positions 4 and 7 with angle D (right 45° angle).
4 Discussion
This study aimed to investigate the optimal electrode position for ILR implantation with a high R wave amplitude and no height variation, regardless of different body positions and electrode angles. In the present study, the R wave amplitude data collected from 15 participants at all body positions and electrode angles were assumed to be normally distributed. The mean (m) and the standard deviation (σ) were calculated, and the minimum amplitude value was estimated by subtracting twice the value of the standard deviation from the mean value (m−2σ).
Fig. 7 shows an example of the actual R wave amplitude distribution attained in this study and the optimal normal distribution curve calculated by normal probability plotting. Furthermore, the mean and the standard deviation of the optimal normal distribution curve were calculated and m±σ and m±2σ are also shown in the graph. It was shown that 97.7% of the R wave amplitude (filled area) was greater than the estimated minimum amplitude value (m−2σ, in this case 0.144 mV).
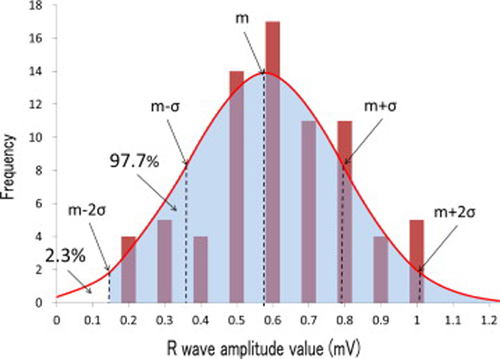
An example of the actual R wave amplitude distribution attained in this study and the optimal normal distribution curve, calculated by normal probability plotting.
Generally, the aforementioned statistics are used with the estimated minimum amplitude value calculated by subtracting 3σ from the mean value (i.e., 99.9% of the data is greater than this value). However, if this was followed in the present study, the electrode positions with an estimated minimum amplitude value greater than 0.3 mV (manufacturer-recommended value) would not have existed. Hence, this study accepted m−2σ as the estimated minimum amplitude value.
The amplitude data obtained from subjects in the supine position had an estimated minimum amplitude value greater than 0.3 mV (although some areas fell slightly below this but within acceptable limits), with the only exception being the data gathered at the second intercostal space. Namely, when electrode positions were investigated in the supine position, all areas except for the second intercostal space reached acceptable amplitude values. Additionally, the R wave amplitude was inclined to increase with electrodes located either on the inferior intercostal space or closer to the sternum, while right 45° or vertical angles attained higher R wave amplitudes.
Taking body positions into consideration, the variation ratio of the R wave amplitude was smallest along the midclavicular line and the left sternal border of the fourth intercostal space (positions 8 and 9, respectively). Electrodes were positioned on exterior, superior, or inferior areas, and R wave amplitude was affected by body positions.
Thus, if the region for implant was chosen based only on the height of the R wave amplitude in the supine position, the electrodes might be located in an area where amplitude varies as a result of changes to the body position; this in turn could lead to false diagnoses. In order to avoid this, the most reliable method for choosing an implant position was presumed to be investigation of the areas around the left sternal border of the fourth intercostal space, where the impact of body position was the smallest. R wave amplitude values should be greater than 0.3 mV regardless of body position.
5 Conclusion
If the location for ILR implant is chosen based only on the height of the R wave amplitude in the supine position, the electrodes could be located in an area where amplitude varies by changing body positions which could lead to false diagnoses. Although R wave amplitudes change depending on body positions, the minimum amplitude value was estimated to be greater than the manufacturer-recommended value of 0.3 mV on the midclavicular line on the third intercostal space position 5, the left sternal border on the fourth intercostal space position 7, the midclavicular line on the fourth intercostal space position 8, and the left sternal border on the fifth intercostal space position 10, with electrodes positioned at a vertical angle (A), or on the left sternal border at positions 4 and 7 on the third and fourth intercostal spaces at a right 45° angle (D).
Conflict of interest
The authors of this manuscript have no conflicts of interest to declare.
A. Kawashima, F. Tanimoto, and T. Nagao are employed by Medcare Ltd. (distributor of medical equipment).
T. Toyoshima is employed by the Technical Fellow, Cardiac Rhythm Disease Management Unit, USCI Holdings Inc.
Acknowledgments
The authors would like to thank Ms. M. Toyoda (Clinical Specialist, Osaka, West Region Cardiac Rhythm Disease Management, Medtronic Japan Co., Ltd.) for assistance with the English translation of this paper.


