Is ventilatory efficiency (VE/VCO2 slope) associated with right ventricular oxidative metabolism in patients with congestive heart failure?
Abstract
Background:
The relationship between minute ventilation and the rate of CO2 elimination (VE/VCO2 slope) is associated with mortality in patients with congestive heart failure (CHF). The VE/VCO2 slope ≥ 34 denotes a poor prognosis and has been proposed to reflect abnormalities in pulmonary perfusion.
Aims:
To study whether increased VE/VCO2 slope is associated with elevated right ventricular (RV) oxidative metabolism relative to the left ventricle (LV).
Methods:
21 patients with stable NYHA II–III CHF underwent symptom limited cardiopulmonary exercise testing. Dynamic [11C]acetate positron emission tomography (PET) was used to measure oxidative metabolism (kmono) of the LV and RV. Corrected RV oxidative metabolism (RVOx) was calculated as RV/LV kmono ratio.
Results:
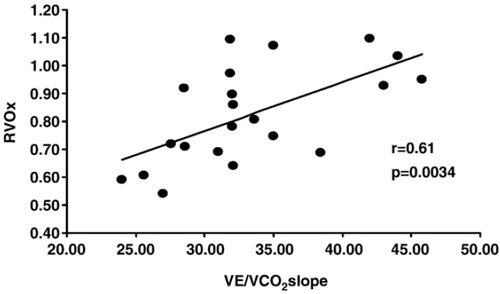
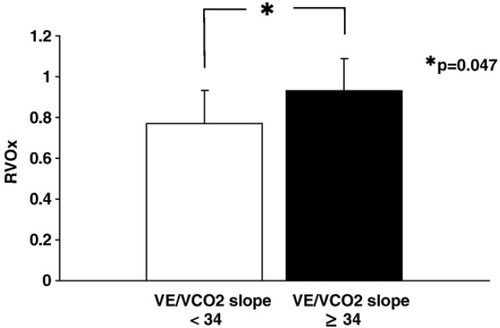
Peak VO2 was 16.2±4.1 ml/min/kg and the VE/VCO2 slope was 33.4±6.1. LV and RV kmono were 0.046±0.009 and 0.037±0.007 min−1, respectively, with a RVOx of 0.83±0.17. There was a good correlation between RVOx and the VE/VCO2 slope (r=0.61, p=0.0034). RVOx was 0.77±0.16 in patients with a VE/VCO2 slope <34 and 0.93±0.16 in patients with VE/VCO2 slope ≥34 (p=0.047).
Conclusion:
RVOx correlates with VE/VCO2 slope in CHF patients. This supports the hypothesis that pulmonary vascular resistance is a determinant of the VE/VCO2 slope.
1. Introduction
Patients with congestive heart failure (CHF) continue to have high rates of hospitalisation, morbidity, and mortality, despite advances in treatment 1. Cardiopulmonary exercise testing has been used to identify individuals at the highest risk for cardiac death and need for cardiac transplantation 2. Peak exercise capacity, expressed as peak oxygen uptake (peak VO2), and the slope of the relationship between ventilation and CO2 production, or ventilatory efficiency (VE/VCO2 slope), have been shown to predict outcome in CHF patients 2,3. The VE/VCO2 slope provides additional independent prognostic information beyond peak VO2 and is closely related to symptoms 4. One of the proposed mechanisms for an increase in VE/VCO2 slope in chronic CHF patients is an abnormal pulmonary perfusion 5,6.
Compared to the normal left ventricle (LV), myocardial oxidative metabolism of the failing LV at rest is often unchanged; while LV efficiency is impaired 7,8. In contrast, oxidative metabolism of the resting right ventricle (RV) tends to be elevated in the failing heart, likely due to increased pulmonary vascular resistance 9. Therefore, elevated RV oxidative metabolism may be related to an increase in the VE/VCO2 slope, and thus may provide prognostic information in CHF patients. There is a paucity of data on the relationship between RV and LV oxidative metabolism, LV efficiency, and the interaction with exercise tolerance in patients with CHF.
The purpose of this study was to evaluate biventricular oxidative metabolism using [11C]acetate positron emission tomography (PET) and the interrelationship between LV and RV oxidative metabolism, LV efficiency and the exercise parameters of known prognostic value - peak VO2 and VE/VCO2 slope - in patients with stable CHF 9,10.
2. Methods
2.1. Subjects
The study population consisted of 30 consecutive consenting patients with stable NYHA class II-III CHF who had a reduced LVEF by radionuclide angiography, an ability to exercise and no other significant co-morbidities that could affect exercise tolerance or outcome. Heart failure medication was stable for at least 1 month before the study. Patients were excluded if they were unable to achieve adequate exercise (respiratory exchange ratio, RER <1.0). Of the 30 patients screened, 22 achieved an RER >1. One additional patient was excluded because of LV thrombus. Thus, the study cohort consisted of 21 patients.
2.2. Study design
The relationship between myocardial energetics and exercise capacity in CHF patients was studied using [11C]acetate PET imaging to measure oxidative metabolism; echocardiography to measure LV volumes and stroke work, and a 6-minute walk and cardiopulmonary exercise test to measure exercise capacity. On the study day, cardiac performance was measured by echocardiography and followed immediately by a [11C]acetate PET study. The 6-minute walk test and cardiopulmonary exercise testing were performed within 11±13 days of the combined echo/PET studies. There was no change in clinical status or medication between testing. The protocol was approved by the Ethics Review Board of University of Ottawa Heart Institute. Informed consent was obtained in all subjects.
2.3. Positron emission tomography
Patients were positioned in a whole body ECAT ART PET scanner (Siemens/CTI, Knoxville, TN). Following the 5-minute transmission scan, 370 MBq of [11C]acetate was administered intravenously and a dynamic PET acquisition was initiated (10×10 s; 2×30 s; 5×100 s; 3×180 s, 2×300 s).
2.4. PET data analysis
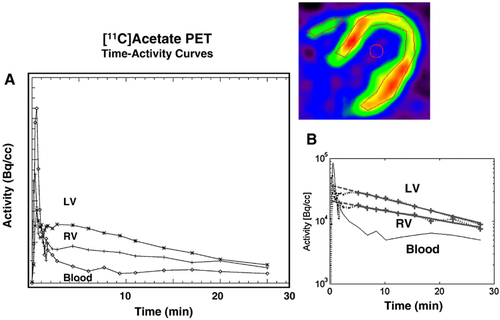
The reconstructed dynamic PET images were analyzed by applying five regions of interest (ROI) covering the septum, anterior wall, lateral wall, whole LV myocardium and free wall of the RV, respectively, in three to five midventricular transaxial planes 11. A monoexponential function was fit to the myocardial time-activity data and monoexponential clearance rates (kmono) were determined for each ROI and averaged across planes (Fig. 1) 9,11. Due to known individual variation (physiological and pathophysiological) in both RV and LV myocardial oxidative metabolism, normalized RV oxidative metabolism was used for analysis, Normalized or corrected RV oxidative metabolism (RVOx) was calculated as RV kmono/LV kmono.

2.5. Echocardiography
Echocardiography examinations were performed using a Phillips HP 2500 or 5500 cardiac ultrasound system (Andover, Massachusetts). Stroke volume (SV) was measured using Doppler echocardiography 12 and stroke work index (LVSWI) calculated as 8,9,11:
 (1)
(1)where SVI is SV indexed to body surface area and SBP is systolic blood pressure. LV volumes were calculated using the method of discs 13. Mitral regurgitation (MR) was quantified by measuring the largest regurgitant jet area on Doppler colour flow imaging 14.
2.6. Work metabolic index determination
Myocardial efficiency was derived using the work metabolic index (WMI) 8,9,11:
 (2)
(2)where HR is heart rate. All PET and echocardiographic data were analyzed blinded to the patient's clinical and exercise data.
2.7. Cardiopulmonary exercise testing
All study patients underwent a symptom limited, treadmill test to volitional fatigue with respiratory gas exchange analysis. Metabolic measurements were made using a Medgraphics CPX-D system operating Breeze Suite 5.3 software (Minneapolis, Minn, USA). Patients continued medical therapy on the day of the exercise test. VO2, carbon dioxide release (VCO2), tidal volume, RER and respiratory rate, were measured. A slow ramp (n=18) or a regular ramp (n=3) protocol were performed using 1-minute stages, constant speed and an increased grade every minute. Protocol selection was designed to obtain a peak exercise capacity within 8 to 12 min. HR and rhythm were monitored by 12-lead electrocardiogram (GE Case 8000 stress testing system GE, WI, USA.) Blood pressure was determined manually using a mercury Baumanometer (W.A. Baum Co., Inc.; Copiague, NY 11726). BP and rating of perceived exertion (RPE) were obtained at the end of each stage. Gas exchange data was collected in a breath-by-breath manner and averaged into 30-second time periods. Peak VO2 was calculated as the highest 30-second time period before volitional fatigue was reached. Anaerobic threshold (VO2 AT) was measured by the V-slope method 15. The VE/VCO2 slope was calculated by linear regression, excluding the nonlinear part of the data after the onset of ventilatory compensation for metabolic acidosis. A VE/VCO2 slope of 34 was defined as a threshold value based on the published data on prognosis in patients with CHF 3,16,17.
2.8. Six-minute walk test
The 6-minute walk test was performed on a level hallway surface 28 m long according to the method of Guyatt et al. 18 and administered by a nurse blinded to the clinical and research data. The total distance walked in meters during the 6-minute walk test was recorded. HR, BP and symptoms were recorded before, and at 6 min 17. Cardiopulmonary exercise tests and 6-minute walk data were analyzed blinded to clinical and imaging data.
2.9. Statistical analysis
Data are expressed as mean±SD. Correlation coefficients were calculated using Pearson's correlation coefficient. Comparisons were performed using paired t-testing and unpaired t-testing where appropriate. A p value≤0.05 was considered significant. Statistical calculations were carried out using SPSS 10.0 software.
3. Results
3.1. Subjects
The characteristics of the 21 patients are shown in Table 1.
| Sex (F/M) | 6/15 |
| Age (years) | 64±10 |
| BMI | 29±4 |
| Aetiology | |
| Ischaemic | 16 (76%) |
| Non-ischaemic | 5 (24%) |
| LVEF (%) | 29±8 |
| NYHA class | |
| II | 11 (52%) |
| III | 10 (48%) |
| Medications | |
| ACE-I | 19 (90%) |
| BB | 19 (90%) |
| DIU | 15 (71%) |
| DIG | 4 (19%) |
| LVEDD, mm | 66±8 |
| SVI, mL/m2 | 35±8 |
| LVSWI, L mm Hg | 4.6±1.3 |
| MR jet area, cm2 | 2.6±2.2 |
- a BMI indicates body mass index; LVEF, left ventricular ejection fraction; NYHA, New York Heart Association; ACE-I, ACE inhibitors; BB, beta-blockers; DIU, diuretics; DIG, digoxin. LVEDD, left ventricular end-diastolic diameter; SVI, stroke volume index; LVSWI, left ventricular stroke work index; MR, mitral regurgitation.
3.2. Exercise parameters
Exercise data in the 21 patients are summarized in Table 2. In three patients, ST-segment depression was observed. Peak VO2was reduced at 16.2±4.2 mL/kg/min and VE/VCO2 slope was elevated (33.4±6.1) compared to previously published normal values 19.
| Heart rate, min−1 | Rest | 62±11 |
| Peak stress | 119±20 | |
| Systolic BP, mm Hg | Rest | 124±19 |
| Peak stress | 145±30 | |
| Diastolic BP, mm Hg | Rest | 76±9 |
| Peak stress | 79±10 | |
| Ischaemia by ST-segment criteria (yes/no) | 4/17 | |
| Peak VO2 (mL/kg/min) | 16.2±4.2 | |
| VO2 at AT (% of peak VO2) | 71±9 | |
| RER | 1.1±0.08 | |
| VE/VCO2 slope | 33.4±6.1 | |
| Six-minute walk test (m) | 382±74 |
- a BP indicates blood pressure; Peak VO2, peak oxygen uptake; VO2 at AT, oxygen uptake at anaerobic threshold, RER, respiratory exchange ratio; VE/VCO2 slope, ventilatory efficiency.
3.3. Positron emission tomography
Representative time-activity curves are depicted in Fig. 1. kmono was 0.046±0.009 in the LV and 0.037±0.007 for the RV (Table 3). RVOx was 0.83±0.17. WMI was 6.15±1.67×106 mm Hg mL/m2.
| Measure | |
|---|---|
| LV kmono, min−1 | 0.046±0.009 |
| RV kmono, min−1 | 0.037±0.007 |
| RVOx | 0.83±0.017 |
| WMI (mm Hg mL/m2)×106 | 6.15±1.67 |
- a LV kmono indicates myocardial oxidative metabolism in the left ventricle; RV kmono, myocardial oxidative metabolism in the right ventricle; RVOx, RV/LV kmono ratio; WMI, work metabolic index.
3.4. Relationship of cardiac work, oxidative metabolism and exercise (Table 4)
LVSWI did not correlate with peak VO2 (r=−0.23, p=0.31), VE/VCO2 slope (r=0.03, p=0.90) nor the distance achieved during the 6-minute walk test (r=−0.14, p=0.54). Similarly, LV kmono and WMI did not correlate with the peak VO2 (r=−0.28, p=0.22 and r=0.10, p=0.66), VE/VCO2 slope (r=−0.32, p=0.15 and r=0.22, p=0.33) nor distance achieved during the 6-minute walk test (r=−0.084, p=0.72 and r=−0.21, p=0.36), respectively (Table 4).
| Peak VO2 | VE/VCO2 slope | 6-minute walk test | |
|---|---|---|---|
| LVSWI | −0.23 | 0.03 | 0.14 |
| LV kmono | −0.28 | −0.32 | −0.084 |
| RV kmono | −0.42* | 0.40† | −0.18 |
| RVOx | −0.19 | 0.61‡ | 0.058 |
| WMI | 0.10 | 0.22 | −0.21 |
- a LVSWI indicates left ventricular stroke work index; LV kmono, myocardial oxidative metabolism in the left ventricle; RV kmono, myocardial oxidative metabolism in the right ventricle; RVOx, normalized RV oxidative metabolism; WMI, work metabolic index; peak VO2, peak oxygen uptake: VE/VCO2 slope, ventilatory efficiency.
- * p=0.055,
- † p=0.071, ‡p=0.0034.
RV kmono tended to correlate with peak VO2 (r=−0.42, p=0.055) and VE/VCO2 slope (r=0.40, p=0.071). However, the correlation with peak VO2 was lost when correcting RV oxidative metabolism for LV oxidative metabolism (RVOx) (r=−0.19, p=0.42). In contrast, a good correlation between RVOx and VE/VCO2 slope was observed (r=0.61, p=0.0034) (Fig. 2). Importantly, RVOx was lower in patients with VE/VCO2 slope <34 compared to the RVOx in patients with a slope ≥34 (0.77±0.16 vs. 0.93±0.16; p=0.047, Fig. 3), a threshold related to poor prognosis in CHF 3,16,17. FEV-1 (1.75±0.50 vs. 2.57±0.45, p=0.0035) and FVC (2.57±0.58 vs. 3.40±0.56 L, p=0.0084) were lower in our patients with VE/VCO2 slope ≥34.


4. Discussion
Peak VO2 and VE/VCO2 slope obtained during cardiopulmonary stress testing are valuable predictors of outcome in CHF patients, yet the interrelationship between these exercise parameters with LV and RV oxidative metabolism, and LV myocardial efficiency is poorly understood. In the current study, we have demonstrated that LV oxidative metabolism and myocardial efficiency at rest are not related to exercise parameters (peak VO2 or VE/VCO2 slope) in patients with stable NYHA class II-III CHF. In contrast, corrected RV oxidative metabolism had a good linear correlation with VE/VCO2 slope.
4.1. Oxidative metabolism in the left and right ventricle
Myocardial oxidative metabolism is the primary biochemical pathway for the conversion of substrates into energy that will be used for contraction and other cellular functions. It has been well demonstrated that oxidative metabolism can be measured using the kinetics of [11C]acetate with dynamic PET imaging which reflects TCA cycle flux and myocardial oxygen consumption in animal models and humans 20 21 22 23 24.
In the normal myocardium, metabolic demand of the RV is less than the LV reflecting the lesser metabolic demand required of the RV. However in heart failure, RV oxidative metabolism increases relative to the LV 9, which may reflect a relative increase in metabolic demand for the RV compared to the LV. In the current study, this corrected RV oxidative metabolism was higher than published normal values 9. Forward efficiency and work are often compromised as cardiac function deteriorates without a concomitant decrease in myocardial oxygen consumption i.e. instead of useful forward work, the heart uses its' energy to overcome increased wall stress.
4.2. Previous studies on oxidative metabolism and exercise in heart failure
The level of resting LV oxidative metabolism, as measured by kmono of [11C]acetate is the same in mild to moderate congestive heart failure and healthy volunteers 7. However, in advanced heart failure LV oxidative metabolism is reduced 7. RV oxidative metabolism and RVOx are increased in decompensated heart failure 9. To our knowledge there are no published in vivo data on RV oxidative metabolism in patients with mild or compensated heart failure.
Stolen et al 25 studied 20 patients with dilated cardiomyopathy and mildly symptomatic heart failure (NYHA class I-II) and found that peak VO2 had an inverse relationship with the ratio of RV:LV oxidative metabolism. In contrast, we did not observe such a relationship, although there was a trend for a relationship between VO2 and RV kmono. The RER was >1 in both studies. However, patients were more symptomatic in our study (NYHA class 2.5±0.5 vs. 1.5±0.5 (Stolen et al. 25)). In addition, we included patients with ischaemic heart disease. Severity of disease and aetiology may explain the observed differences in the two studies.
4.3. VE/VCO2 slope and RV oxidative metabolism
The relationship between minute ventilation and the rate of CO2 elimination (the VE/VCO2 slope) is strongly associated with mortality in patients with CHF 4,16. The VE/VCO2 slope is also closely associated with symptoms in advanced CHF and provides complimentary prognostic information to peak VO2 17,26.
A VE/VCO2 slope >34 is associated with a poor prognosis 3,17. It appears that the determinants of the VE/VCO2 slope are multifactorial and include the peripheral ergoreceptor response 27 the muscle mass utilized for the exercise 28, increased ventilation/perfusion mismatch 5 and pulmonary vascular resistance (PVR) 29.
It is reasonable to assume that there would be an increased demand on the RV metabolism (as reflected by RV oxidative metabolism) due to the increased ventilation/perfusion mismatch and enhanced pulmonary vascular resistance. Therefore, a high VE/VCO2 slope may be associated with increasing RV oxidative metabolism. In our study, the ratio of RV:LV oxidative metabolism, or corrected RV oxidative metabolism, had a good correlation with the VE/VCO2 slope. There are significant variations in RV and LV oxidative metabolism in different physiological and pathophysiological circumstances. Therefore, correction of RV oxidative metabolism to LV oxidative metabolism (RV kmono/LV kmono ratio) may better describe the relative level of RV oxidative metabolism. Previous studies have demonstrated that RV oxidative metabolism is increased compared to LV metabolism in patients with CHF 9,25. This metabolic discordance likely reflects - at least in part - increased wall stress due to higher afterload in the RV leading to increased metabolic demand.
RV function contributes to exercise tolerance in patients with heart failure and carries prognostic value in this patient population 30,31. Further, mechanical discordance between the RV and LV has been associated with poor prognosis 30. In the current study, we have demonstrated a relationship between the corrected RV oxidative metabolism and a known prognostic marker, VE/VCO2 slope, which further emphasizes the importance of the RV in CHF. Increased RVOx may reflect the metabolic load that is present prior to exercise.
4.4. Limitations of the study
While the RVOx was related to a parameter known to have prognostic value, the prognostic value of RVOx itself was not specifically tested. This will require future clinical follow-up studies.
Ideally, exercise [11C]acetate data would have been compared to exercise VE/VCO2. However exercise PET imaging is not practical with [11C]acetate due to the requirement for early dynamic data and adverse effect of motion for supine exercise. Noteworthy is the observation that the VE/VCO2 ratio at rest and the VE/VCO2 slope during exercise are correlated 29. Catheterization (right and left side) was not part of our study protocol due its invasiveness. Therefore, direct measurements of pulmonary artery pressure were not available for our patients.
In spite of these limitations, the study does support a mechanistic link between RV oxidative metabolism and ventilation-perfusion mismatching.
5. Conclusions
Corrected RV oxidative metabolism - calculated as RV/LV kmono ratio - correlates with VE/VCO2 slope, a parameter of prognostic importance derived from exercise testing in patients with CHF. This supports the hypothesis that PVR is a major determinant of the VE/VCO2 slope and provides a possible physiological mechanism for the observed relation between decreased exercise capacity and increased VE/VCO2 slope. Whether RVOx derived using [11C]acetate PET, provides prognostic value itself, in patients with heart failure warrants further study.


