High-Fidelity Finite Element Model Development for Damage Detection of Wind Turbine Composite Blades
Funding: This work was supported by the research and development program of the Korea Institute of Energy Research (C5-2427).
ABSTRACT
The structural stiffness of a blade changes when it is defective, which affects its modal parameters. Consequently, modal parameters can be crucial to investigating defects. Therefore, developing a model that can accurately analyze the modal parameters of healthy and defective blades is essential. This study proposes a high-fidelity finite element (FE) model development method based on multiobjective optimization. Three 10-kW-class wind turbine blades were manufactured, and the modal parameter changes due to debonding damage were measured. The initial FE model was constructed using structural drawings and considering specific material properties. Subsequently, the modal analysis results were compared with the experimental results. The analysis errors of normal and abnormal blades were expressed as cost functions and multiobjective optimization was performed. Machine learning–based predictive models facilitated time- and cost-effective optimization, enabling modal updating that simultaneously reflects modal parameter changes for various blade models. Because accurately predicting the dynamic characteristics of blades by various defect locations and sizes is crucial for blade damage detection, the proposed method is significant for damage detection research.
1 Introduction
The blade is the key component that converts the kinetic energy of wind into mechanical energy that rotates the rotor in a wind turbine. For onshore wind turbines, the rotor accounts for approximately 20% of the total capital expenditure [1]. Blade failure typically leads to costly repairs or replacement and significant downtime [2]. Therefore, structural health monitoring (SHM) techniques to diagnose the condition of blades and detect defects during wind turbine operation are becoming increasingly important, and various acoustic and vibration-based methods have been developed [3-15]. Zhang et al. [5] devised a method for detecting blade cracks using aerodynamic noise by measuring and analyzing the aerodynamic noise due to changes in crack size on the blade trailing edge in a wind tunnel experiment. Poozesh et al. [7] developed a noncontacting measurement technique based on acoustic monitoring to detect structural damage in blades by observing sound radiation using an acoustic microphone array. Dervilis et al. [4] performed fatigue tests on a 9-m-long blade that was harmonically excited at its first natural frequency. They proposed a method to diagnose blade damage using measured vibration data and pattern recognition techniques. García and Tcherniak [15] developed a data-driven SHM methodology for detecting and monitoring damage growth in the trailing edge of a large wind turbine blade using a single accelerometer and actuator.
Some studies have revealed that most defect types are caused by damage to adhesive joints used for blade assembly [16, 17], and the specific debonding location of wind turbine blades in service can vary depending on factors such as blade design, material properties, manufacturing process, operating conditions, and maintenance practices. However, it typically occurs at the trailing edge in blades made with composite materials because the trailing edge experiences significant aerodynamic forces and can be vulnerable to fatigue and damage. Previous studies on debonding damages have also focused on the trailing edge [18-23]. When a defect occurs in the blade, its structural stiffness changes, affecting its natural frequency and mode shape. Thus, blade damage detection methods based on these modal characteristics have been continuously researched [22-29]. Larsen et al. [22] conducted modal tests on a 34-m-long wind turbine blade in a laboratory and compared the experimental results using finite element (FE) analysis. They reported that the mode shapes contain helpful information for detecting and localizing blade damage. Ulriksen et al. [23] performed an operational modal analysis on an SSP 34-m-long blade mounted on a test rig and introduced debonding to the blade at the trailing edge. They analyzed the mode shapes with one-dimensional continuous wavelet transformations to capture local mode shape irregularities resulting from structural damage. Jang et al. [25] proposed a model to identify debonding damage at the spar cap–shear web joint of the blades of a 5-MW-class Sandia offshore wind turbine. They obtained the natural frequencies corresponding to 1105 different debonding damages from a series of modal analyses using an FE model and developed an artificial neural network-based machine learning model to identify the debonding damage. However, their study only considered the FE analysis results without combining them with experimental results. In this case, the accuracy of the FE model may significantly affect the damage identification result. Chen and Griffith [26] proposed a modal analysis-based method to identify blade mass imbalance for a three-bladed wind turbine rotor. Their method considered the natural frequencies and mode shapes of the three first-order modes of the rotor obtained from FE analysis and physical measurements. However, they did not conduct any additional analysis to identify modeling errors in the FE models of wind turbine blades composed of composite materials, nor did they attempt to improve them. Chen et al. [27] also conducted an experimental modal test using a noncontact 3D scanning laser Doppler vibrometer. They investigated the high-order mode shape with complex curvatures and mode coupling of bending and torsional behavior from experimental and numerical analysis results. A reliable FE model of the three-bladed assembly was developed, and the modal analysis results using the FE model correlated well with experimental results. The scholars expect their approach to be significantly helpful in conducting structural and reliability analysis to determine the root cause or failure mechanism of the operating wind turbine blade. However, since they only performed numerical analysis modeling for normal blades, additional research on the modeling technique of abnormal blades is required for damage detection. Wang et al. [28] proposed a method for blade damage detection and diagnosis incorporating the FE method for dynamics analysis and information on the mode shape difference curvature. FE models of wind turbine blades have been built and modified via frequency comparison with experimental data and the formula for the model updating technique. Modal analysis of abnormal blades was performed by reflecting defects in the updated FE model of the normal blade. However, the accuracy of the FE model is expected to improve further if modal updating is performed using the experimental results of both normal and abnormal blades.
As mentioned earlier, modal parameters such as the natural frequency and mode shape of a blade can be utilized as key features to indicate the structural health of blades. Therefore, obtaining information on the variation of modal parameters with respect to different defect types and sizes through measurement and analysis is crucial. However, process errors are inevitable since blades are mostly manufactured by hand. Therefore, errors will inevitably occur in the actual measurement results if the FE model is constructed using only structural drawings of the blade and the physical properties of each material. Modal updating is necessary to overcome this by modifying the FE model to improve the accuracy of the analysis results using modal parameter information obtained through experiments.
The FE model of a wind turbine blade is generally created using the structural drawing and material properties of the blade and modal updating is performed to improve the FE analysis accuracy using the modal test results. The FE model of a damaged blade is generated by incorporating the defect type and size of interest into that of a nondefective (healthy) blade. However, previous studies investigating blade defects through FE analysis have failed to suggest a method that can systematically improve the accuracy of the FE model using the experimental results. In addition, research on generating high-fidelity FE models considering normal and abnormal blades is limited. Developing FE models that can express similar characteristics to actual abnormal blades with various defects and normal blades is necessary to analyze or detect blade defects using FE models. Studies on how to develop a high-fidelity FE model systematically are also required. This study thus proposes a method for constructing a high-fidelity FE model that can improve the analysis accuracy by considering various defect types and modes together using multiobjective optimization techniques.
Section 2 describes the modal tests performed on the 10-kW-class blade used in this study after fabrication and artificial debonding damage. The variation of the modal parameters with respect to the location and size of debonding damage identified through the modal tests is also analyzed. Section 3 presents the construction of FE models of undamaged and damaged blades using only the structural drawing and material properties of the blade and explains the analysis to obtain modal parameters according to the location and size of debonding damage. The results of this analysis are compared with the modal test results, and the error is analyzed to determine the need to apply a multiobjective optimization technique for modal updating. The optimization process requires tedious and iterative FE model modification and modal analysis. In this study, a machine learning–based predictive model was generated and used for iterative modal analysis to reduce the cost and time required for analysis and to perform efficient optimization. For this purpose, a data mining process in accordance with the Cross-Industry Standard Process for Data Mining (CRISP-DM) [30] was used to understand the data and generate the predictive model used for multiobjective optimization for modal updating. Section 4 describes the process of collecting modal analysis data and performing data mining using the design of experiments (DOE) technique. In particular, modal characteristic changes due to process errors and defects are systematically analyzed via design space exploration, and the performance of the FE model is verified. By understanding the impact of key modeling features on modal parameters, we define key features essential for modal updating and develop machine learning–based predictive models for multiobjective optimization. Section 5 presents a multiobjective optimization technique using machine learning–based predictive models. It also describes the procedure for adjusting the weights of each component of the cost function during the multiobjective optimization process. Finally, Section 6 demonstrates the performance of the proposed method by comparing the results before and after optimization, and the efficiency of the proposed optimization method is also analyzed.
2 Modal Tests
2.1 Wind Turbine Blade
Three blades of a 10-kW-class wind turbine, each with a length of 3658 mm, were manufactured to test and compare the modal parameters of damaged and undamaged blades. The average weight ratio of each part of the three blade assemblies and the weight deviation of each part, obtained by dividing the difference between the maximum and minimum weight values by the average value, are summarized in Table 1.
| Part | Weight ratio on product | Weight variation |
|---|---|---|
| Skin (w/ core) | 79.21% | 1.40% |
| Main spar | 7.73% | 5.55% |
| Support spar | 1.70% | 10.48% |
| Adhesive material | 11.36% | 4.04% |
| Blade assembly | 100.00% | 1.43% |
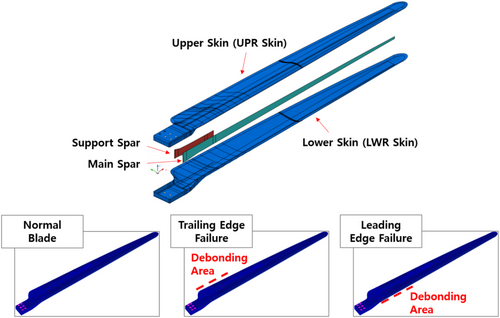
The trailing edge experiences significant aerodynamic forces and can be vulnerable to fatigue and damage. The leading edge also faces high stress due to wind loads and can be vulnerable to erosion and impact damage, which can lead to debonding. Therefore, in this study, the trailing and leading edges were selected as the areas of interest where debonding damage occurs. Artificial damage was introduced at the leading and trailing edges by removing the adhesive between the lower and upper skins of the blade surface, as shown in Figure 1. Two of the three undamaged blades were made defective at the leading and trailing edges, respectively. The maximum chord area of a wind turbine blade experiences the most significant bending moments and shear forces during operation, leading to high stress within the blade structure. Debonding at the maximum chord area is a critical failure mode. Therefore, in this study, the debonding damage began at the maximum chord position, located 545 mm longitudinally from the blade root. The size of the debonding damage was 500 mm for the leading edge (LE500) and 600 mm for the trailing edge (TE600).
2.2 Measurement System Configuration
The experimental setup for modal tests is depicted in Figure 2. The blades were horizontally mounted, with the suction side facing the ground, on a test rig fixed to the laboratory floor. Six triaxial accelerometers (Model: Dytran 3333A2) were mounted on the blade pressure side along the shear web at intervals of 600 mm from the root, as indicated by P1–P6 in Figure 2. During the test, the vibrations in the Y and Z directions, corresponding to the edgewise and flapwise directions, respectively, were measured without regard for the longitudinal vibration of the blade. Two uniaxial accelerometers (Model: SA11SC) were installed in the edgewise and flapwise directions at each of the five positions on the trailing edge, as indicated by P7–P11 in Figure 2. An impact hammer (Model: Dytran 5802A) was used to excite the blade in a wide frequency band in each direction at the P3 position. The excitation position was determined by pretesting performed to identify the best position to excite all modes below 100 Hz, which is the frequency range of interest in the blade structure.
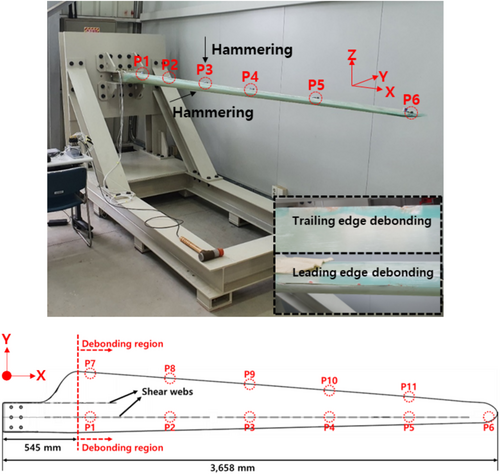
Twenty-two channel vibration signals were collected using the NI 9234 modules. Simultaneously, the force signal of the impact hammer was also measured. The sampling frequency was set to 1024 Hz, ensuring a useful bandwidth that covers the frequency of interest. The number of fast Fourier transform points was 8192, yielding a frequency resolution of 0.125 Hz. Three averages were obtained during impact testing. The measured signals were processed and analyzed using the m+p Analyzer software. The frequency response function (FRF) was estimated using the force signal of the impact hammer and the vibration signal of each accelerometer. The natural frequency was estimated by searching for the peak value in the amplitudes of each FRF and averaging the peak frequencies.
2.3 Modal Test Results
2.3.1 Undamaged Blades
Most blade manufacturing processes are performed manually and are thus likely to result in manufacturing errors. Because a significant error would have a corresponding impact on the experimental analysis results, this study first verified the manufacturing error for each blade.
The dimension parameters, including the weight, length, and longitudinal center of gravity (COG) of each of the three blades, were measured before the modal tests were conducted. The weights of blade numbers 1, 2, and 3 were 19.74, 19.73, and 19.59 kg, respectively. The three blades were of equal length, that is, 3658 mm, and the locations of the longitudinal COGs of the three blades were 1156, 1163, and 1162 mm from the root, respectively.
| No. | Mode | Blade 1 | Blade 2 | Blade 3 |
|---|---|---|---|---|
| 1 | 1st Flap | 7.99 Hz | 8.00 Hz | 8.00 Hz |
| 2 | 1st Edge | 21.68 Hz | 21.51 Hz | 21.75 Hz |
| 3 | 2nd Flap | 31.78 Hz | 31.38 Hz | 31.75 Hz |
| 4 | 3rd Flap | 65.41 Hz | 62.79 Hz | 65.25 Hz |
| 5 | 1st Torsion | 81.83 Hz | 79.91 Hz | 79.29 Hz |
| 6 | 4th Flap | 90.13 Hz | 89.65 Hz | 88.59 Hz |
2.3.2 Damaged Blades
A series of modal tests were performed after artificial debonding damage was introduced to the undamaged blades. Blades 2 and 3 were made defective at the leading edge (LE500) and trailing edge (TE600), respectively.
Table 3 summarizes the rate of natural frequency change and the MAC value for each mode. In the leading edge debonding case, debonding can be observed to have a negligible effect on the change in natural frequency and the mode shape for the low-order modes up to the fourth mode. Even if debonding occurred at the leading edge by up to approximately 14% of the blade length (i.e., debonding size: 500 mm), the changes in the natural frequency for the low-order modes were less than 0.5%. The MAC values were also greater than 0.98, and no changes in the mode shape were observed. By contrast, in the case of the fifth-order or a higher order mode, changes in natural frequency and mode shape were detected.
| Mode no. | Rate of natural frequency change | MAC value | ||
|---|---|---|---|---|
| Normal vs. TE600 | Normal vs. LE500 | Normal vs. TE600 | Normal vs. LE500 | |
| 1 | 0.10% | 0.10% | 0.999 | 0.999 |
| 2 | 0.80% | 0.30% | 0.998 | 0.999 |
| 3 | 1.28% | 0.10% | 0.999 | 0.999 |
| 4 | 4.01% | 0.25% | 0.979 | 0.983 |
| 5 | 2.35% | 3.11% | 0.010 | 0.591 |
| 6 | 0.53% | 1.70% | 0.884 | 0.976 |
In the trailing edge debonding case, the modal parameters for the first mode remained constant even as the debonding size reached approximately 16% of the blade length (i.e., debonding size: 600 mm). However, unlike in the case of the leading edge, changes in the modal parameters due to debonding were detected starting from the second mode. The natural frequency for the third mode was reduced by more than 4% owing to debonding. Interestingly, no significant change in the mode shape occurred even at this juncture. Due to debonding damage, the natural frequency and mode shape changed significantly in the fourth mode. Notably, the LE500 and TE600 blades had very low MAC values in the fifth mode, indicating that debonding damage significantly changed the fifth mode shape, that is, the torsion mode.
3 FE Modeling
The FE model of the normal (undamaged) blade was created using MSC Patran software based on its design drawing and material properties. The FE model comprised 89,765 QUAD4 shell elements and 683 TRIA3 shell elements, and the mesh size was approximately 6 mm. The six degrees of freedom of the JIG fastening area were restrained to implement the same boundary conditions as the modal test. The material properties were defined as anisotropic using the MAT8 card, and the physical properties are shown in Table 4. The element properties were configured identically to the actual stacking information of the structure using the PCOMPG card.
| Material type | Direction(°) | Modulus (GPa) | Density (g/cm3) | Poisson's ratio |
1 Ply thickness (mm) |
||
|---|---|---|---|---|---|---|---|
| E 11 | E 22 | G 12 | |||||
| UD-1200G | 0 | 42 | 12 | 3.6 | 1.92 | 0.32 | 0.87 |
| 2AX-810G | +45/−45 | 28 | 28 | 3.6 | 1.90 | 0.10 | 0.61 |
| 3AX-1215G | 0/+45/−45 | 32 | 14 | 3.6 | 1.77 | 0.44 | 0.88 |
| BALSA | — | 2.791 | 2.791 | — | 0.148 | 0.30 | — |
- Skin–spar bonding areas: main spar top and bottom bonding areas and support spar top and bottom bonding areas.
- Skin–skin engagement: trailing edge, leading edge, tip, and root bonding areas.
Uniform adhesive application in actual manufacturing processes is challenging owing to the manual nature of the work. This is because various factors, such as worker and assembly processes, introduce inconsistencies. Moreover, the available data on adhesive weight is quite limited. At best, we can only estimate the total amount of adhesives used after blade assembly, and measuring its distribution is a challenging task. These issues make it practically impossible to accurately reflect the adhesive distribution in the FE model. Therefore, in this section, we assume that the adhesive weight is evenly distributed along the length of the bonding area when constructing the FE model. In other words, the adhesive weight assigned to each bonding area is calculated by multiplying the ratio of the length of each bonding area to the total length of all bonding areas by the total adhesive weight. The calculated weight is defined as a nonstructural mass (card name: NSML1) in the FE model. Based on the normal (undamaged) blade FE model, an abnormal (damaged) blade FE model was created by detaching the element nodes of the debonding area.
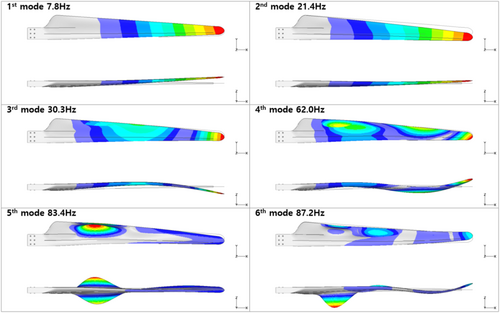
Modal analysis was performed using the generated FE model and MSC Nastran software. The modal analysis results, including the natural frequency and mode shape of each mode for the normal blade, are shown in Figure 3.
| Mode no. | Natural frequency error | Mode shape error | ||||
|---|---|---|---|---|---|---|
| Normal | TE600 | LE500 | Normal | TE600 | LE500 | |
| 1 | 2.61% | 2.82% | 2.88% | 0.21% | 0.26% | 0.32% |
| 2 | 1.51% | 3.16% | 3.93% | 0.60% | 0.59% | 0.59% |
| 3 | 4.50% | 4.05% | 4.84% | 0.53% | 0.42% | 0.67% |
| 4 | 5.29% | 1.79% | 5.51% | 8.14% | 32.40% | 9.22% |
| 5 | 1.96% | 4.05% | 4.94% | 55.21% | 99.58% | 78.95% |
| 6 | 3.20% | 2.91% | 1.92% | 52.30% | 88.99% | 69.11% |
| Average | 3.18% | 3.13% | 4.00% | 19.50% | 37.04% | 26.48% |
| 3.44% | 27.67% | |||||
Comparing the natural frequencies revealed that the second mode has an error larger than 3% for the abnormal blades, and the third mode has an error higher than 4% for both the normal and abnormal blades. Notably, the fifth mode of the LE500 blade is a representative mode that shows the characteristic change in natural frequency due to debonding damage in the modal tests; however, a large error of 4.94% is exhibited.
In terms of the mode shape, the errors from the first to third modes are all less than 1%, indicating that the FE analysis results reflect the experimental results well. However, the error becomes slightly larger from the fourth mode and increases up to 99.58% for the fifth and sixth modes. This indicates that the FE model does not accurately reflect the change in higher order mode shape due to debonding damage.
Consequently, although the composite blades fabricated for this study were controlled and manufactured to a level significantly higher than the generally accepted standard of 5% weight deviation in the manufacturing process, as shown in Table 1, the results of the modal analysis performed based on the design drawings and material properties show significant differences from the actual experimental results. This can be attributed to part weight error, adhesive material weight distribution error, simulation error, and their interaction. In particular, although each part produced for this study was manufactured and measured under strict process control and was relatively accurately reflected in the FE model, the distribution of the adhesive material, which is difficult to measure in practice, was defined relatively uniformly based on the length ratio of each area. However, despite these efforts, the FE model does not reflect the process variation appropriately; this is inferred to be the main source of the error. Therefore, modal updating via the proper modification of the main modeling parameters is essential to generating a high-fidelity FE model that accurately reflects the actual modal parameters.
However, leveraging modal updating to fulfill multiple results simultaneously via the simple modification of the modeling parameters is not straightforward. This is because modifying a modeling parameter to improve the accuracy of the modal analysis for a specific blade mode will affect all other results simultaneously. In addition, the errors of the different modes of each blade are also different, as shown in Table 5. Therefore, we need to perform modal updating based on a multiobjective optimization technique that can simultaneously improve the modal analysis accuracy for multiple fault cases and multiple modes.
4 Data Mining
In this section, modal analysis data considering the location and size of debonding damage and the manufacturing error were collected systematically via the DOE technique. Design space exploration was performed to numerically evaluate the effects of modeling parameters on the natural frequency and mode shape and to measure the performance of the FE model reported in Section 3. Subsequently, the main features were selected, and the data were processed into machine learning–based predictive models for effective optimization. For this purpose, CRISP-DM [30], one of the standard methodologies for data mining, was used in conjunction with the pSeven software.
4.1 DOE
Optimum Latin hypercube sampling (OLHS) [31] is the technique used for DOE; the features and targets used are listed in Table 6. Selecting an appropriate range of features is crucial to collecting effective data. In this study, we set the lower and upper bounds of each feature range to be sufficiently wide based on the actual measurements of the three blades described in Section 2. For each part weight, the minimum and maximum values of the actual measurements for the three blades and their difference, that is, maximum–minimum, were used to set the bounds. The lower and upper bounds of each part weight were defined as the minimum value minus the difference and the maximum value plus the difference, respectively. As explained in Section 3, the adhesive weight used in each adhesive area cannot be directly measured, and only estimates based on the ratio of the lengths of each adhesive area to the total adhesive length are available. Therefore, the lower and upper bounds for the adhesive weight in each contact area specified in Section 3 must be defined within a sufficiently wide and appropriate range. In this study, the average value of the adhesive weight of each bonding area was calculated by multiplying the ratio of the lengths of each bonding area to the total length of all bonding areas by the average value of the total adhesive weight. The adhesive weight of each bonding area was set to vary within the range of ±50% of the average value. A data cleaning process was applied for the data collected under these conditions to select only data yielding the COG position and weight of the blade model within 5% of the design specifications according to actual production quality standards. This process was used to collect 209 samples. The validity of this data collection method and sample size was first demonstrated in Section 4.2 when evaluating the performance of the FE model and in Section 4.4 when evaluating the prediction model built using the collected data.
| Type | Modeling parameter |
|---|---|
| Feature |
• Weight of parts (total: 3) : Skin, main spar, and support spar • Weight distribution of adhesive material (total: 8) : Skin–spar bonding
: Skin–skin bonding
|
| Target |
• Modal analysis results for normal blade, LE500, TE600 (total: 14) : Modal parameters
: Total weight and COG |
4.2 FE Model Performance Evaluation
As described in Section 4.1, the performance of the FE model was evaluated to check the natural frequency and MAC value range for the 209 samples collected. This is because the range of modal parameter changes over the range of modeling parameters considered in this study should be sufficiently larger than the range of modal parameter changes required during the modal updating process.
Figure 4 shows the range of natural frequencies for each mode for normal (undamaged) and abnormal (damaged) blades. Notably, the results for normal blades show the range of natural frequencies that can be caused by inevitable deviations in the COG position and weight and their interaction, even for blades manufactured under strict process control. The range of data collected includes all the natural frequencies for both normal and abnormal blades obtained from the modal tests. This indicates that a sufficient range of data was collected through DOE.
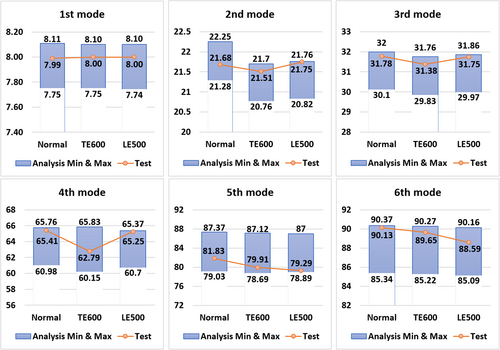
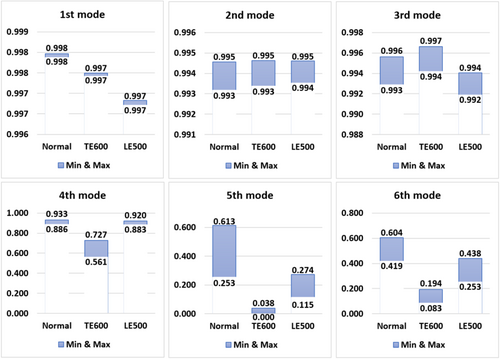
Figure 5 shows the range of mode shapes for each mode in normal and abnormal blades. Similar to Equation (1), the mode shape is quantitatively expressed as the MAC value between the experimental mode shape and that of each sample data. The ranges all had high values of 0.99 or more from the first to the third mode; however, the maximum MAC value decreased from the fourth mode and the range widened. In particular, the fifth mode of the normal blade had a large range of 0.36. Given the sensitivity of mode shapes of the higher order modes above the fourth mode to the manufacturing process, optimization that considers this sensitivity is essential for developing high-fidelity FE models.
4.3 Feature Selection
Iterative modeling parameter modification and modal analysis are required in the multiobjective optimization process; however, this is very time-consuming and tedious. Therefore, for efficient multiobjective optimization, this study utilizes a model that predicts natural frequency and mode shape changes due to modeling parameter changes.
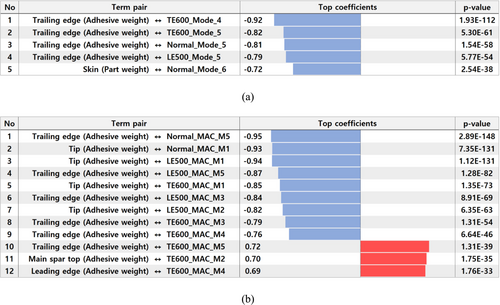
Typically, simplifying the relationship between features and targets by minimizing the number of features is crucial to improving the performance of the model. Therefore, we investigated the relationship between features and targets through data analysis and performed dimension reduction via feature selection. Forward stepwise selection was used to quickly select the main features. Correlation analysis was performed to select features with a high linear relationship as initial features. Figure 6 shows the results of correlation analysis for the features and targets, that is, natural frequency and mode shape. The weight of the skin and the adhesive material weight distributions of the trailing edge, tip, and main spar top bonding area were found to have strong linear relationships with the modal parameter.
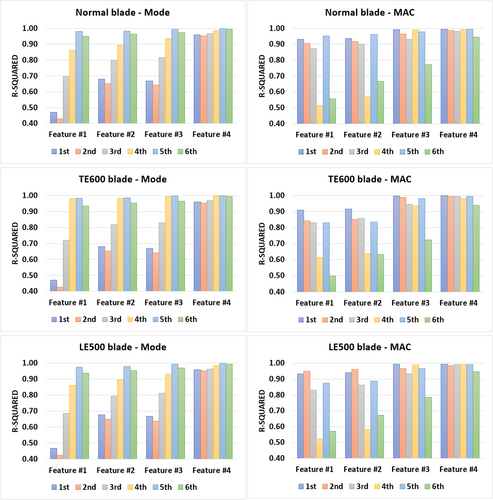
Surrogate models [32] were created and evaluated for various feature combinations. Sensitivity analysis was then performed based on these models. The validity of the key features selected in the correlation analysis was verified via this process, and additional key features were identified. Surrogate models were generated using the quadratic approximation technique, and the performance of the models was evaluated based on the coefficient of determination (R2 value). The results are shown in Figure 7. Feature #1 includes only the features selected through the correlation analysis. Features #2, #3, and #4 are configurations that incorporate additional key features to enhance the performance of the model. Consequently, the model using Feature #4 showed an R2 value of 0.9 or higher for all output values, demonstrating a higher accuracy than the other models (Features #1–#3). Therefore, we selected Feature #4, which incorporates adhesive material weights for the leading edge and main spar bottom bonding area into Feature #1.
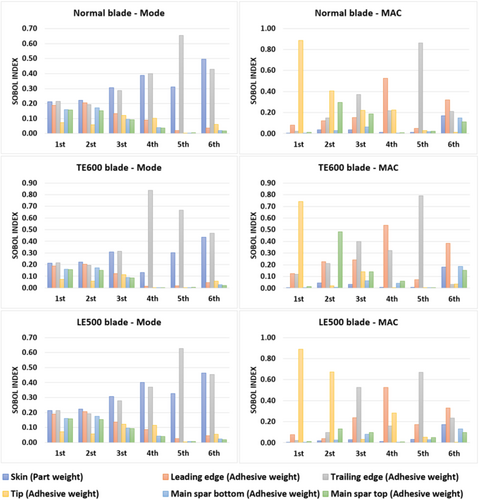
Sobol sensitivity analysis [33, 34] based on variance decomposition was introduced to deeply analyze the sensitivities of the natural frequency and mode shape to the main features. In the Sobol sensitivity analysis, the Sobol index ranges from 0 to 1, with a higher Sobol index for a particular input variable indicating that the input has a stronger influence on the output of the model. In this study, the input and output of the Sobol sensitivity analysis represent the features and modal parameters, respectively. Figure 8 summarizes the results of the Sobol sensitivity analysis for the natural frequency and mode shape. The skin and adhesive material weights of the trailing edge were confirmed to be key sensitive features to the natural frequencies across all modes and all blade models. The sensitivity of the adhesive material weights of the leading edge, bottom, and top to the natural frequencies could have also been highlighted in the low-order modes; however, the sensitivity of those features decreased in the higher order modes. The mode shape analysis revealed that the key sensitive features for each mode were remarkably distinguished. For example, the adhesive material weight of the tip was a noticeably sensitive feature in the first mode of all blade models; however, its contribution to the mode shape of higher order modes was negligible.
4.4 Predictive Model Generation
Machine learning–based predictive models were created to predict the modal parameters according to changes in the main features. Predictive models were created individually for normal, TE600, and LE500 blades. Furthermore, during the optimization process, a quality control model targeting the total weight and COG position was also created to apply the result boundary, ensuring a total weight and COG within 5% of the actual value.
The modal analysis data of 209 samples collected through the DOE were divided by a ratio of 8:2 for the training and validation data, respectively. Subsequently, the data from 167 samples were used as training data to create a predictive model, and those from 42 samples were used for predictive model validation. The predictive model was developed using a Gaussian process. Table 7 shows the performance of the generated predictive model. The R2 values were over 0.98 for all blades, confirming that the generated model accurately predicts the modal parameter according to feature changes and that the number of data samples collected by the DOE was sufficient to generate the predictive model with reasonable accuracy.
| Predictive model | Feature | Target | Average R2 value |
|---|---|---|---|
| Normal blade model | Major features (6EA) | First six natural frequencies and mode shapes (12EA) | 0.978 |
| TE600 blade model | 0.980 | ||
| LE500 blade model | 0.979 | ||
| Quality control model | Total weight and COG location (2EA) | 0.793 |
5 Multiobjective Optimization Procedure
- Step 1: Generate the modeling parameters selected as main features and the weights of the modes of interest.
- Step 2: Calculate the modal parameter of each blade model as the modeling parameter changes. For computational efficiency, the predictive model obtained in Section 4.4 is used without FE analysis.
- Step 3: Calculate the total cost function by considering the modal parameter results obtained by the predictive model and the weight of each mode.
- Step 4: Send the result of Step 3 to the gradient-based optimizer and update the feature values.
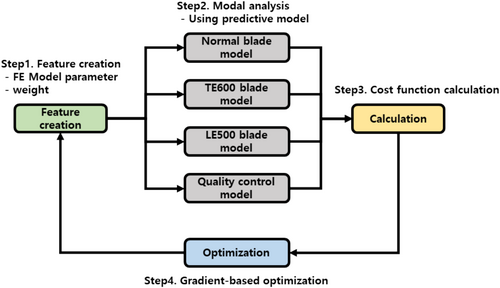
This process is repeated until the minimum value of the total cost function converges.
6 Modal Updating Results
This section verifies the performance of the modal updating method proposed in this study based on the results obtained via the multiobjective optimization process described earlier. Specifically, we describe the results when the same weight is applied to all modes in Section 6.1 and the results when the weight of the mode of interest is selected as a feature in Section 6.2. The effectiveness of the proposed weight adjustment method is also verified. Section 6.3 covers the optimization efficiency of the proposed optimization method using the predictive models.
6.1 Optimization Without Weight Adjustment
Both and in Equation (5) were set to the same values, and modal analysis was performed using the FE model obtained through multiobjective optimization. The modal parameter errors of Equations (3) and (4) were calculated against the experimental results and summarized in Table 8. By comparing these results with those in Table 5, which are the results before optimization, the average errors for the natural frequency and mode shape decreased from 3.44% to 2.38% and from 27.67% to 25.92%, respectively, demonstrating that the proposed multiobjective optimization method can achieve effective modal updating. However, the modal parameter error increased for some modes. In particular, the mode shape error of TE600 in the fourth mode increased from 32.4% before optimization to 36.1% after optimization, indicating that the mismatch of the corresponding mode shape increases significantly owing to optimization. Furthermore, the natural frequency errors for the fifth mode of the normal blade and LE500, which sufficiently represent the modal parameters change due to debonding damage in the modal tests, increased from 1.96% to 3.71% and from 4.94% to 6.64%, respectively. In addition, the mode shape errors for the fourth mode of the normal blade and LE500 increased from 8.1% to 12.8% and from 9.2% to 12.7%, respectively. Therefore, the weights for the mode of interest need to be properly adjusted to more accurately reflect changes in the modal parameters due to debonding damage.
| Mode no. | Natural frequency error | Mode shape error | ||||
|---|---|---|---|---|---|---|
| Normal | TE600 | LE500 | Normal | TE600 | LE500 | |
| 1 | 0.15% | 0.07% | 0.13% | 0.21% | 0.26% | 0.33% |
| 2 | 1.29% | 0.41% | 1.19% | 0.67% | 0.64% | 0.64% |
| 3 | 2.79% | 2.32% | 3.14% | 0.65% | 0.46% | 0.71% |
| 4 | 4.07% | 0.62% | 4.45% | 12.82% | 36.06% | 12.75% |
| 5 | 3.71% | 5.90% | 6.64% | 49.82% | 98.30% | 79.64% |
| 6 | 2.69% | 2.11% | 1.19% | 38.19% | 80.66% | 53.91% |
| Average | 2.45% | 1.91% | 2.79% | 17.06% | 36.06% | 24.66% |
| 2.38% | 25.93% | |||||
6.2 Optimization With Weight Adjustment
We selected the natural frequencies and mode shapes of the modes of interest as the main targets and applied different weights in Equation (5) to counteract the disadvantage of applying the same weight to all modes in the optimization process, in that the accuracies of the modal parameters are reduced for certain meaningful modes, as identified in Section 6.1. Moreover, we sought to perform modal updating to appropriately reflect variations in the modal parameters due to debonding damage.
First, appropriately selecting the main targets such that the weights are adjusted based on the modal test results in Section 2 is necessary. In this study, for the weight of the natural frequency, the fourth mode of the TE600 blade and the fifth mode of the LE500 blade, which experience significant changes depending on the defect, and the same modes of the normal blade, which are the reference, were selected as the main targets, that is, , , , and , respectively, in Equation (5). For the weight of mode shape, we utilized the results of the FE model performance evaluation in Section 4.2. Only modes with a maximum MAC value of ≥ 0.7, which have the potential to secure mode shape errors of less than 30%, were considered. In addition, the MAC values for the first three modes of all blade models were excluded from the main target because the maximum expected error is less than 1% with a MAC value of ≥ 0.99. Therefore, the fourth mode was finally selected as the main target for all blade models, that is, , , and in Equation (5).
Multiobjective optimization was performed, combining the seven selected weights as features, as described in Section 5. We found that the weight values considered as features converged to values approximately 4–65 times larger than the weights set to the same values. This is reasonable because the target mode is more important than other modes in the optimization process. Table 9 shows the modal parameter errors obtained from optimization with weight adjustment. By comparing the results with those obtained before optimization in Table 5, the overall average for natural frequency errors decreased from 3.44% to 3.06%. Furthermore, unlike the optimization results without weight adjustment in Table 8, the natural frequency errors for each mode of all blade models decreased simultaneously, which is an important result obtained by weight adjustment.
| Mode no. | Natural frequency error | Mode shape error | ||||
|---|---|---|---|---|---|---|
| Normal | TE600 | LE500 | Normal | TE600 | LE500 | |
| 1 | 2.03% | 2.24% | 2.30% | 0.21% | 0.25% | 0.32% |
| 2 | 1.02% | 2.68% | 3.46% | 0.58% | 0.57% | 0.56% |
| 3 | 3.96% | 3.50% | 4.31% | 0.51% | 0.44% | 0.68% |
| 4 | 4.97% | 1.67% | 5.16% | 6.73% | 29.85% | 8.00% |
| 5 | 1.74% | 3.83% | 4.74% | 55.34% | 99.60% | 78.83% |
| 6 | 3.03% | 2.69% | 1.75% | 50.07% | 87.74% | 67.60% |
| Average | 2.79% | 2.77% | 3.62% | 18.91% | 36.41% | 26.00% |
| 3.06% | 27.10% | |||||
Regarding the mode shape error, the overall average decreased after optimization, as did the natural frequency error. Moreover, as expected, the error remained very low (less than 1%) for the first three modes, and the error decreased for the fourth mode, which is sensitive to feature changes and has a somewhat higher error. For the fourth mode of the TE600 blade, weight adjustment reduced the error to less than 30%, whereas the mode shape error increased from 32.4% to 36.1% compared to before optimization when the same weight was considered.
The effect of weight adjustment can be seen more clearly by comparing the average errors for the main targets, as shown in Table 10. In the case of optimization without weight adjustment, the overall average error decreased, as described earlier; however, the average errors for the main targets increased. This led to increased errors for the main targets and degraded the performance of the FE model. Conversely, for optimization with weight adjustment, the average errors for the main targets decreased along with the overall average error. Therefore, weight adjustment for the main targets is essential for developing a high-fidelity FE model based on multiobjective optimization.
| Natural frequency error | Mode shape error | |
|---|---|---|
| Before optimization | 3.50% | 16.57% |
| Optimization w/o weight adjustment | 3.76% | 20.53% |
| Optimization w/ weight adjustment | 3.28% | 14.87% |
6.3 Optimization Efficiency Analysis
In this study, a total of 196 steps were used for optimization. The total time required to perform 588 calculations (196 steps × 3 blade models) using the predictive models was 19 s. Conversely, a single analysis using MSC Nastran software takes an average of 170 s to complete. Assuming that modal analysis is performed for the three blade models simultaneously, the total time required would be 33,320 s. This demonstrates that by incorporating the predictive model into the optimization process, the calculation cost is 1753 times more efficient than using MSC Nastran software directly.
7 Summary and Conclusion
This study proposed a method for developing a high-fidelity FE model for wind turbine composite blades. Three blades of a 10-kW-class wind turbine were manufactured to analyze manufacturing process deviations. In addition, artificial debonding damage was generated on the trailing and leading edges. Modal parameters of undamaged and damaged blades, such as the natural frequencies and mode shapes of the first to sixth modes were measured using actual modal tests to analyze the effects of debonding damage. The natural frequencies and mode shapes of the low-order modes did not change even when the size of the debonding damage reached approximately 15% of the total blade; however, the modal parameters changed significantly in the higher order modes above the fourth mode depending on the nature of the defect. Moreover, although the affected modes differed somewhat depending on the location of the defect, the mode shape of the blade torsion mode changed significantly when debonding damage occurred at the trailing and leading edges.
The initial FE model was created using blade structural drawings and material properties. Modal analysis was also performed. Subsequently, the results were compared and analyzed against the experimental results. The natural frequency had an average error of 3.44%, whereas the mode shape error had an average error of 27.67%. Notably, the mode shape errors of the fifth and sixth modes were very large, and the defective blade had a larger error than that of the normal blade. This is because the mode shapes of the higher order modes were significantly altered by debonding damage, which was not accurately reflected in the initial FE model.
This study is novel because it can simultaneously improve the accuracy of the modal analysis for both undamaged and damaged blade models based on multiobjective optimization. It also accounts for inevitable manufacturing errors in FE modeling. The optimization process requires iterative FE model modification and modal analysis. Machine learning–based predictive models that predict modal parameters according to modeling parameter changes were developed and used for time and cost-effective optimization. Consequently, the time required for modal analysis was significantly reduced.
In addition, this paper proposed a weight adjustment technique, which involves constructing a cost function based on modal parameter errors for multiobjective optimization. The analysis accuracy of each mode in the initial FE model was different, and the modes that were sensitive to actual defects were different. Therefore, the analysis accuracy of the target mode improved when the weight values of the modes of interest were altogether considered as features in the optimization process.
Using the proposed method, we obtained a high-fidelity FE model that can well reflect the modal parameters of normal and abnormal blades. Because accurately predicting the dynamic characteristics of blades by various defect locations and sizes is crucial for blade damage detection, the proposed method is significant for damage detection research. In addition, the proposed method of generating predictive models using DOE and machine learning techniques will be effective in research areas that require iterative FE analysis according to changes in modeling parameters.
Author Contributions
Sungmok Hwang: conceptualization, methodology, validation, formal analysis, investigation, resources, data curation, writing – original draft, visualization, supervision, project administration, funding acquisition. Hyunmok Kim: conceptualization, methodology, software programming, validation, data curation, writing – original draft visualization. Seungjin Kwang: investigation, resources. Cheol Yoo: investigation, resources.
Acknowledgments
This work was supported by the research and development program of the Korea Institute of Energy Research (C5-2427).
Open Research
Data Availability Statement
The data that support the findings of this study are available from the corresponding author upon reasonable request.


