Accounting for the speed shear in wind turbine power performance measurement
ABSTRACT
The current IEC standard for wind turbine power performance measurement only requires measurement of the wind speed at hub height assuming this wind speed to be representative for the whole rotor swept area. However, the power output of a wind turbine depends on the kinetic energy flux, which itself depends on the wind speed profile, especially for large turbines. Therefore, it is important to characterize the wind profile in front of the turbine, and this should be preferably achieved by measuring the wind speed over the vertical range between lower and higher rotor tips.
In this paper, we describe an experiment in which wind speed profiles were measured in front of a multimegawatt turbine using a ground–based pulsed lidar. Ignoring the vertical shear was shown to overestimate the kinetic energy flux of these profiles, in particular for those deviating significantly from a power law profile. As a consequence, the power curve obtained for these deviant profiles was different from that obtained for the ‘near power law’ profiles. An equivalent wind speed based on the kinetic energy derived from the measured wind speed profile was then used to plot the performance curves. The curves obtained for the two kinds of profiles were very similar, corresponding to a significant reduction of the scatter for an undivided data set. This new method for power curve measurement results in a power curve less sensitive to shear. It is therefore expected to eventually reduce the power curve measurement uncertainty and improve the annual energy production estimation. Copyright © 2011 John Wiley & Sons, Ltd.
1 INTRODUCTION
Power performance measurement is central to the wind industry since it forms the basis for the power production warranty of the wind turbine. For that reason, it should be independent of the wind characteristics. A wind turbine power performance measurement consists of measuring simultaneous wind speed in front of the turbine and power output of the turbine. Of these parameters, 10 min averages are used to generate the power curve (power as a function of the wind speed) and the power coefficient (Cp, the ratio between the turbine power output and the kinetic energy flux) curve.
The IEC 61400–12–1 standard for wind turbine power performance measurement 1 only requires measurements of the wind speed at hub height and the air density (derived from temperature and pressure measurements) to characterize the wind field surrounding the wind turbine, in flat terrain. However, it has been shown that other wind characteristics such as the variation of the horizontal wind speed with height above the ground (speed shear), the variation of wind direction with height (veer) and the fast variation of wind speed around the 10 min mean wind speed (turbulence) can also influence the power performance of a large turbine. 2, 3 Therefore, in practice, the power curve measured according to the current standard is specific both to the location and the meteorological conditions during the test. In this paper, we focus on the effect of the wind speed shear. Effects of turbulence and wind veer are superimposing to the shear effect and are not considered here. A few studies showed that the power production decreased with increasing shear (within a certain range of shear exponents). 4, 5 It was also shown in Antoniou et al. 4 and VanLuvanee et al. 5 that wind speed profiles with higher wind speed gradient above hub height than below hub height (such as those created by low level jets) result in an increase of the power production. This suggests that profiles deviating from a power law form may result in a larger power deviation than those more closely matching a power law.
The assumption that the wind speed at hub height is representative for the whole area leads to inconsistencies in power curve measurements for large wind turbine, as shown in Elliott and Cadogan 6 and Sumner and Mason. 7 These authors found a power curve different from the one obtained with the wind speed at hub height when they used the profile averaged speed. On the basis of this idea, it was suggested in Wagner et al. 8 to use an equivalent wind speed taking the wind shear into account in the power curve. This method was tested with simulations using a blade element model and was shown to reduce the scatter in the power curve.
A major obstacle to the experimental application of this method is that it requires a measurement of the wind speed at several heights covering the vertical range between lower and higher rotor tips, i.e. up to at least 100 m for a modern multimegawatt turbine. If a meteorological mast high enough is not available, a ground–based remote sensing instrument appears to be a possible alternative. An application of the equivalent wind speed method to sodar measurements was presented in VanLuvanee et al. 5 The power curve obtained with low level jet profiles was found to be consistent with the average power curve, but the scatter did not decrease. From a preliminary measurement campaign described in Wagner et al., 9 there is evidence that suggests that lidar measurements are more suitable than sodar measurements for applying the equivalent speed method, since the sodar measurements were much noisier than lidar measurements. Indeed, lidar systems have improved considerably in the past 4 years, the best available systems measuring to an accuracy close to that of a cup anemometer (less than 1% difference and a coefficient of determination exceeding 0.995 on average 10).
In this paper, we examine the results of applying the equivalent wind speed method experimentally. Since no suitable meteorological mast was available, we have used a ground–based pulsed lidar. Wind speed profiles were measured with this lidar placed in front of a large wind turbine. First, the measured profiles were divided into two groups according to their degree of conformity to a power law profile, and the difference in the power curves obtained for these two classes of profiles was observed. Second, we recalculated the power curves using the equivalent wind speed method and investigated the change in power and Cp curves.
2 DESCRIPTION OF THE MEASUREMENTS
The measurements took place at Risø DTU's test station for large wind turbines, on the west coast of Denmark. The terrain is flat, surrounded by farmland and is 1.7 km from the coast. 11 This facility comprises a line of five multimegawatt wind turbines aligned almost parallel to the coast as shown in Figure 1. In front of each of them, at a distance of about 2.5 rotor diameters, stands a meteorological mast with a top mounted cup anemometer at hub height to measure the power performance in accordance with the IEC 61400-12-1 standard. A wind speed profiler lidar was installed at the foot of the mast (5 m from the mast) in front of one of the turbines.
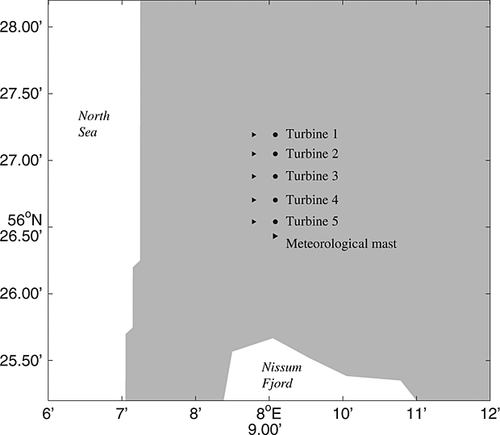
The main wind direction is from the west, so we considered the wind sector 225° −315° ( ± 45° around the west direction). The measurements were taken during the early spring, the season during which unusual shears are often observed at this location. Moreover, it is important for a power curve measurement that the turbine settings remain constant during the whole measurement period. As the turbine considered here is a test turbine, the settings are often modified by the manufacturer. For this reason, the measurement period has been limited to about a month (from 25 February 2009 to 21 March 2009), as we are sure that the turbine kept the same settings during this period.
The wind turbine considered in this experiment is a variable speed, pitch–regulated multimegawatt turbine. For reasons of confidentiality, we are unable to give more information concerning the wind turbine. All the power performance data were normalized: for the power using the rated power of the wind turbine Prated, for the wind speed using the rated speed urated and for the power coefficient using the maximum value of Cp observed in the standard power performance measurement.
The lidar system used in this experiment was a Windcube WLS–07 from Leosphere. It is a pulsed system operating at infrared wavelength. By using the range–gating principle, multiple heights can be scanned simultaneously. The vertical probe length is constant with height and about 25 m. 12 In that respect, the lidar measures differently than a cup anemometer as it measures over a volume, whereas the cup anemometer measures at a point. This may bias the lidar measurements in case of large shear. However, no significant bias has been observed in Høvsøre.
The data were first selected according to the turbine status. The initial data set was reduced because the lidar stopped twice for a period of a few days. To select the best–quality data from the lidar, the periods with rain were excluded. Moreover, only the 10 min periods during which horizontal speeds were available at all heights, i.e. only the complete profiles, were taken into account.
Figure 2 shows the regression of the wind speed at hub height simultaneously measured by the lidar and by the cup anemometer. After the filtering described previously, two outliers remained. They occurred immediately after a rainy period and are probably due to an error or a delay of the rain sensor. These outliers were removed from the data set manually. Figure 2 shows the final data set, 87% of the exploitable data. This data set consists of 907 data; therefore, it does not meet the amount of 180 h of measurements required by the IEC standard for power performance measurement, 1 but the requirement of at least three data per wind speed bin has been met for the wind speeds below rated speed.
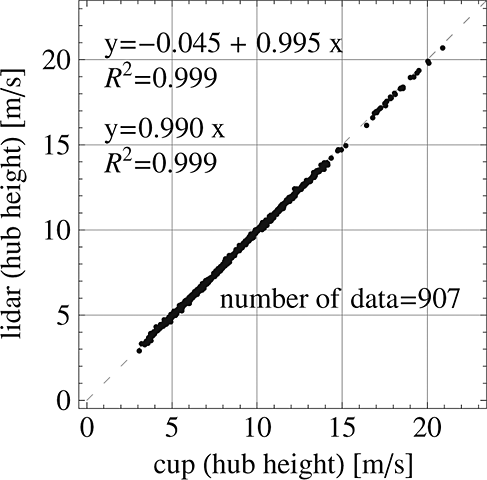
According to Figure 2, the lidar showed a very good agreement to the cup anemometer (regression slope very close to unity and high R2) with a slight underestimation of the wind speed on average. The power curve obtained with the lidar, using only the lidar's hub–height measurements, is very similar to the one obtained with the cup anemometer. However, the main interest here is the scatter around the mean power (or Cp) curve and not the mean curve itself. By using a quantification method first presented later in the paper, the scatter in the power curve obtained with the wind speed measured by the lidar at hub height ( on average) is comparable with the scatter obtained with the cup anemometer (
 on average). For this reason, in the rest of the paper, we show only the power and Cp curves obtained with the lidar measurements (either at hub height or with the equivalent wind speed).
3 EFFECT OF IGNORING THE WIND SPEED SHEAR
3.1 Evaluation of the wind speed profile
 (1)
(1) (2)
(2)3.2 Profile classification
 (3)
(3)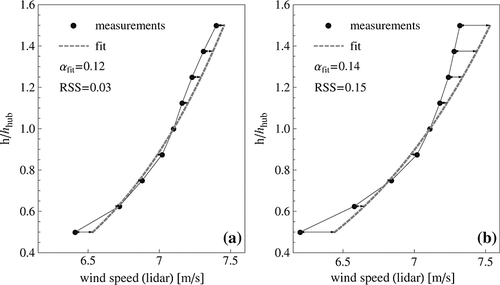
- Group 1: RSS ≤ 0.1. The profiles from this group have a shape close to a power law profile and are referred to as the ‘power law profiles’ in the rest of the paper.
- Group 2: RSS > 0.1. The profiles from this group have a shape that cannot be well represented by a power law profile and are referred to as the ‘non–power law profiles’.
According to this classification, profile (a) in Figure 3 would be in group 1, and profile (b) in group 2. The value of 0.1 was chosen here as threshold for the RSS because it gave two groups of data showing two trends while being statistically comparable (as they count similar numbers of data: 511 in group 1 and 396 in group 2). It is recognized that this threshold is somewhat arbitrary; it depends on the absolute value of the mean wind speed, and it should subsequently be ‘fine–tuned’ using a large number of data sets.
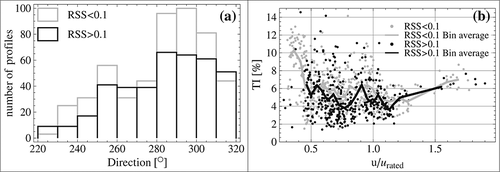
Figure 4(a) presents the distribution of the two groups of profiles and shows that there is no significant dependance of the classification on the wind direction. According to Figure 4(b), the distributions of turbulence intensity for each group of data are pretty similar. They differ by 1% on average, which is a rather small difference when looking at influence on the power curve.
3.3 Conventional power curves for the two groups of profiles
 (4)
(4)
 (5)
(5)4 A BETTER APPROXIMATION OF THE KINETIC ENERGY FLUX
4.1 For theoretical power law profiles
 (6)
(6)For a given turbine (fixed hub height and rotor diameter), the ratio  is then independent of the wind speed but varies with the shear exponent α. The variation of this ratio as a function of the shear exponent is shown by a line with diamonds in Figure 7. According to this analytical analysis, the ratio between the two kinetic energy approximations is below 1 for a shear exponent between 0 and 0.3 with a minimum around 0.2. However, the ratio remains quite high as it is 0.988 for α = 0.2. For negative shear exponents and shear exponents higher than 0.3, the ratio is larger than 1. This shows that an error of up to 1% is made in the evaluation of the energy available in the wind for a power law profile with a usual shear exponent (between 0 and 0.4).
4.2 For measured profiles
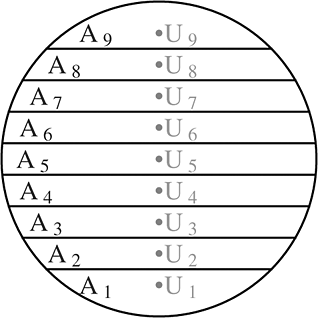
 (7)
(7)
The ratio  is displayed in Figure 7. The profiles from group 1 (gray points) follow rather well the analytical results showing a moderate error due to the constant profile assumption. The non–power law profiles (group 2), on the other hand, do not follow the analytical curve at all and demonstrate much larger difference between the two ways of evaluating the kinetic energy flux. The approximation of a constant wind speed over the whole rotor swept area, made in 5, overestimates the kinetic energy flux for most of the data of group 2 and underestimates it for a few of them.
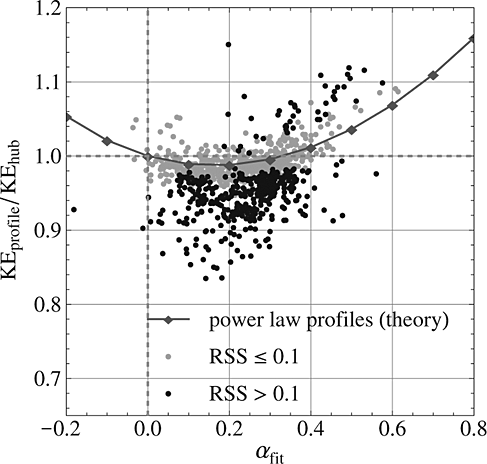
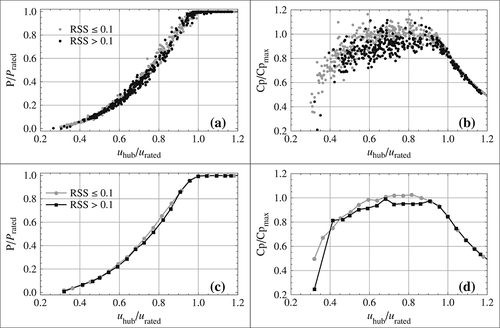
Two wind speed profiles can have the same wind speed at hub height but different kinetic energy. In a standard power curve, such profiles would have the same abscissa (hub height wind speed), whereas they would almost certainly result in different power outputs. This is partially why the two groups of profiles give two different power curves. The kinetic energy flux overestimation has even more impact on Cp, which explains why Cp for the group 2 profiles is generally lower than for group 1.
Another contribution to the differences between the power curves can be the real influence of the wind speed shear on the power output due to the aerodynamics effect. Indeed, two profiles resulting in the same kinetic energy may give different turbine power output because for some wind speed shear conditions (e.g. a power law profile with a large shear exponent), the turbine is not able to extract as much energy as in other shear conditions (e.g. a constant profile).
5 EQUIVALENT WIND SPEED
5.1 Definition
 (8)
(8) (9)
(9)5.2 Application to the classified profiles
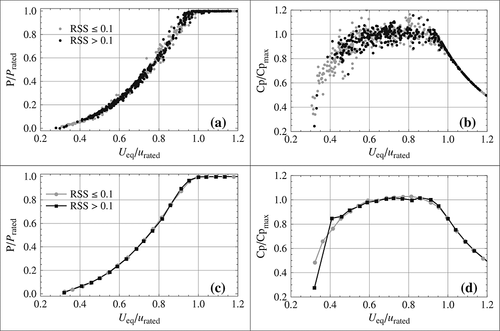
Figure 8 shows plots comparable with the plots in Figure 5. In Figure 8, the power and Cp are plotted as a function of the equivalent wind speed 8 (instead of the wind speed at hub height in Figure 5), and Cp is calculated according to 9 (instead of 4 in Figure 5). In Figure 8, profiles from both groups follow the same trend. The mean power and Cp curves obtained with each group of points overlap each other. This shows that the difference in power curves between the two groups shown in Figure 5 was mainly due to the error in kinetic energy flux.
5.3 Application to the unified data set
In a conventional power performance measurement, the data would not be grouped according to the profile shapes, but all the data would be considered together indifferently. The results obtained for the unified data set are shown in Figure 9.
The power curve obtained with the equivalent wind speed is shifted to the left (towards lower wind speeds) compared with the power curve obtained with measurements at hub height (see Figure 9(a)). However, this does not mean that the turbine has produced more power since these two power curves were obtained with the same data set. The equivalent wind speed method modifies the wind speed used in the abscissa in the power curve, but the wind turbine power output remains unchanged. This shift in the mean power curve actually shows that for this data set, the equivalent wind speed was on average smaller than the wind speed at hub height. Consequently, the mean Cp curve was shifted upwards (see Figure 9(c)). Note that at another site with larger wind shear above hub height than below, such as in Antoniou et al. 4 and VanLuvanee et al., 5 the equivalent wind speed may be larger than the wind speed at hub height so that the power curve would be shifted to the right.
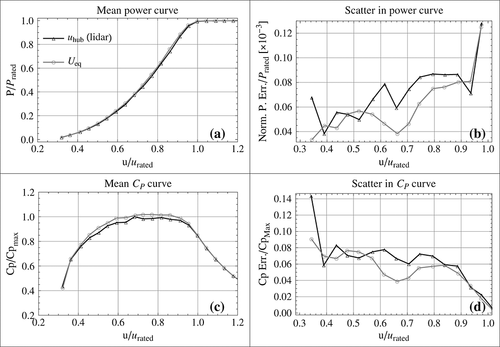
However, the main result of using an equivalent wind speed accounting for the shear concerns the scatter in the power curve and Cp curve. Indeed, ignoring the wind speed shear in the kinetic energy flux estimation appears as a large scatter in the power and Cp curves. The use of the equivalent wind speed results in the reduction of this scatter. This can be seen directly by comparing Figure 8(a) (respectively (b)) to Figure 5(a) (respectively (b)).
 (10)
(10) (11)
(11) . Table 1 shows the mean value of this normalized error for the power curve obtained with the cup anemometer, the lidar measurements at hub height and the equivalent speed (derived from the lidar profile measurements).
| Wind speed | Cup anemometer | Lidar | Lidar with |
|---|---|---|---|
| definition | at hub height | at hub height | equivalent speed |
| Scatter | |||
 |
76 | 72 | 61 |
 (12)
(12) (13)
(13) is the power standard deviation and Ni the number of points in the i–th bin. Contrary to the standard uncertainty, the quantity defined by 10 is independent of the segment slope and therefore enables us to estimate the reduction of scatter in a more subtle way. Indeed, the reduction of the scatter around the mean curve means that the power curve is less sensitive to shear and therefore more repeatable.
6 DISCUSSION
6.1 The equivalent wind speed method
We showed that the assumption of a constant wind speed over the rotor swept area leads to a misinterpretation of the power curve and the Cp. A better approximation of the kinetic energy flux was obtained by accounting for the vertical wind shear with measurements of wind speed at nine heights covering the vertical range between lower and higher rotor tips. The comparison of these two kinetic energy flux approximations showed that for most of the measurements presented here, the constant profile assumption overestimated the kinetic energy flux, especially for the non–power law profiles. Indeed, for those profiles, the underestimation was on average up to 5%, whereas it was only of 1% for the power law profiles. In the standard performance measurement, this appeared as if less power was produced from non–power law profiles, and the Cp was globally lower for power law profiles.
These observations were only possible because the wind speed profiles were measured at several heights between lower tip height and higher tip height and were not extrapolated. Indeed, if the profiles from group 2 had been extrapolated assuming a power law profile for example, the kinetic energy would probably have been overestimated, leading once more to an erroneous value for Cp.
To reduce the error due to an incorrect evaluation of the kinetic energy flux in the performance measurement, we defined an equivalent wind speed, on the basis of the new approximation of the kinetic energy flux. With the standard method, where the hub–height wind speed is used as the abscissa, the two groups of profiles gave significantly different power and Cp curves. By using the equivalent wind speed instead, very similar power and Cp curves were obtained. Therefore, a part of the differences in performance curves obtained with the wind speed at hub height was not due to a poor performance of the turbine but to an error in the evaluation of the kinetic energy flux.
Thus, the use of this equivalent wind speed reduced the scatter because of the fact that the effect of the wind speed profile on the kinetic energy flux was not taken into account in the standard power curve. Further analysis with the same data set (not shown in this paper but fully described in Wagner 13) showed that a considerable decrease of the scatter in the power curve could be obtained with measurements at fewer heights (but at least three) with the proviso that one measurement was taken above hub height. According to the current IEC standard, this scatter would have been interpreted as a power uncertainty of category A. In that sense, the use of such an equivalent wind speed reduces the uncertainty due to the wind shear. On the other hand, a complete uncertainty calculation would require the uncertainty in wind speed measurements achieved by the particular instrumentation used.
Moreover, the equivalent wind speed definition based on the kinetic energy flux gives a more meaningful Cp than the use of the wind speed at hub height and in that sense enables us to measure the true efficiency of the turbine. Indeed by using a better approximation of the kinetic energy flux, the Cp then shows how much energy the turbine actually extracts from the wind. Only by using the equivalent wind speed it is possible to see if the turbine efficiency actually depends on the shear situation, i.e. if the turbine extracts less power in some shear situations than in others whereas the energy available in the wind is the same.
It should be noted that this equivalent wind speed definition allows us to correct for the wind speed shear in the kinetic energy flux but does not correct for the actual effect of the wind speed shear on the aerodynamics of the turbine. Indeed, two different wind speed profiles can have the same kinetic energy flux but present differences in the aerodynamic performance of the turbine, resulting in different power outputs. Therefore, a power curve calculated with this equivalent wind speed is still shear dependent but much less than the power curve obtained with the wind speed at hub height. Differences in power curves obtained with the equivalent wind speed (for the same type of turbine operating at two different sites for example) reveal differences in the turbines performance and not differences in the wind energy resource related to shear. For really comparable power curves to be obtained, corrections for other wind characteristics, such as wind direction shear and turbulence, need to be accounted for too.
Finally, the use of an equivalent wind speed accounting for the shear in the power performance measurement can be a little confusing as the resulting power curve is not directly comparable with the standard power curve. Indeed, these two power curves have two different quantities in abscissa. For this reason, the most logical way of estimating the annual energy production with the equivalent wind speed is to combine it with the distribution of the equivalent wind speed. This means that the wind speed profile should be measured not only during the power curve measurement but also during the wind resource assessment.
6.2 Use of remote sensing
Another important conclusion we can draw from this experiment is that the pulsed lidar has successfully measured a power curve using the equivalent speed method. As it was noted in the second section, the scatter in the power curve obtained with the lidar measurements at hub height was approximately equal to the scatter obtained with the cup anemometer measurements. Consequently, the scatter obtained with the lidar with the equivalent wind speed was lower than for the conventional cup anemometer method (see Table 1).
Generally, as the measuring noise of a remote sensing instrument increases, the scatter in the power curve would also increase, as we suspect it to be the case for the sodar measurements in VanLuvanee. 5 If the increased uncertainty of the speed measurement is larger than the reduction in uncertainty because of the added wind shear information, we would get no net improvement. Therefore, the equivalent wind speed method can be applied with remote sensing measurements; however, this requires an instrument with both high absolute accuracy and low noise.
7 CONCLUSIONS
The power produced by a turbine largely depends on the energy provided by the wind. But the wind speed profile affects the kinetic energy flux. It is therefore important to know the wind speed profile and not only the wind speed at hub height. A pulsed lidar was used to measure the wind speed profile in front of the turbine rotor. In this investigation, the effect of the wind shear was confirmed as two different power curves were obtained for two different types of speed profiles. We showed that the main explanation for this difference was that the use of the wind speed at hub height (or ignoring the wind speed shear) could lead to an erroneous evaluation of the kinetic energy flux. This can result in a misinterpretation of the power performance of the turbine. The measured wind speed profiles were used to calculate a better approximation of the kinetic energy flux and to derive an equivalent wind speed from it. The use of such an equivalent wind speed resulted in the reduction of the scatter in the power curve. This investigation demonstrated a successful application of the equivalent wind speed method with lidar measurements and therefore showed that the use of a pulsed lidar can actually improve the power performance measurement. More importantly, by reducing the scatter in the power curve, we obtain a power curve less sensitive to shear, therefore less dependent on the site. This should result in a decrease of the power curve measurement uncertainty. Moreover, such a power curve should be more repeatable, which is expected to give a better annual energy production estimation.
ACKNOWLEDGEMENTS
The authors would like to thank I. Antoniou of Siemens Wind Power for the permission to use the lidar and power data. This work was performed as a task under WP6 of the EU FP6 Upwind project, WP2 of the EU FP7 SafeWind project and the IMPER project funded by the Danish Energy Agency. R. Wagner is supported by the Marie Curie ModObs Network MRTN-CT-2006-01369.


 (
(
