Migratory Behavior and Physiological Development as Potential Determinants of Life History Diversity in Fall Chinook Salmon in the Clearwater River
Abstract
We studied the influence of behavior, water velocity, and physiological development on the downstream movement of subyearling fall-run Chinook Salmon Oncorhynchus tshawytscha in both free-flowing and impounded reaches of the Clearwater and Snake rivers as potential mechanisms that might explain life history diversity in this stock. Movement rates and the percentage of radio-tagged fish that moved faster than the average current velocity were higher in the free-flowing Clearwater River than in impounded reaches. This supports the notion that water velocity is a primary determinant of downstream movement regardless of a fish's physiological development. In contrast, movement rates slowed and detections became fewer in impounded reaches, where water velocities were much lower. The percentage of fish that moved faster than the average current velocity continued to decline and reached zero in the lowermost reach of Lower Granite Reservoir, suggesting that the behavioral disposition to move downstream was low. These findings contrast with those of a similar, previous study of Snake River subyearlings despite similarity in hydrodynamic conditions between the two studies. Physiological differences between Snake and Clearwater River migrants shed light on this disparity. Subyearlings from the Clearwater River were parr-like in their development and never showed the increase in gill Na+/K+-ATPase activity displayed by smolts from the Snake River. Results from this study provide evidence that behavioral and life history differences between Snake and Clearwater River subyearlings may have a physiological basis that is modified by environmental conditions.
Life history diversity in anadromous salmonids is defined in part by the timing of transitions between different habitats and life stages (Satterthwaite et al. 2012; Kendall et al. 2015; Bourret et al. 2016). The timing of seaward migration by juvenile salmonids dictates age at ocean entry (e.g., subyearling or yearling), which carries with it fitness consequences (Thorpe et al. 1998; Connor et al. 2005). Migration timing is a function of the complex interaction between environmental stimuli (Greenstreet 1992; Berggren and Filardo 1993; Muir et al. 1994), growth opportunity (Metcalfe et al. 1988; Benjamin et al. 2013), and physiological development (Folmar and Dickhoff 1980; Zaugg 1981), which influence downstream movement (Fängstam 1993; Muir et al. 1994; Peake and McKinley 1998). Environmental factors, such as water velocity and turbulence, can be used by juvenile salmonids to increase migration efficiency and minimize energetic costs (Coutant 2001; Enders et al. 2005) as long as critical thresholds for these environmental factors are maintained (Coutant and Whitney 2006). Successful migration includes both behavioral and environmental components that result in fish reaching the ocean at a physiologically appropriate time to transition to seawater.
Water temperature and growth rate are main drivers of life history tactics in anadromous salmonids (Metcalfe et al. 1988; Taylor 1990). Connor et al. (2002) analyzed these variables for subyearling fall-run Chinook Salmon Oncorhynchus tshawytscha (hereafter, “subyearlings”) from the Snake River basin and showed that fish produced in the cooler Clearwater River had lower parr growth rates and a greater propensity to become yearlings than faster-growing fish produced in the warmer Snake River. However, Connor et al. (2002) did not identify underlying mechanisms for these results or analyze other environmental factors that could have influenced fish behavior. The Snake River basin population is primarily distributed in the lower Snake River and lower Clearwater River watersheds, which have differing environmental conditions that could influence life history expression through developmental and physiological modification of migratory behavior. The rivers within the lower Snake River watershed (i.e., upstream of Asotin, Washington; Figure 1) are, for the most part, warmer during spawning and rearing, and the fish emerge earliest there, whereas the rivers within the Clearwater River watershed are cooler during spawning and rearing, thus causing a lag in the timing of fry emergence (Connor et al. 2002). Because of the difference in fry emergence timing, juveniles from the two watersheds do not develop under identical photoperiod patterns, which can affect physiological development and life history (e.g., Beckman et al. 2007). Moreover, the water temperature regime in the lower Clearwater River and Lower Granite Reservoir is regulated from July through the second week in September by the release of cold, hypolimnetic water from Dworshak Reservoir (Figure 1) at volumes that exceed naturally declining flows in the watershed. This flow augmentation (also referred to as temperature control) is implemented to improve survival of subyearlings that would otherwise be exposed to low velocities and high temperatures in the reservoir (Connor et al. 1998; Connor et al. 2003a). This water release immediately reduces temperatures and disrupts the typical warming pattern of the lower Clearwater River to the point that historical summer maximum temperatures that would trigger downstream movement and smoltification are not observed (DART 2016). Consequently, subyearlings remaining in the lower Clearwater River during this time rear under both a decreasing photoperiod and atypically low temperatures in contrast to the conditions experienced by juveniles along the lower Snake River.
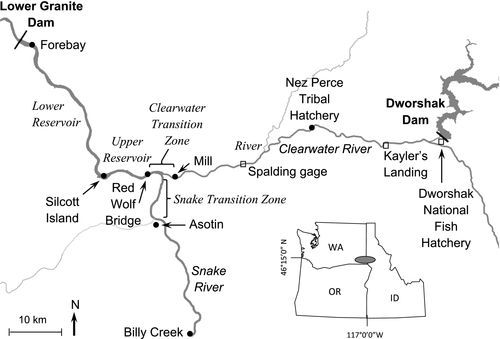
Given the economic cost of flow augmentation, Connor et al. (2002) underscored the need for fishery managers to understand how flow augmentation affects the downstream movement rate of subyearlings. However, in modified systems like the lower portion of the Snake River basin (Figure 1), where fish migrate through both riverine reaches and reservoirs, behavioral and environmental components (e.g., flow) exert simultaneous influences on downstream movement that are difficult to isolate individually. Tiffan et al. (2009b) attempted to disentangle the effects of water velocity and swimming behavior on the subyearling downstream movement rate. They radio-tagged subyearling smolts and tracked them through riverine and impounded reaches. The fish moved downstream through a naturally turbulent riverine stretch of the lower Snake River at an average rate that was similar to the mean cross-sectional water velocity. Upon entering the transition zone of Lower Granite Reservoir (Figure 1), where water velocities and turbulence began to diminish due to impoundment, the mean downstream movement rate of subyearlings slowed substantially to less than the mean cross-sectional water velocity. However, the average downstream movement rate increased as the fish continued to move through the reservoir and eventually exceeded the mean cross-sectional water velocity despite a continual longitudinal decline in water velocity and turbulence. In short, Tiffan et al. (2009b) showed that some fish regain their migratory momentum after losing velocity and turbulence cues, suggesting that the behavioral disposition to move downstream could be triggered by environmental as well as behavioral motivation.
The behavioral motivation for downstream movement has been linked to physiological development in anadromous salmonids (e.g., fall-run Chinook Salmon; Zaugg 1989). Temperature affects smoltification and physiological development (Hoar 1988), which in turn affect downstream movement and responses to environmental stimuli, such as flow (e.g., Youngson and Simpson 1984; Sykes et al. 2009). Zaugg (1981) showed that subyearlings exhibiting more advanced levels of smoltification had higher seaward emigration rates in the Columbia River than fish with less-advanced smoltification. Similarly, greater physiological development was associated with faster downstream movement rates of yearling Chinook Salmon in the Snake River (Muir et al. 1994). Connor et al. (2002) speculated that temperature-mediated differences in smoltification might explain variability in the smolt emigration timing—and thus downstream movement rate—of subyearlings. It is possible that juvenile life history diversity in the Snake River basin has a physiological basis; however, this has yet to be explored.
The findings of Tiffan et al. (2009b) provided important insights regarding subyearlings’ behavioral responses to water velocity that contribute to life history diversity; however, the study had several limitations. First, the evaluation was only conducted during June and July, and transmitters operated for a maximum of 8 d, which restricted temporal inferences about the results. Second, the physiological status of fish was not considered when interpreting movement behavior. Finally, fish from the Clearwater River were not evaluated, which is important because this population would be expected to be most affected by flow augmentation. Thus, we conducted a follow-up study to address these uncertainties. Our approach included fish releases that occurred from May to October, and we used transmitters that had an expected operating life of 45 d. Similar to Tiffan et al. (2009b), we collected water velocity data that were compared to fish movement, but we also included an assessment of physiological status so as to enhance interpretation of observed fish movement patterns. Using these approaches, our objectives were to identify environmental, behavioral, and physiological factors that influence the downstream movement rate of Clearwater River subyearlings, which comprise a critical component of the Snake River fall-run Chinook Salmon population, and to compare our results to the findings of Tiffan et al. (2009b) for subyearlings in the Snake River.
Fish Origin and the Study Area
The origin of subyearlings within the study area is germane to this paper because we used hatchery-origin subyearlings to inform our study (see Smith et al. 2003 for precedents). The hatchery-origin subyearlings released into the lower Snake River and lower Clearwater River watersheds were produced by a long-term genetic conservation program that was established to maintain the genetic integrity of the lower Snake River basin fall-run Chinook Salmon population at a time when it was near extinction (see Bugert et al. 1995). Hatchery releases are made directly into spawning areas, with the intent to imprint the juveniles to those areas so that they supplement spawning in the wild upon their return as adults. Contemporary production has been completely influenced by the hatchery program. Contemporary juveniles produced in the wild are referred to as being of natural origin. Natural-origin and hatchery-origin subyearlings are present within the study area during overlapping time periods, but origin can be distinguished based on differences in FL and morphology (Tiffan and Connor 2011).
We studied the migratory behavior of hatchery-origin subyearling Chinook Salmon in (1) the Clearwater River between its mouth (river kilometer [rkm] 0) and Kayler's Landing (rkm 53) and (2) Lower Granite Reservoir from Lower Granite Dam (rkm 173), as measured from the mouth of the Snake River, to the confluence of the Clearwater River (rkm 224; Figure 1). We divided our study area into four reaches to capture variability in river hydrodynamics and morphology. The first reach (“free-flowing river”) extended 28.7 km downstream from the Nez Perce Tribal Hatchery (rkm 35.9) to the Clearwater Paper Mill (rkm 7.2). The second reach (“transition zone”) extended 10.2 km downstream from the beginning of river impoundment by Lower Granite Reservoir to the Red Wolf Bridge (rkm 221.0) across the Snake River and was characterized by the transition from riverine to impounded reservoir habitat. The third reach (“upper reservoir”) extended 10.2 km downstream from the Red Wolf Bridge to Silcott Island (rkm 210.8; Figure 1). Depths were shallower and the river channel was narrower in the third reach than in the fourth reach (“lower reservoir”). The lower reservoir reach extended 36.3 km downstream from Silcott Island to the forebay of Lower Granite Dam (rkm 174.5). For comparison, Figure 1 also shows the reaches studied by Tiffan et al. (2009b). In that study, run-at-large (i.e., mix of natural- and hatchery-origin) subyearlings were released mainly at Billy Creek (rkm 265.5), which allowed them to traverse 30 km of unimpounded river before reaching Asotin, Washington (rkm 235.5). The Snake River transition zone extended from Asotin downstream to the Red Wolf Bridge. The upper and lower reservoir reaches studied by Tiffan et al. (2009b) are the same as described above.
Methods
Data Collection
Velocity
We estimated water velocity in our study reaches by using the same approach as Tiffan et al. (2009b). In brief, we collected empirical water velocity data with a 600-kHz acoustic Doppler current profiler (ADCP; RD Instruments, Inc., San Diego, California) along numerous transects within each reach over a range of flows. We then constructed transect-specific regressions between velocity and flow that enabled us to estimate water velocity for each fish given the flow they experienced while traveling through each reach. Within the free-flowing Clearwater River, velocities (km/d) were measured at four flows (141, 435, 876, and 1,314 m3/s) from May to August 2011 and during November 2012. At each flow, velocities were measured along 10 fixed cross-sectional transects, with measurements along each transect being replicated four times. Only four transects were sampled in November due to low flows that limited navigation. Transects were located between rkm 10.3 and 33.7, and their locations depended on accessibility and navigability. In the Clearwater River portion of the transition zone, velocities were measured at two cross-sectional transects (rkm 0.8 and 3.7) and at seven flows (79, 111, 280, 354, 399, 864, and 949 m3/s) during 2009. All ADCP velocities were measured in a grid of cells, or bins, that were 5.0 m long × 0.5 m deep at each transect. The midpoint of each column of bins was georeferenced by using a GPS. Clearwater River flow data for each sampling date were obtained from the U.S. Geological Survey gauge at Spalding, Idaho (Figure 1). For the upper and lower reservoir reaches, we used the velocity–flow relationships developed by Tiffan et al. (2009b) and flow data collected at Lower Granite Dam by the U.S. Army Corps of Engineers (DART 2016).
Fish collection, tagging, and release
To ensure an adequate supply of fish of appropriate size for our study, we obtained subyearlings from Lyons Ferry Hatchery; the subyearlings were transported to and reared at Dworshak National Fish Hatchery on the North Fork Clearwater River. Fish were held in a 2-m3 circular tank containing 1,614 L of 10°C hatchery water supplied at 60 L/min. Starting fish size was 80 mm FL, and initial density was 0.006 kg/L. The tank was treated with 2.3 kg of coarse water-softening salt (NaCl) immediately after fish transfer, after cleaning, and after weekly formalin treatments (4.2–4.7 mL/L for 1 h). Formalin treatments were necessary to curtail outbreaks of fungus. There were no bacterial or viral epizootics during rearing. We fed the fish a saturation diet (4% of total body weight) of pelleted feed. The water volume in the tank was increased to 1,926 L as the fish grew to a maximum density of 0.013 kg/L.
Monthly releases of hatchery subyearlings took place from May through October (Table 1). On 1–2 d per month, we surgically implanted subyearlings with coded radio tags (Lotek Wireless, Inc., Newmarket, Ontario) and PIT tags via the methods of Liedtke et al. (2012). The tags we used (Model NTC-M-1) measured 12 mm long × 5 mm wide, weighed 0.37 g in air, and had a life expectancy of 45 d. Antenna length was 16 cm. For all tagged fish, the tag weight did not exceed 5% of the body weight at the time of tagging. Immediately after surgery, fish were placed into 270-L holding containers that were constantly supplied with 10.0–12.0°C hatchery water. Fish density in these containers ranged from 0.003 to 0.014 kg/L. From 16 to 24 h after surgery, we trucked tagged fish to Kayler's Landing on the Clearwater River (Figure 1). During each 20-min trip to Kayler's Landing, oxygen in the tank was kept near 100% saturation. The fish were acclimated to ambient river temperature (range = 8.3°C in October to 14.4°C in June) by gradually draining the tank while using a water pump to gradually replace the water in the tank with river water at a maximum warming rate of 2°C per hour. Only one fish died after tagging in 2007. The total number of fish released per month ranged from 97 to 100. Mean FL at release ranged from 90.2 to 145.5 mm, and mean weight ranged from 8.2 to 33.0 g (Table 1).
| Month | N | FL (mm) | FL range (mm) | WT (g) | WT range (g) | Mean tag burden (%) |
|---|---|---|---|---|---|---|
| May | 97 | 90.2 ± 3.1 | 85–98 | 8.2 ± 0.8 | 7.2–10.6 | 4.5 |
| Jun | 100 | 92.9 ± 4.0 | 86–101 | 8.8 ± 1.2 | 7.2–11.8 | 4.2 |
| Jul | 97 | 95.4 ± 4.3 | 85–106 | 9.3 ± 1.4 | 7.2–13.4 | 4.0 |
| Aug | 100 | 121.7 ± 10.1 | 94–149 | 20.2 ± 5.5 | 8.6–40.1 | 1.8 |
| Sep | 99 | 136.1 ± 11.1 | 107–159 | 28.4 ± 7.4 | 12.3–45.7 | 1.3 |
| Oct | 99 | 145.5 ± 10.6 | 104–170 | 33.0 ± 7.4 | 11.7–58.1 | 1.1 |
There were two important differences between the fish tagged for this study and those used in the Tiffan et al. (2009b) study. First, in the latter study, the tagged fish were run-at-large subyearlings, meaning that they were a mix of natural- and hatchery-origin individuals. They were also tagged with larger tags (15.0 mm long, 4.5 mm in diameter, and 0.85-g weight in air), and the tags had a life expectancy of 8 d. Second, the fish were collected and tagged at Lower Granite Dam before being transported for release upstream; thus, they had already experienced the migration route.
Fixed-site monitoring
In both studies, we monitored the movement of radio-tagged fish past fixed detection sites located at reach boundaries (Figure 1). The equipment at the fixed detection sites included four- and/or nine-element Yagi antennas used in conjunction with a Lotek SRX receiver. At each detection site, antennas and receivers were placed on both sides of the river or reservoir except at the Nez Perce Tribal Hatchery (north side only). At the Red Wolf Bridge, six antenna pairs were evenly spaced across the bridge.
Passive integrated transponder tag detection data
Lower Granite Dam and seven additional downstream dams are equipped with fish guidance structures that divert a subsample of the fish passing the dams from the turbine intakes into a juvenile bypass system, where PIT-tagged fish are detected with nearly 100% efficiency (Prentice et al. 1990). The detection dates of the fish we PIT-tagged were stored and then downloaded from a central database (PTAGIS 2017). The operation of the juvenile fish bypass systems was seasonal, starting in early spring and ending in late autumn.
Physiology
Subsequent to the movement behavior work described above, we assessed the physiological development of subyearlings in the Snake and Clearwater rivers as part of a separate life history study. In 2011, we tracked the seasonal development of gill Na+/K+-ATPase in subyearlings within the lower Snake River. For this, we sampled rearing parr at Silcott Island during spring, and we sampled presumed actively migrating smolts at Lower Granite Dam during summer. We also sampled the forebay of the dam by angling during October to collect fish that had delayed their seaward migration. One sample of fish was collected from the lower Clearwater River portion of the transition zone in late August. In 2012, we collected a time series of gill Na+/K+-ATPase from Clearwater River subyearlings in six biweekly samples from late June to mid-September. Fish were collected with a seine from the Clearwater River portion of the transition zone. During the same time, previously PIT-tagged, natural-origin subyearlings that were known with certainty to be from the lower Snake River watershed were recaptured from the PIT tag diversion system (Marsh et al. 1999; Downing et al. 2001) at Lower Granite Dam for comparison. As in 2011, we also collected fish from the forebay of the dam during October and November. The dates and sample sizes of collected fish were restricted by fish migration timing and mortality limits in our fish collection permit. In all collections, we attempted to select only natural-origin fish based on morphological criteria (Tiffan and Connor 2011).
We collected 8–15 fish on each sampling date at Silcott Island, the transition zone, and the forebay. The number and sampling dates of smolts collected at Lower Granite Dam could not be determined a priori and depended on when known-origin, PIT-tagged fish passed the dam. Collected fish were held in a cooler with aeration until each was processed. Fish were euthanized with an overdose of tricaine methanesulfonate (MS-222; 250 mg/L) buffered with an equal amount of sodium bicarbonate. We visually assessed each fish for pigmentation indicative of parr (i.e., dark vertical bars) or smolt (i.e., silver color); fish were then measured and weighed. We collected the first two gill arches on the left side and placed them in 1 mL of sucrose–EDTA–imidazole buffer (250-mM sucrose, 10-mM Na2EDTA, and 50-mM imidazole; pH 7.3). Gill samples were placed on ice until sampling was complete and then were transferred to dry ice and later stored at −80°C until Na+/K+-ATPase activities were determined using the method of McCormick (1993). All samples were analyzed within 6 months of collection to guard against sample degradation.
Data Analysis
All data analyses closely followed the methods of Tiffan et al. (2009b) so as to make the results comparable between studies.
Estimation of velocity
For analyses of fish movement rate and water velocity, it was necessary to estimate mean cross-sectional velocity for the time each fish spent between two adjacent fixed detection sites in a reach. We generated these estimates in three steps. First, we used observed river flow (independent variable) and measured mean velocity (dependent variable) to fit regression models for each transect for predicting mean velocity. For the free-flowing river, logarithmic or second-order polynomial models fit the data best (R2 range = 0.96–0.99). After fitting the models, the second step was to predict mean cross-sectional velocity at each transect location from the mean flow calculated using hourly flow data collected at either Spalding, Idaho, or Lower Granite Dam (depending on the reach) during the period a subyearling was passing between two adjacent fixed detection sites in a reach. The third step for estimating the mean cross-sectional velocity was to average the predicted values of flow and velocity provided by the transect-specific regression models for each reach. For fish passing through the transition zone, we calculated an average weighted by the time a fish spent both above and below the confluence because this reach included portions of both the river and the reservoir.
Fish speed versus current speed
Analyses of fish movement did not include information from the 17.1-km reach between the release site and the first detection site (Nez Perce Tribal Hatchery) to account for any postrelease effect on behavior. We calculated downstream movement rates (km/d) for each subyearling that was detected at a fixed detection site within a reach as the distance between the detection sites divided by the number of days that elapsed between detection at the upstream and downstream detection sites. This provided observations on movement rate for individual subyearlings in one or more reaches. We calculated the ratio between the movement rate of an individual subyearling between each pair of fixed detection sites and the estimated mean velocity for this location. We classified all fish with ratios greater than 1.0 as “fast migrants” and fish with ratios less than or equal to 1.0 as “slow migrants” (similar to Tiffan et al. 2009b). We calculated the percentage of fast and slow migrants (±SE; Zar 1984) for each reach. We reasoned that if fish movement was passive and if fish moved downstream in the zone of flow centered around the mean velocity, then about 50% of the migrants in each reach would be fast and 50% would be slow. If fish responded to reductions in velocity as they moved downstream into the transition zone or reservoir reaches by increasing swimming time to relocate the zone of flow (Coutant and Whitney 2006), we would expect the percentage of fast migrants to fall below 50. Conversely, percentages of fast migrants greater than 50% would imply that fish were actively moving downstream faster than the current speed.
We used a probit model with a random term for individual fish (Littell et al. 1996) to test the statistical null hypothesis that the percentage of fast migrants did not change from reach to reach. The random fish term accounted for correlations among repeated observations of the same fish. We included a term for release to account for possible differences in behaviors between the six releases. The probability of a fish being a fast migrant was modeled as p = probit(reach, release, fish), where reach and release are fixed terms and fish is a random term. We used Akaike's information criterion (AIC) values to determine whether both reach and release were factors affecting the percentage of fast migrants. For this analysis, we only considered the migration status calculated from the first 8 d of a fish's experience; this ensured comparability of our results to those of Tiffan et al. (2009b), who used tags with an 8-d life.
Comparing movement rate among reaches
For this and all subsequent analyses, data on fast and slow migrants were analyzed jointly over the entire time the fish were at large (i.e., ≤45-d tag life). We used a mixed model to test whether movement rate depended on reach and release (fixed class variables). Movement rate was square-root transformed to stabilize variances. The effects of repeated measurements of the movement rate for individual fish were modeled using an autoregressive error structure with heterogeneous variances (Littell et al. 1996). We established significance for statistical analyses at P ≤ 0.05. We used Fisher's protected test for least significant differences to conduct pairwise comparisons. For the sake of clarity and brevity throughout this paper, we limit the results to relevant findings. We do not report results of interactions unless they were significant and disorderly (e.g., Ott 1993); furthermore, we do not present every P-value or the results of every pairwise comparison.
Movement rate and velocity
To evaluate the effect of mean cross-sectional velocity and mean flow on downstream movement rate, we treated the estimated mean cross-sectional velocities as an independent variable measured without error. We then constructed ordinary least-squares regression models to examine the relationships between square-root-transformed movement rate and water velocity for each reach separately, with data pooled by release. Coefficients of determination were qualitatively compared to determine how much variation in movement rates was explained by water velocity in each reach.
Physiology
For fish sampled for physiology, mean FL and gill Na+/K+ ATPase activities were compared between sampling dates within years by using one-way ANOVA, and the Student–Neuman–Keuls test was used to perform pairwise comparisons (α = 0.05).
Results
Flows and Temperatures
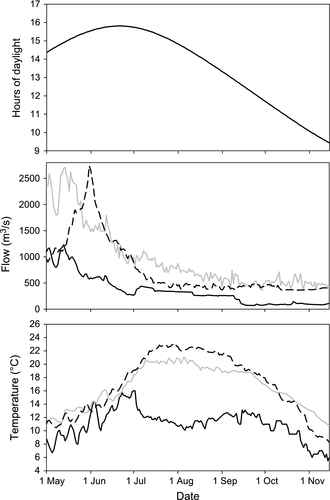
Clearwater River flow declined from a peak of 1,200 m3/s in mid-May to lows around 80 m3/s by late September (Figure 2). Beginning in early July, additional water was released from Dworshak Dam, which increased Clearwater River flows to 396 m3/s in July, declining to 255 m3/s by mid-September, when flow augmentation ended (Figure 2). Because released water was relatively cool (≈7°C), the temperature in the Clearwater River decreased from 15°C to about 11°C during this time. Flows at Lower Granite Dam peaked above 2,700 m3/s in mid-May and declined to about 500 m3/s after mid-September, and peak summer water temperatures at the dam were maintained at around 20°C or less. For comparison, mean Snake River flows measured near Billy Creek (Figure 1) during the Tiffan et al. (2009b) study declined from a seasonal high of 2,740 m3/s in late May to lows around 400 m3/s by autumn (Figure 2). Mean Snake River temperatures increased from 11°C in early May to highs exceeding 22°C from mid-July to late August and then declined to 8°C by mid-November (Figure 2).
Fish Detection
Subyearlings passed multiple fixed detection sites as they moved downstream, which we refer to as passage events. Detections were highest in the free-flowing river during all releases and declined as fish moved downstream (Table 2). The number of passage events was highest in all reaches for May and October releases. There were relatively few passage events in the transition zone, upper reservoir, and lower reservoir for fish released from June to September. No fish was detected in the lower reservoir during June and July, and only two fish traversed this reach in August. Overall, 36 fish were detected in PIT-tag detection arrays at downstream dams. The number of fish whose PIT tags were detected in 2007 declined seasonally, but the number of PIT tags detected the following year (indicative of overwintering in freshwater) increased as the release date became later (Table 2).
| Release month | Number released | Reach | Number of PIT tag detections by year | ||||
|---|---|---|---|---|---|---|---|
| River | Transition zone | Upper reservoir | Lower reservoir | 2007 | 2008 | ||
| May | 97 | 90 | 52 | 43 | 34 | 13 | 0 |
| Jun | 100 | 59 | 15 | 2 | 0 | 2 | 0 |
| Jul | 97 | 72 | 10 | 2 | 0 | 1 | 2 |
| Aug | 100 | 74 | 12 | 4 | 2 | 1 | 0 |
| Sep | 99 | 32 | 16 | 8 | 5 | 0 | 4 |
| Oct | 99 | 73 | 50 | 31 | 16 | 4 | 9 |
Movement Rate and Status
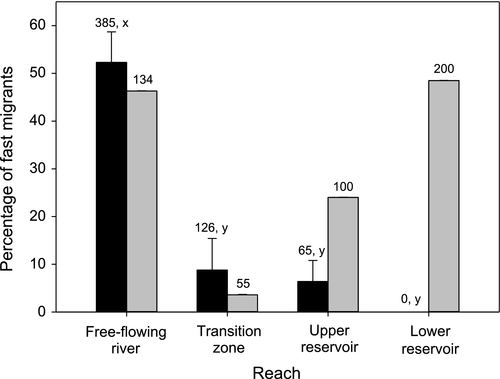
The mean percentage of fast migrants in the free-flowing river over all releases was 52.3% and decreased to less than 10% as subyearlings moved through the transition zone and upper reservoir (Figure 3). No fish were classified as fast migrants in the lower reservoir. The percentage of subyearlings classified as fast migrants was significantly dependent on reach and release. The percentage of fast migrants in the free-flowing river was significantly higher than percentages in the remaining reaches, which did not differ from each other (Figure 3). The seasonal percentages of fast migrants in the free-flowing river ranged from 32% in June to 76% in October but did not vary significantly by release. The seasonal percentages of fast migrants in transitional and reservoir reaches were less than 13.0% for all but the October release, in which 40.4% and 22.2% of the fish were fast migrants in the transition zone and upper reservoir, respectively.
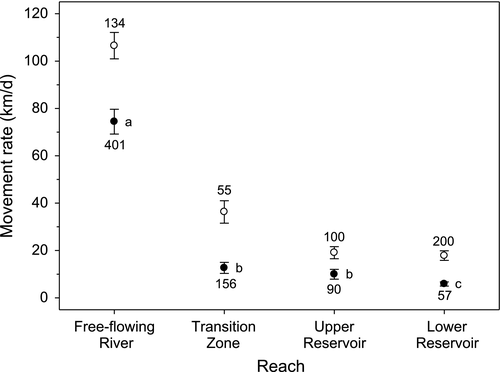
Subyearling movement rate varied by reach (F3, 285 = 204.01, P < 0.001) and release (F5, 395 = 28.72, P < 0.001; AIC = 2,984.1), but many pairwise comparisons and interactions were non-estimable due to a lack of detections in some reaches and releases. We used the model containing reach (AIC = 3,346.6; all releases combined) to show that movement rate decreased from the free-flowing river to the lower reservoir and varied significantly among reaches (F3, 298 = 356.23, P < 0.001; Figure 4; Table 3). Fish moved substantially faster through the free-flowing river than through other downstream reaches. Seasonally, movement rates generally declined from May through September within reaches but increased slightly during October in the free-flowing river and transition zone (Table 3).
| Month | Reach | |||||||
|---|---|---|---|---|---|---|---|---|
| Free-flowing river | Transition zone | Upper reservoir | Lower reservoir | |||||
| n | Rate | n | Rate | n | Rate | n | Rate | |
| May | 90 | 128.8 ± 52.9 | 52 | 22.3 ± 19.9 | 43 | 14.6 ± 10.3 | 34 | 7.7 ± 2.6 |
| Jun | 59 | 64.3 ± 44.6 | 15 | 6.1 ± 2.8 | 2 | 14.6 ± 6.4 | 0 | |
| Jul | 72 | 78.2 ± 44.6 | 11 | 6.8 ± 10.6 | 2 | 6.7 ± 6.5 | 0 | |
| Aug | 74 | 74.8 ± 36.1 | 12 | 0.8 ± 0.5 | 4 | 10.5 ± 14.9 | 2 | 1.4 ± 0.03 |
| Sep | 33 | 16.9 ± 16.6 | 16 | 3.1 ± 3.3 | 8 | 2.2 ± 2.6 | 5 | 3.2 ± 1.8 |
| Oct | 73 | 37.5 ± 22.4 | 50 | 11.5 ± 6.9 | 31 | 5.4 ± 6.9 | 16 | 3.2 ± 1.9 |
Relation to Water Velocity
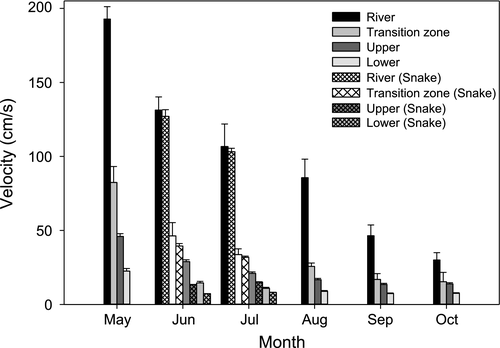
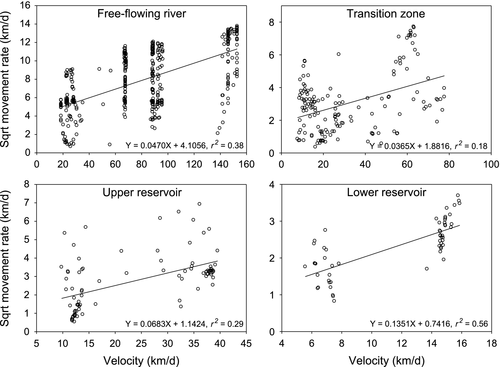
Water velocities declined seasonally and were substantially higher in the river than in other reaches (Figure 5). Velocities were generally higher than 50 cm/s in the river but were lower than this in other reaches except in the transition zone during May. The amount of variation in subyearling movement rate explained by water velocity was variable and was highest in the lower reservoir (r2 = 0.56), followed by the river (r2 = 0.38), upper reservoir (r2 = 0.29), and transition zone (r2 = 0.18; Figure 6). The slopes and intercepts for all models were significantly different from zero.
Physiological Development
We analyzed physical characteristics and traditional measures of smoltification (i.e., size, pigmentation, and gill Na+/K+-ATPase activity) in natural-origin subyearlings from the Snake and Clearwater rivers to provide an initial understanding of the physiological and developmental status of fish at different time points in these two different rearing environments. In 2011, the FLs of natural-origin subyearlings differed significantly as they grew over time (F6, 98 = 371.41, P < 0.001; Figure 7). Subyearlings collected at Silcott Island averaged 57–61 mm and had either dark or lightened parr marks characteristic of developing parr. Fish sampled at Lower Granite Dam during July and August 2011 were larger, averaging 97–119 mm, and had silver pigmentation characteristic of smolts, but faint parr marks were apparent on two fish. All subyearlings collected at Lower Granite Dam in October 2011 averaged 144 mm, had a silver appearance, and lacked parr marks. By comparison, fish sampled in the Clearwater River on August 24, 2011 (mean = 98 mm), were similar in size to those sampled at Lower Granite Dam in mid-July, and all individuals but one were highly silvered. In 2012, significant size differences existed between fish that were sampled on different dates (F8, 76 = 82.89, P < 0.001; Figure 7). In 2012, subyearlings collected from the Clearwater River in late June and mid-July averaged 69 and 66 mm, respectively, and all had dark parr marks. From August to mid-September, smolt-sized fish in the Clearwater River averaged 99–115 mm and were silvered, but many had faint parr marks that were still visible. Subyearlings (mean = 97 mm) collected at Lower Granite Dam during summer 2012 were all silver in appearance. Subyearlings collected in the forebay of Lower Granite Dam in autumn 2012 averaged 179–189 mm and were silver in appearance (Figure 7).
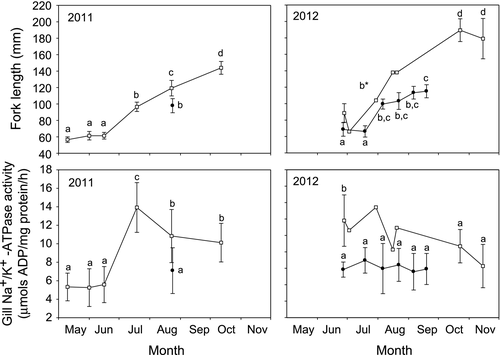
Subyearling gill Na+/K+-ATPase activity showed significant seasonal variability in 2011 (F6, 98 = 32.97, P < 0.001; Figure 7). Gill Na+/K+-ATPase activity was not significantly different between parr collected in May and June at the Silcott Island rearing site but increased significantly in smolts migrating past Lower Granite Dam. Gill Na+/K+-ATPase activity of smolts in July was almost three times higher than the gill Na+/K+-ATPase activity of parr and declined into the fall but remained significantly higher than that of parr. Gill Na+/K+-ATPase activity of subyearlings collected from the Clearwater River in late August was not significantly different from that of parr collected from the Snake River and was significantly lower than that of smolts at Lower Granite Dam on all sampling occasions (Figure 7).
In 2012, subyearlings collected from the Clearwater River showed no increasing trend in gill Na+/K+-ATPase activity seasonally or as the fish grew in length (F5, 50 = 0.59, P > 0.7098; Figure 7). Smolts collected at Lower Granite Dam from June to August had gill Na+/K+-ATPase activity that was about twice as high as that of Clearwater River fish (F8, 72 = 6.77, P < 0.0001). Gill Na+/K+-ATPase activity of subyearlings at Lower Granite Dam declined into autumn, and fish sampled in October and November were not significantly different from Clearwater River fish.
Discussion
Subyearlings moved downstream through the free-flowing Clearwater River relatively quickly regardless of the time of year and with generally similar percentages of fast and slow migrants. This supports the idea that water velocity is a primary physical determinant of downstream fish movement if the fish are in fast currents and disposed to move (e.g., they are not making feeding excursions from low-velocity holding habitat) and that such fish are moved passively by the current, regardless of their developmental status. However, fast downstream movement rates were not observed in the transition zone or impounded reaches. Upon leaving the river, the subyearling movement rate slowed as velocities decreased, and few fish made it through the upper and lower reservoir, particularly during summer. Indeed, the percentage of fast migrants continued to decline as fish moved through the reservoir and it never increased, unlike what was observed for fish from the Snake River (Tiffan et al. 2009b)—despite velocities being slightly lower during the Tiffan et al. (2009b) study than in the current study (Figure 5). It is possible that velocity exerts a strong influence on subyearling movement rate as long as some threshold is exceeded. The Independent Scientific Advisory Board (ISAB 2003) summarized evidence for nonlinear relationships (e.g., broken-stick regression) between hydraulic conditions and juvenile salmon performance measures, such as travel time and survival, which supports the possibility of a velocity–movement rate threshold, although that study did not explicitly examine this. It is difficult to say whether a velocity threshold exists for subyearlings moving through the Clearwater River and Lower Granite Reservoir; however, velocities above about 50 cm/s were associated with the high movement rates and percentages of fast migrants observed in the river (Figures 4 and 5). Restoration of riverine velocities in reservoir habitats would likely increase the downstream movement rates of subyearlings.
Tagged subyearlings had reduced downstream movement rates and greater percentages of slow migrants in transitional and reservoir habitats, which may be due to behavioral responses to reduced hydraulic cues and a novel environment. Both turbulence and velocity are lower in impoundments than in rivers (Enders et al. 2005; Coutant and Whitney 2006; Tiffan et al. 2009b) and may disorient smolts and contribute to wandering, upstream movement, and migratory delay (e.g., Venditti et al. 2000; Plumb et al. 2003). In addition, the thermal environment in Lower Granite Reservoir is complex during summer, when cool water from Dworshak Reservoir is released for temperature control (Cook et al. 2006). Consequently, temperatures in Lower Granite Reservoir range from 11°C to 22°C and may further delay the movement of subyearlings as they attempt to thermoregulate while moving downstream (Tiffan et al. 2009a). Together, these factors may have contributed to the slow movement of Clearwater River subyearlings in the transition zone and reservoir. This suggests that behavioral disposition to move downstream has a greater influence on movement rates than velocity in low-velocity habitats—particularly if the fish need or want to move downstream quickly. However, this reasoning is not supported by the findings of Tiffan et al. (2009b), whose tagged fish experienced hydraulic and environmental conditions similar to those in this study yet displayed very different downstream movement. It is important to recognize that the prior migration experience of the fish used in the Tiffan et al. (2009b) study could have contributed to the differences in fish behavior between the two studies. However, in both studies, fish behaved similarly on the first leg of their downstream journey, and we believe that subsequent movement was not influence by differences in migration experience. We acknowledge that differences in fish sizes, origin (i.e., hatchery versus natural), and rearing environment may explain some of the variation between the two studies. Nevertheless, we believe that the differential physiological development of Clearwater River and Snake River subyearlings provides additional insight into the mechanisms underlying their downstream movement.
Snake River subyearlings reared under warmer temperatures and an increasing photoperiod grew fast (e.g., 1.3 mm/d; Connor and Burge 2003) and transitioned from parr with low gill Na+/K+-ATPase activities to completely silvered smolts with elevated gill Na+/K+-ATPase activities by the time they moved downstream past Lower Granite Dam during early summer. These conditions are consistent with a typical subyearling smoltification schedule (Clarke et al. 1981; Zaugg 1981; Muir et al. 1994; Beckman and Dickhoff 1998). In contrast, subyearlings from the Clearwater River were more similar to parr than smolts in their physiological status, as evidenced by their retention of faint parr marks and the lack of increase in gill Na+/K+-ATPase activities despite growing throughout the summer. The combined effects of late emergence and slower growth under a decreasing photoperiod and cool temperatures may retard their physiological development. Although growth of Clearwater River fish was not measured, Ewing et al. (1980) suggested that slow growth rates delay the increase in gill Na+/K+-ATPase activity associated with smoltification in Chinook Salmon, and this may explain the absence of such an increase in Clearwater River subyearlings. Similarly, cool water temperatures during rearing may have contributed to the lack of gill Na+/K+-ATPase activity development in Clearwater River subyearlings, similar to that seen in Atlantic Salmon Salmo salar (McCormick et al. 2000).
The differential physiological states between Clearwater River and Snake River subyearlings may control downstream movement and hence their juvenile life history. Increasing photoperiod, temperature, growth rate, gill Na+/K+-ATPase activity, and smolt status have all been linked to increased downstream movement rates in juvenile anadromous salmonids (Zaugg 1981; Muir et al. 1994; Beckman et al. 1998; McCormick et al. 1998). These conditions are met for early migrating Snake River fall-run Chinook Salmon, which typically complete seaward migration as subyearlings (Connor et al. 2002). In contrast, the cooler water and decreasing photoperiod to which many of the subyearlings in the Clearwater River are exposed may reduce their growth rate and physiological development and hence movement disposition. This could explain the delay in downstream movement upon entry into Lower Granite Reservoir, which is facilitated by the opportunity to select optimal temperatures (Tiffan et al. 2009a) for growth to large sizes. Although large fish size has been associated with migratory disposition (e.g., Ewing et al. 1984; Beckman et al. 1998; Connor et al. 2003b), it is probable that fish residing in Lower Granite Reservoir during late summer and autumn under potentially warm temperatures (20°C) have missed their physiological and behavioral windows for seaward migration (McCormick et al. 1998; Zydlewski et al. 2005). This is supported by the fact that in 2012, gill Na+/K+-ATPase activity in autumn was significantly lower than that observed for smolts in early summer but not significantly different from that of parr-like subyearlings from the Clearwater River, which showed no gill Na+/K+-ATPase activity development. Although downstream movement increased for fish that were released in October, autumn movement of juvenile salmon is not unprecedented but may not necessarily be considered seaward migration (Bjornn 1971; Beckman et al. 2000). Because most fish that reach Lower Granite Dam in autumn originate from the Clearwater River (Connor et al. 2002, 2005), a lower disposition to move downstream—stemming from reduced (or loss of) physiological development and environmental cues (e.g., low flows and velocities)—may explain the propensity of fish at this time of year to adopt a yearling life history (Tiffan et al. 2012). This is supported by the greater number of September and October migrants whose PIT tags were detected the following spring, indicating that they stopped seaward movement and spent the winter in freshwater.
It is important to recognize that physiological differences may have existed between the presumably natural-origin fish sampled for gill Na+/K+-ATPase activity and the hatchery-origin fish that were radio-tagged. However, we believe that any differences were less influential than the temperature and photoperiod effects discussed above for the following reasons. First, it has been shown that hatchery-reared salmonids generally have the same pattern of smolt development as natural-origin fish (Folmar and Dickhoff 1980). Second, during rearing, hatchery fish and natural-origin fish were exposed to the same photoperiod, which can exert a strong influence on physiological development (Wagner 1974; Zaugg 1981; Muir et al. 1994). Finally, after release, the hatchery fish in our study experienced the same river conditions as natural-origin fish, which have been shown to contribute to physiological development (e.g., Zaugg 1982; Zaugg et al. 1985).
Results from this study provide evidence that behavioral and life history differences between Snake River and Clearwater River subyearlings may have a physiological basis that is modified by environmental conditions. The effects of cool water temperatures on fry emergence and growth cannot be discounted as life history determinants for Clearwater River subyearlings, but further temperature reductions during summer flow augmentation likely reduce physiological development and downstream movement, thereby contributing to a yearling life history.
Acknowledgments
We thank our U.S. Geological Survey colleagues, particularly Jamie Sprando and Helena Christiansen, whose efforts contributed to this study. The study was funded by the Bonneville Power Administration (Project 200203200) and was administered by Debbie Docherty. Any use of trade, firm, or product names is for descriptive purposes only and does not imply endorsement by the U.S. Government. Data are publicly available at http://www.streamnet.org/files/678/678.zip. There is no conflict of interest declared in this article.


