Enhancement of impact resistance of alkali-activated slag concrete through biochar supplementation
Abstract
Biochar is a well-known sustainable and effective additive used in mortar/concrete to improve its mechanical properties. However, its potential to improve the impact resistance of concrete is still unexplored. This paper investigates biochar's effectiveness in improving the strength and impact performance of alkali-activated slag concrete (AASC). Five AASC samples with 0%, 2%, 4%, 6%, and 8% rice husk biochar (RB) were employed in an experimental program. The strength and the impact resistance were tested, and the latter was assessed over a drop-weight test conforming to the ACI Committee 544 guidelines. The crack propagation of the impact-tested samples was examined using micro-CT images. The results showed that adding RB up to 6% improved, notably the 28-day compressive strength of AASC. At 6% RB, the strength enhancement was 44.6%, whereas no additional gain was observed at the 8% RB blend. More importantly, except for the 8% RB sample, the impact resistance was considerably augmented with the RB level increment. The increment in the impact number at the first crack and the failure in the 6% RB sample were as high as 185% and 180%, respectively. The reduction in the solution/binder ratio of the mix with the addition of biochar and the internal curing effect of biochar were deemed to be responsible for these improvements. However, possibly due to biochar's brittle characteristics, the increase in RB dosage from 6% to 8% reduced the impact resistance drastically.
1 INTRODUCTION
Ordinary Portland cement (OPC) is the commonly used cementitious material in the construction industry. However, the need for alternative binders emerges highly due to higher CO2 emissions and energy consumption related to OPC production.1 Over the recent past, alkali-activated materials have attracted reasonable attention as green alternatives to OPC due to their less CO2 emission and less requirement of natural resources.1, 2 For instance, Yang et al.3 revealed that despite the fact that the CO2 reduction rate of alkali-activated concrete depends on the type, concentration, and dosage of the alkaline activators, it reduces the CO2 emission by about 55%–75% as opposed to OPC concrete. In addition, alkali-activated slag (AAS) is well known for its ability to achieve outstanding mechanical performance at ambient curing conditions.2
Alkali-activated slag concrete (AASC) is produced through the chemical reaction between ground-granulated blast furnace slag (GGBS) and an alkaline activator. GGBS is a by-product of pig iron manufacturing, and it is estimated that the global annual production of GGBS is to be 270–320 Mt.1 Moreover, the energy consumption (1300 MJ) and the CO2 emissions (0.07 t) related to the production of one ton of GGBS are very less in comparison to those in OPC production.1 The selection of an appropriate alkaline activator is crucial as it critically affects the carbon footprint and mechanical properties of the final product. The most frequently used alkaline activator in AAS production is a combination of alkaline hydroxides and silicates (e.g., sodium hydroxide and sodium silicate) to achieve a high degree of alkali activation.2, 4 However, these activators, particularly sodium silicate, are highly carbon-intensive and expensive materials in AAS composites.2 Furthermore, AAS activated by sodium silicate is difficult to handle due to its reduced workability and quick setting.5, 6 Therefore, the selection of user- and environmental-friendly alkaline activators is much needed for the future development of AAS.
Recent studies have successfully attempted to activate GGBS with sodium carbonate (Na2CO3) with the aim of producing AAS with a low carbon footprint and improved performance in terms of workability and shrinkage. However, the low initial strength developed at ambient curing has discouraged the use of Na2CO3 as an alkaline activator in AAS production.1, 4, 6 Zhang et al.6 found that activation of slag (with D50 = 8.1 μm) by sodium carbonate (4% sodium oxide equivalent) yielded a very low 3-day compressive strength of 0.8 MPa, while the strength increased up to 29.7 MPa at the age of 28 days. As a solution, both Zhang6 and Rashad7 proposed to increase the slag fineness. Rashad et al.7 reported an increment in 3-day and 28-day compressive strength by 137.4% and 51.7%, respectively, when the slag fineness was increased from 2500 to 5000 cm2/g. Similarly, Tan8 provided evidence that wet ultra-fine slag (D50 = 3.87 μm) could be activated efficiently by weak bases such as sodium sulfate and sodium carbonate at room temperature. Supplementation of additives to accelerate the reaction rate is another method proposed in the literature. Gao et al.4 reported an increment in 1-day compressive strength up to 21.8 MPa due to the addition of calcium carbide residue to the Na2CO3-activated slag. Moreover, Jiao5 discovered that supplementing NaOH at a Na2CO3: NaOH molar ratio of 15:10 along with a Na2O content of 6% could achieve a 3-day compressive strength of around 45 MPa. A similar combination of Na2CO3 and NaOH was used in the authors' previous study as well and yielded a 3-day compressive strength of 22.4 MPa.9
Biochar is a well-known CO2 adsorbent material in cementitious applications due to its ability to capture and sequester CO2.10 Gupta11 revealed that the CO2 adsorption capacity of mixed wood sawdust biochar was as high as 1.67 mmol/g of biochar. Thus, the addition of 2 wt.% biochar in cementitious mortar was reported to reduce the net global warming capacity by 15.3%. Similarly, it has been reported that peanut hull biochar has a CO2 adsorption capacity of 0.86 mmol/g.12 Moreover, Praneeth13 discovered that the incorporation of 2–6 wt.% of corn stover biochar enhanced CO2 uptake in the cement-fly ash blocks. Meanwhile, numerous studies reported that the compressive strength of cementitious composites improved with the supplementation of biochar. Gupta and Kua14 observed an increase in both the 1-day and 28-day compressive strength of cementitious mortar by 20%–25% due to the addition of 0.5%–1% of mixed wood sawdust biochar. Praneeth13 reported an improvement in the 28-day compressive strength of OPC mortar from 38 MPa to 40.6 MPa when the corn stover biochar content was increased from 0% to 6%. However, further increments in biochar dosage from 6% to 8% reduced the compressive strength. Zeidabadi15 observed an increase in the 28-day compressive strength of cementitious concrete by 20.4% with the addition of 5% rice husk biochar, and increasing biochar content up to 10% reduced the compressive strength. Furthermore, the authors' previous study revealed that the increment of biochar replacement level from 1% to 5% in AAS mortar improved the 28-day compressive strength by 5.9%.9 It has been discussed in the literature that the high-water absorption and retention properties of biochar are mainly responsible for these compressive strength improvements. For instance, porous biochar reduces the effective water-to-binder ratio (w/b) of the mix as it absorbs a portion of the mixing water, lowering the evaporable free water content of the mix, which can create capillary pores and densify the microstructure.11, 16 Moreover, a part of the absorbed water is retained by biochar, which then emerges as an internal curing agent.10, 17 Consequently, the hydration efficiency is increased.10, 17 Enhanced formation of the hydration products also leads to densifying the microstructure.9
Depending on the intended application and properties of biochar, the feedstock and pyrolysis conditions need to be selected. It has been discovered that a low heating rate (10°C/min) enhances the micropore fraction of biochar, which is favorable for carbon sequestration.11, 18, 19 This is due to the fact that the low heating rate smoothens the release of volatiles and organics. Also, the application of a sufficient residence time (generally in the range of 30–120 min) accelerates the release of volatiles and enhances the pore volume of biochar.18 However, very long residence times consume more energy. Moreover, Chen20 found that sewage sludge biochar produced at a residual time of 60 min performed well in mortar in comparison to that produced at residual times of 30, 120, and 180 min. Furthermore, the yield of biochar is considered to be high when slow pyrolysis is adopted.19 In addition, biochar's flammability is also reduced.19
The impact resistance of concrete is an essential engineering parameter, especially for the structures being designed to resist the impact loads (e.g., road barriers and rock fall protection walls). Previous researchers have discovered different methods of improving the impact resistance of OPC concrete. The addition of steel fibers is reported to enhance the impact resistance of concrete considerably, as the pullout of those fibers can absorb a large quantity of the impact energy during a collision.21, 22 In addition, long steel fibers are more efficient at restricting the growth of micro cracks.21 Kangning et al.23 found that replacing river sand (between 0.6 and 1.25 mm) with porous pottery sand could improve the impact energy required for the first crack by 133%. The reason behind this improvement is the energy absorption capacity of the porous pottery sand. However, the influence of the water absorption of the pottery sand toward the mechanical properties still needs to be explored. Microstructure densification is another method for enhancing the impact resistance of concrete. It has been reported in previous studies that the addition of supplementary materials such as silica fume, which densifies the microstructure, could increase the impact resistance of concrete. Gupta et al.24 observed that the addition of 0%, 5%, and 10% silica fume to OPC concrete increased the number of impacts (in the drop hammer impact test) required for the failure from 65 to 67 and 72, respectively. Similarly, Nili et al.25 reported that the 8% cement replacement by silica fume improved the number of such impacts at the first crack and the failure by 6.9 times and 6.5 times, respectively. Moreover, Ameri et al.26 found that replacing natural sand in OPC concrete with 20%, 40%, and 60% of copper slag increased the impact energy at the initial crack level by 13%, 25%, and 42%, respectively, in contrast to the control mix. Similarly, the impact energy at the failure was increased by 14%, 31%, and 50%, respectively. This increment in impact resistance was attributed to the denser microstructure resulting from the incorporation of CS. In this light, biochar could also improve the impact resistance of concrete since it could potentially densify the microstructure of concrete.15, 20, 27-29 However, such a hypothesis has yet to be confirmed through experimental tests.
Even though many studies have been conducted on the impact resistance of OPC concrete, limited studies are found to be focused on the impact behavior of AASC and on methods of improving its impact resistance. Nis et al.30 investigated the effect of the inclusion of nanosilica and steel fibers on the impact resistance of AASC and discovered that the incorporation of 2% nanosilica and 1% long steel fibers enhanced the impact energy by 144.5 times compared to the control specimens. Similarly, Xu31 examined the effect of the length and dosage of the polypropylene fiber on the impact resistance of AAS mortar and revealed that the increase in fiber length and dosage improved the energy absorption capacity. Accordingly, 0.2% of the 15-mm length polypropylene fibers yielded the highest impact resistance of the AAS mortar. Abubakr et al.32 studied the effect of silicate modulus and sodium oxide dosage on the impact performance of AAS mixes. They found that increasing the sodium oxide content from 6% to 8% at a silica modulus of 1.5 enhanced the impact energy absorption by 107%. In addition, it was concluded that AAS mixtures showed better impact absorption compared to cement-based materials. Based on these facts, it is of interest to study the impact performance of biochar-supplemented AASC. In this context, the current study was formulated to study the influence of the blending of biochar on the impact resistance of the AASC and to determine the best blending level of biochar in the AASC in terms of impact and strength performances.
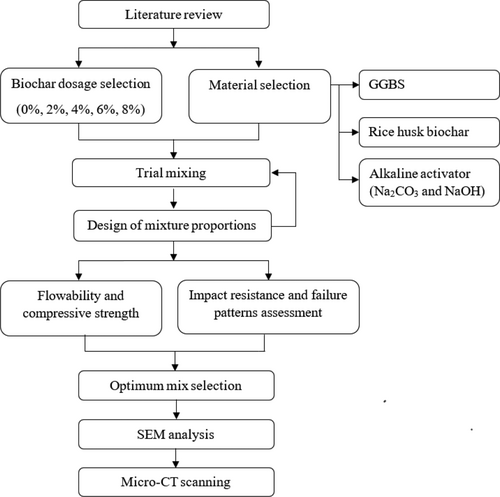
The drop hammer impact test based on ACI 544 committee33 is widely used to determine the impact resistance of concrete because of the simplicity of the approach.25, 34, 35 Therefore, this study aimed at testing five different AASC mixes with various biochar levels (0%, 2%, 4%, 6%, and 8%) under that particular drop hammer impact test method. The study was further extended to evaluate the biochar's influence on the microstructure and crack propagation of AASC using SEM analysis and micro-CT scanning. In addition, the effect of biochar on the slump flow and the compressive strength was monitored. The research methodology is illustrated in Figure 1.
2 MATERIALS AND METHODS
2.1 Materials
2.1.1 GGBS, alkaline activators and aggregates
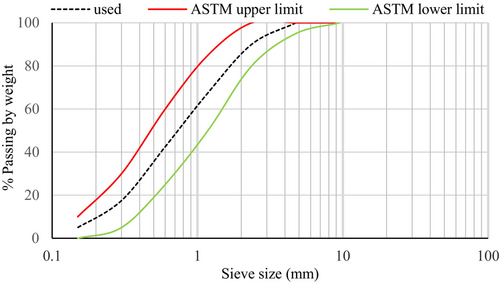
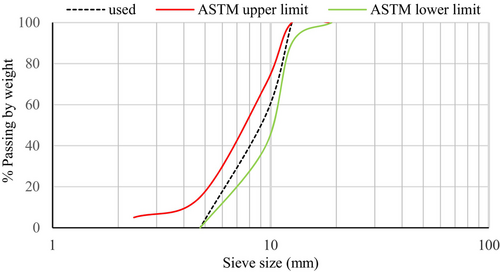
The main alkali-activated binder used in this study was GGBS, which was collected from Siam City Cement (Lanka) Limited. The unground GGBS was processed using a laboratory ball mill that was operated at a speed of 36 rpm in order to increase the fineness. The production rate of the GGBS powder was 5 kg per 16 h. A laser diffraction particle size analyzer determined that the median particle size (D50) of the ground slag was 6 μm. The specific gravity of the slag was measured to be 2.9. LOI was measured by heating GGBS in a muffle furnace at a temperature of 950°C for a maximum period of 1 h. Table 1 outlines the chemical composition of the GGBS that was assessed using X-ray fluorescence (XRF) spectrometry. The alkaline activator was prepared by combining analytical grades of NaOH pellets (98.5%–100.5% purity) and Na2CO3 (99.9% purity). The coarse aggregate was used in the saturated, surface-dry conditions. It was achieved by submerging the aggregate in water for a continuous 3-day period until all the particles were saturated, and the excess water was drained afterward.36 The aggregate was then gently surface dried using dry clothes and dried in the air until all the visible films of water were removed. The maximum size and the specific gravity of the coarse aggregate were 12 mm and 2.75, respectively. Natural river sand with a specific gravity of 2.65 was used as the fine aggregate. Grading coarse and fine aggregates was done as per ASTM C3337 and the particle size distribution curves (along with upper and lower grading limits) are illustrated in Figures 2 and 3.
| Oxide | CaO | SiO2 | Al2O3 | MgO | Fe2O3 | K2O | Na2O | SO3 | MnO | P2O5 | LOI |
|---|---|---|---|---|---|---|---|---|---|---|---|
| Percentage (%) | 40.39 | 35.35 | 12.19 | 6.18 | 0.75 | 0.3 | 1.09 | 0.1 | 0.13 | 0.05 | 1.4 |
2.1.2 Biochar
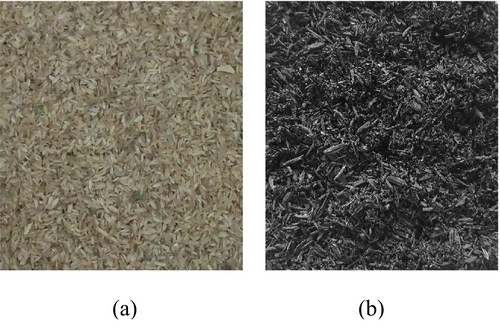
Biochar was prepared from rice husk (Figure 4) collected from Sri Lanka. The rice husk was washed fully with water to remove any impurities and oven-dried at 80°C for 48 h (until getting a constant mass) before subjecting it to pyrolysis.38 Fully filled crucibles with rice husk were sealed such that the air inside the crucible was minimal and placed inside a Yamato FO-310 muffle furnace.20, 39 The pyrolysis was carried out at 500°C. The selection of the biochar type and the pyrolysis temperature was based on the authors' previous study.9 The furnace was heated up to 500°C at a heating rate of 10°C/min, and after that, the temperature was maintained for 60 min (Figure 5). Hereafter, the biochar produced after rice husk pyrolysis is designated as RB. The RB was stored in a sealed container until the time of mixing.

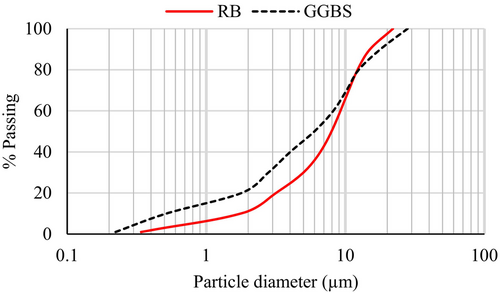
Before mixing with GGBS, biochar was ground using a ball mill and sieved through a 75-μm sieve. A laser diffraction particle size analyzer determined the median particle size of biochar (D50) to be 7.9 μm. The particle size range of RB used in this study was between 0.34 and 22.3 μm. The particle size distribution of RB (and GGBS) is illustrated in Figure 6.
2.2 Characterization of biochar
2.2.1 Morphology
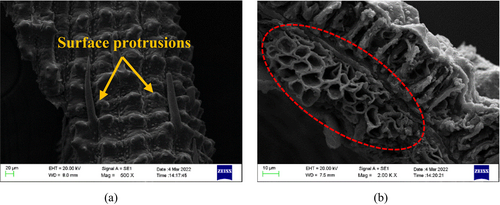
Figure 7 shows the morphology of RB that was determined by the scanning electron microscope. The rough texture of RB, along with the inherited surface protrusions from the feedstock, is shown in Figure 7a. The highlighted area in Figure 7b illustrates the cellular structure of RB, which might have been inherited from the parent biomass or created because of the release of organics and volatiles during the pyrolysis.
2.2.2 pH and absorption
The pH of RB was determined by mixing biochar and distilled water at a weight proportion of 1:10. Then, the solution was thoroughly mixed for 30 min and stabilized for 1 h before measuring the pH using a pH meter.40, 41 The pH value was found to be 8.02, indicating the basic nature of RB.
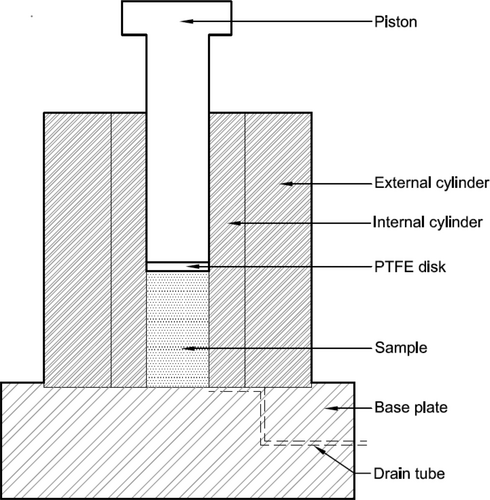
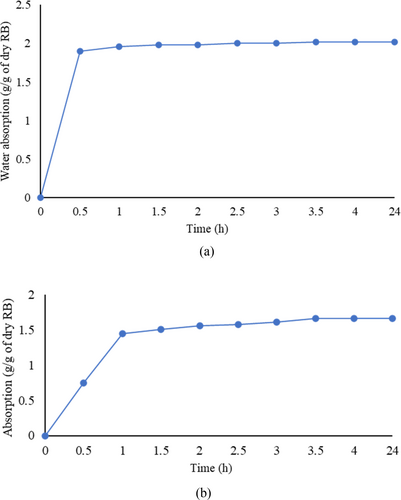
The “tea bag method” was used to calculate the absorption capacity of RB in water and the extracted pore solution of AAS (EPS-AAS).16, 28, 42 The measurement of the water absorption capacity of RB was as follows: A 5 g of RB was placed inside an empty tea bag, and it was fully submerged in water. Alongside, an empty tea bag was immersed to find out the amount of water absorbed by biochar only. The water intake was measured at regular time intervals until there was no difference in mass. A similar procedure was adopted to determine the absorption of RB in EPS-AAS; thus, RB was fully submerged in the EPS-AAS instead of water. The pore solution of the AAS paste was extracted using the most widely used technique, “pore solution expression”.43, 44 An AAS paste with a w/b of 0.5 was prepared (according to the procedure described in Section 2.3) and cast in cylindrical molds (50 × 100 mm). At the age of 3 days, each sample was placed inside a hollow steel cylinder where it was loosely fitted (Figure 8). A PTFE disk and the piston were placed on top of the sample. After that, the piston was loaded by placing the whole setup in a compressive strength testing machine. The pore solution was collected using a drain tube, as shown in Figure 8. A maximum pressure of 1000 MPa was applied to the piston, with a stress rate of 1.3 MPa/s. After reaching the maximum pressure of 1000 MPa, it was maintained for 15 min. The extracted pore solution was filtered through a cellulose filter (pore size 8 μm) and stored to be used for the absorption test.
2.2.3 X-ray diffraction and oxide composition
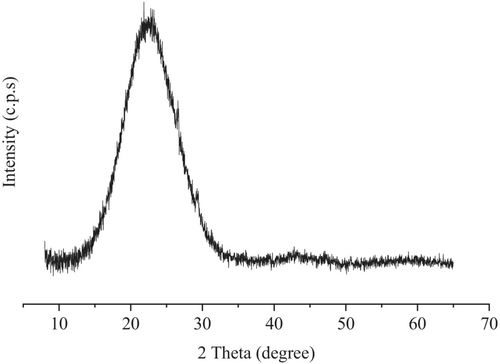
RB was well ground and sieved through a 75 μm sieve before subjecting it to XRD analysis using a BRUKER diffractometer model D2-PHASER. The obtained X-ray diffractogram of RB is shown in Figure 10. The amorphous nature of silica in RB can be identified by comparing the broad peak at 2ϴ = 220 of RB with the sharp and narrow peaks of quartz at the same diffraction angle reported in the literature.38, 47 A quantitative phase analysis of the RB was conducted by interpreting the XRD analysis results using Bruker-DIFFRAC. EVA software based on the reference intensity ratio (RIR) method (based on a data file of reference intensity ratios relative to an external standard).48, 49 The results are tabulated in Table 2. It reveals that the crystalline silica content of the RB was almost zero, further emphasizing the presence of amorphous silica in the RB. The chemical composition of RB in Table 3 shows that SiO2 is the main oxide composition available in RB. However, as the sum of SiO2, Al2O3, and Fe2O3 is 35.66 (<70%), RB cannot be categorized under class F pozzolans.50 Moreover, the X-ray diffractogram and oxide composition results reveal that the RB used in this study contains a low amount of amorphous silica in comparison with rice husk ash.51 LOI was measured by heating RB in a muffle furnace at two different temperatures. First, the RB was heated at 550°C for 5 h, and the loss on ignition at 550°C (LOI550) was found to be 58%. Afterward, the RB sample was heated at 950°C for 5 h, and the loss on ignition at 950°C (LOI950) was calculated to be 62%.52, 53 The organic carbon content of a material is considered to be about half of the LOI550 and the inorganic carbon content is 0.273 × LOI950.53 Thus, the approximate carbon content of RB is calculated to be 46% based on the LOI.
| Crystalline compound | % |
|---|---|
| Quartz | 0.79 |
| Albite | 5.39 |
| K-Feldspar | 11.71 |
| Anorthite | 3.59 |
| Illite | 3.54 |
| Calcite | 2.32 |
| Oxide composition (%) | RB |
|---|---|
| SiO2 | 35.61 |
| Al2O3 | 0.03 |
| Fe2O3 | 0.02 |
| CaO | 0.33 |
| MgO | 0.14 |
| K2O | 0.57 |
| Na2O | 0.05 |
| Cl | - |
| P2O5 | 0.1 |
| ZnO | - |
| Mn2O3 | 0.06 |
| LOI | 62 |
2.3 Mix proportion, mixing and curing
A total of 5 mixes with different RB supplementing levels by the weight of the binder (0%, 2%, 4%, 6%, and 8%) were cast, as shown in Table 4. The Na2O content by the weight of the binder (Na2O-E) and the Na2CO3 to NaOH molar ratio were fixed at 10% and 15:10, respectively. This was done based on the previous studies and the trial experiments.5, 6, 9, 54 Accordingly, the required Na2CO3 and NaOH dosages were calculated. In order to maintain a desirable workability level in all the mixes, the w/b was selected as 0.5. The total amount of water was considered to be the water produced from NaOH and the added water. On the basis of prior investigations, the coarse aggregate to total aggregate weight ratio was maintained at 0.57.36 The absolute volume method was used to determine the required proportions of coarse and fine aggregates.36 The details of mixture proportions and slump values are shown in Table 4. It is worth noting that increasing biochar levels reduced the flow drastically. Similar findings have been revealed by previous researches.9, 28, 42 This is attributed to the high absorption property of biochar.
| Mix No | RB (%) | Slag (kg/m3) | Biochar (kg/m3) | Activator (kg/m3) | Aggregates (kg/m3) | Water (kg/m3) | Slump (mm) | ||
|---|---|---|---|---|---|---|---|---|---|
| Na2CO3 | NaOH | Coarse | Fine | ||||||
| RB0 | 0 | 450 | 0 | 57.7 | 14.5 | 951 | 692 | 225 | 104 |
| RB2 | 2 | 441 | 9 | 57.7 | 14.5 | 951 | 692 | 225 | 101 |
| RB4 | 4 | 432 | 18 | 57.7 | 14.5 | 951 | 692 | 225 | 94 |
| RB6 | 6 | 423 | 27 | 57.7 | 14.5 | 951 | 692 | 225 | 72 |
| RB8 | 8 | 414 | 36 | 57.7 | 14.5 | 951 | 692 | 225 | 55 |
Na2CO3 and NaOH were pre-dissolved in distilled water for 2 h prior to the concrete mixing. It was because the dissolving action was highly exothermic.55 At first, coarse and fine aggregates were dry mixed for 2 min in a 120-L concrete mixer. Next, manually mixed slag and biochar were added to the mixer, and the mixing was continued for another 3 min. Finally, the activator solution was added and mixed for another 4 min.56 After completing the mixing, the concrete was cast in steel molds (cube – 100 × 100 × 100 mm and cylinder −150 × 300 mm)57 and placed on the vibrating table for a maximum of 1-min. The samples were then put into sealed plastic bags for 3 days before demolding and subsequently cured inside the bags until testing.
2.4 Test on hardened concrete
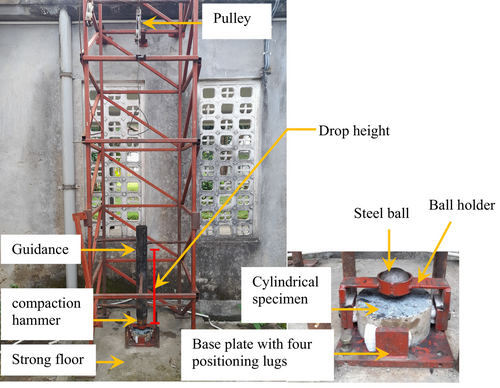
To determine the 28-day compressive strength, three 100-mm cubic specimens from each mix were cast. A 150 × 300 mm cylinder was cast for each concrete mixture, and after 28 days, it was cut into four 64-mm height discs. Three cylindrical specimens (discs) were subjected to the determination of the impact resistance. One cylindrical specimen was subjected to the drop-weight test until the first visible crack, and after that, the crack propagation, porosity, and number of voids were examined using a micro-CT scanning machine. The microstructure of the RB6 (which yielded the highest compressive strength and impact resistance) and biochar-free mix were examined through SEM.
2.4.1 Compressive strength
The 28-day compressive strength of each AASC mix was assessed using a MATEST-3000 kN compressive strength testing apparatus with a loading rate of 0.6 MPa/s. The test was performed in accordance with BS EN 12390–3.58 The average of 3 samples was considered the compressive strength of AASC.
2.4.2 Impact resistance
2.4.3 Scanning electron microscopy (SEM) analysis
The microstructure of the AASC mixes with 0% and 6% RB was examined at the age of 28 days using FEI Quanta 200 with an accelerating voltage of 30 kV employing secondary electrons. The samples were cut into a size of 10 mm in diameter and 10 mm in height using a diamond saw and mounted in epoxy resin. The top surface of the samples was polished manually with sandpapers (500, 800, and 1200 grid, respectively) to remove the remaining resin, then polished using a Struers polishing machine following concrete generic procedures. Subsequently, they were placed on the stubs using a double-sided conductive carbon tape and were coated with 5 –nm thick Iridium. An energy-dispersive X-ray spectroscopy (EDX) detector was employed to detect the elements, and analyzed by Aztec software.
2.4.4 Micro-CT scanning
This test was conducted using a Ge Phoenix V tome x s CT scanning machine. The scanning voltage and current were 180 kV and 60 μA. The pixel size of the micro-CT was 88 μm. The X-ray projections were recorded with a rotation increment of 0.18° within 360°. The scanning time was approximately 5 h. The obtained scans were analyzed using VG Studio Max software to gain microstructural images of the samples. For the void analysis, two cylindrical cores with a 20 mm diameter and a 20 mm height were selected to avoid the major cracks in the specimen, and the average is reported. The voids larger than 30 μm were only considered in the void analysis due to the imaging resolution.
3 RESULTS AND DISCUSSION
3.1 Compressive strength
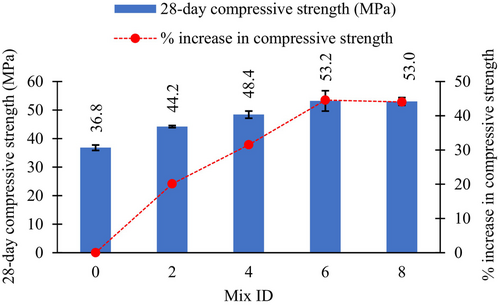
Figure 12 illustrates the compressive strength variations of the AASC mixes for the different biochar levels. Increasing the biochar content by 2%, 4%, and 6% enhanced the 28-day compressive strength by 20.1%, 31.5%, and 44.6%, respectively, compared with the biochar-free concrete sample. However, the increase in biochar level from 6% to 8% showed no improvement in the compressive strength. Thus, the biochar replacement level ranging between 4% and 6% was observed to be the optimum in terms of the 28-day compressive strength. Similarly, Zeidabadi et al.15 discovered a 20.4% increment in the 28-day compressive strength of OPC concrete with the addition of 5% RB, whereas 10% RB reduced the compressive strength. Furthermore, Egodagamage et al.9 found that increasing the RB dosage in AAS mortar from 1% to 5% improved the 28-day compressive strength by 5.9%. The author's previous study explored the effect of RB on the hydration of alkali-activated slag mortar by conducting XRD and FTIR analyses.9 The results revealed that the inclusion of RB in AAS does not alter the phase composition and the nature of the hydration products. In addition, a 29Si NMR analysis revealed that RB increases the reaction degree of slag by 14%, which results in an enhancement in the compressive strength.9 As RB is not a pozzolanic active material (SiO2 + Al2O3 + Fe2O3 < 70%)47 (Table 3), it improves the compressive strength in two ways: by reducing the capillary porosity and through internal curing.11, 16, 29 Porous RB (Figure 7b) tends to absorb a portion of the solution, reducing the solution/binder (S/B) ratio of the mix and resulting a significant reduction in the slump (Table 4). The reduction of the S/B lowers the evaporable water in the mix, which can create capillary pores.59 Reducing the capillary porosity results in a denser microstructure; thus, the compressive strength is increased.20, 28 Similarly, previous studies have revealed the ability of biochar to retain the absorbed water.11, 16, 17, 29 Choi et al.,17 measured the weight reduction of the mortar samples at different time intervals until 28 days, and they reported that the weight loss for the mortar mixes containing biochar over time due to moisture evaporation is less compared with the mortar mixes without biochar. This water retention property of biochar develops a moist environment, favoring the formation of the hydration products, resulting in an enhancement in the compressive strength.9, 20
3.2 Impact resistance
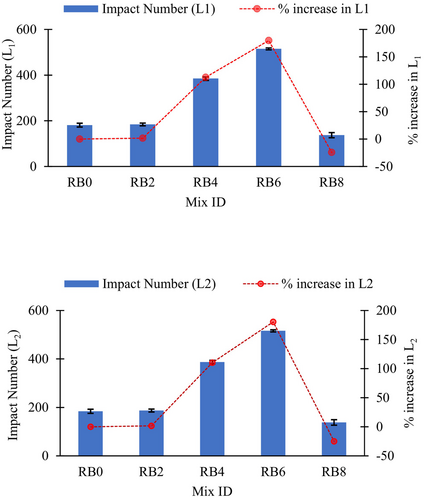
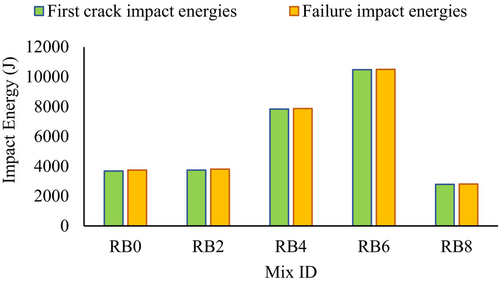
The impact resistance results of biochar-blended AASC at 28 days are listed in Table 5. It is presented in terms of the number of drops required to cause the first visible crack (L1) and the number of drops required for the failure (L2) of the concrete specimen. Figure 13 illustrates that increasing biochar content from 2% to 4% improved L1 from 184 to 385 (increased by 113% compared with biochar-free sample), while further increments of biochar level up to 6% enhanced L1 up to 515 (increased by 185% compared with the biochar-free sample). Similarly, L2 increased from 187 to 387 and 516, when the biochar level increased from 2% to 4% and 6%, respectively. It is worth noting that when the biochar dosage was 2%, the impact resistance was almost identical to that in the biochar-free sample. Moreover, the increment of biochar content from 6% to 8% reduced both L1 and L2 drastically. This reduction can be due to the brittleness introduced by the RB. Akinyemi et al.10 reported that using biochar at high dosages makes it easy to form cracks within the composite due to the brittleness of the biochar. Generally, less ductility, high compressive strength, and poor capacity to resist impact loads are features of brittle materials.60 Therefore, the low impact resistance (Figure 13) and high compressive strength (Figure 12) of the RB8 illustrate the enhanced brittleness of the composite. Figure 14 shows the change in impact energies of the AASC mixes with the increment of the biochar dosage. Based on the results, an optimum replacement level of RB is recommended, ranging between 4% and 6%, to achieve improved impact resistance. As anticipated, this increment in impact resistance is due to the densification effect caused by RB on the AASC. Similar explanations have been reported for different supplements in concrete, such as silica fume.24-26
| Mix No | Impact numbers (L1/L2) | L1 | L2 | Impact energies (J) | ||||
|---|---|---|---|---|---|---|---|---|
| Sample 1 | Sample 2 | Sample 3 | Mean | SD | SD | First crack | Failure | |
| RB0 | 171/174 | 185/188 | 186/189 | 181/184 | 8.4 | 8.4 | 3684 | 3745.1 |
| RB2 | 178/180 | 185/188 | 190/192 | 184/187 | 6 | 6.1 | 3745.1 | 3806.1 |
| RB4 | 377/380 | 392/394 | 386/388 | 385/387 | 7.5 | 7 | 7836.1 | 7876.8 |
| RB6 | 510/511 | 516/517 | 518/519 | 515/516 | 4.2 | 4.2 | 10482.1 | 10502.5 |
| RB8 | 131/132 | 130/131 | 150/151 | 137/138 | 11.3 | 11.3 | 2788.4 | 2808.8 |
- Abbreviation: SD, standard deviation.
3.3 Failure patterns
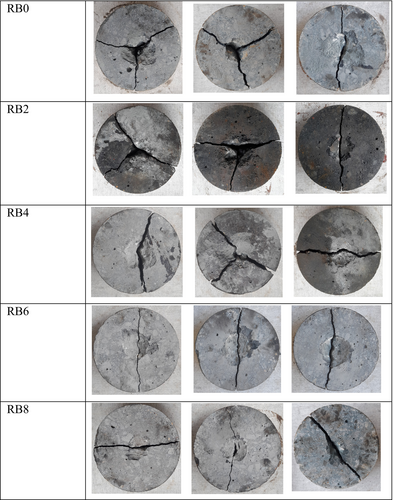
Figure 15 illustrates the failure patterns of the AASC samples subjected to the drop-weight test. All five mixes could not sustain more than three impacts after the initial cracking, and that indicates the brittle nature of the AASC material. With the increasing biochar dosage from 0% to 8%, the samples demonstrated an increasing trend to fracture along a single diagonal crack. This indicates an increment in the brittleness of the composite due to the increasing biochar content.10, 61 Also, it is agreeable with the low impact resistance results of the RB8 (Figure 13). Similarly, previous studies have demonstrated that when the brittleness of the material is reduced, the failure mechanism is transferred from a single diagonal crack to multiple diagonal cracks.25, 62-64
3.4 Microstructure: SEM Analysis
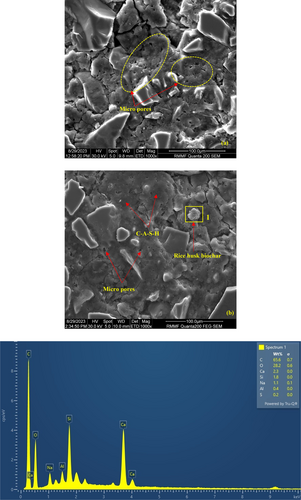
The microstructural properties of the two AASC samples with 6% RB (which was given the highest compressive and impact resistance) and 0% RB are illustrated in Figure 16. RB6 showed a dense microstructure with less micro pores in comparison to the control mix. Moreover, a continuous formation of the C-A-S-H gel with less disturbances was visible in the RB6 relative to the control mix. This dense microstructure resulted in an observed enhancement in the compressive strength (Figure 12) and impact resistance (Figure 13). Furthermore, an SEM/EDX analysis was conducted on the RB6 sample to examine the RB particles in the matrix. RB particles could be identified with a high C content (65.6%), which is an inherent characteristic of biochar.11, 13, 16, 38, 47, 65 Similarly, the approximate C content of RB calculated based on the LOI was as high as 46%. When comparing the minor elements detected on the RB surface with its initial chemical composition (Table 3), the increased Na content could be due to the retained alkaline activator by the RB.
3.5 Characterization of crack propagation by micro-CT
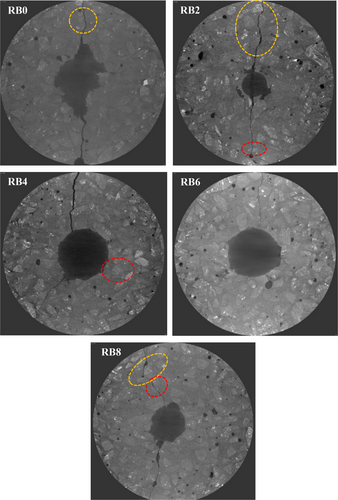
Figure 17 illustrates the impact surface of the five AASC samples (with different biochar levels) that were subjected to the drop impact test. It is visible that the cracks are strongly curved around the aggregates (highlighted with yellow dotted lines). Moreover, the majority of the cracks propagated close to the aggregates in the interfacial transition zones (ITZ), which is the weakest phase in concrete. However, occasionally, cracks propagated through the aggregates as well (highlighted with red dotted lines). It could be observed that the crack propagation is almost similar in all the samples. Thus, RB has not caused a significant effect on the crack propagation of the AASC.
3.6 Void structure analysis by micro-CT
The total porosity and total number of voids larger than 30 μm are tabulated in Table 6. The porosity of the AASC mixes with RB was higher than that of the AASC mixes without RB. A similar observation has been reported by Prabahar et al.42 This is due to the presence of voids in the biochar. However, a declining trend of porosity was observed with the increment of the RB percentage from 2% to 4% and 6%. This reduction in porosity is due to the densification effect caused by RB on the AASC. The decline in porosity with the inclusion of RB up to 6% was well in agreement with the compressive strength (Figure 12) and impact resistance results (Figure 13). As expected, the porosity increased from 2.28% to 3.17%, with the increase of the RB level from 6% to 8%. A similar trend was observed in the number of voids, and the results agreed with the porosity results.
| Mix No | Porosity (%) | Number of voids |
|---|---|---|
| RB0 | 0.24 | 15,294 |
| RB2 | 4.00 | 183,147 |
| RB4 | 3.37 | 154,301 |
| RB6 | 2.28 | 104,394 |
| RB8 | 3.17 | 145,144 |
4 CONCLUSIONS AND FUTURE WORK
- The supplementation of RB at 2%, 4%, and 6% in AASC caused 28-day compressive strength enhancements of 20.1%, 31.5%, and 44.6%, respectively, in contrast to the control mix. This was due to the biochar's ability to reduce the capillary porosity of the mix and impose an internal curing effect. However, the strength enhancement was not pronounced between 6% and 8% RB scenarios.
- The slump of the concrete was reduced with the increasing biochar content due to the high absorption characteristic of porous biochar.
- The supplementation of biochar to 6% had a significant influence on the impact resistance in AASC. The number of drops required at the drop hammer test for the first visible crack (L1) and the failure (L2) increased in the RB 6% mix by 185% and 175%, respectively, as opposed to the control mix. These improvements were attributed to the ability of biochar to densify the microstructure (Figure 16). Meanwhile, when the RB dosage was altered from 6% to 8%, the impact resistance drastically reduced due to the fact that the brittleness of the composite escalated at the high RB level. This particular judgment was evidenced by the increasing trend of the AASC samples to fracture along a single diagonal crack upon impact, with the increasing biochar dosage from 0% to 8% (Figure 15).
- Micro-CT scanning results revealed that RB did not cause a significant effect on the crack propagation of the AASC.
- High impact resistance is ideal for concrete structures exposed to impacts such as vehicular collisions, the falling of masses (e.g., road barriers, rock fall protection walls), and accidental impacts due to explosions. Hence, full-scale testing of the impact resistance of AASC is vital and a recommendable matter for future work. Similarly, recycled expanded polystyrene (EPS) is considered a good supplement in concrete to reach high energy absorption; however, the compressive strength is rather compromised. In that scenario, it could be interesting to explore the potential of the dual blending of biochar and EPS in AASC to develop a strong and impact-resilient product.
ACKNOWLEDGMENTS
This project is funded as part of the CRC-P on upcycling solutions for hazardous claddings and co-mingled waste (CRCPEIGHT000084). The assistance provided by Siam City Cement (Lanka) Limited and the Materials/Environmental Laboratories and Engineering Workshop of the Civil Engineering Department of the University of Peradeniya is also greatly acknowledged. Open access publishing facilitated by RMIT University, as part of the Wiley - RMIT University agreement via the Council of Australian University Librarians.
CONFLICT OF INTEREST STATEMENT
The authors declare that they have no conflict of interest.
Biographies

Harshani Egodagamage - PhD Student, School of Engineering, RMIT University, Melbourne, Australia. Email: [email protected].

Hiran Yapa - PhD, Professor, Department of Civil Engineering, Faculty of Engineering, University of Peradeniya, Sri Lanka. Email: [email protected].

Samith Buddika - PhD, Senior Lecturer, Department of Civil Engineering, Faculty of Engineering, University of Peradeniya, Sri Lanka. Email: [email protected].

Thomas Loh - PhD, School of Engineering, RMIT University, Melbourne, Australia. Email: [email protected].

Satheeskumar Navaratnam - PhD, Lecturer, School of Engineering, RMIT University, Melbourne, Australia. Email: [email protected].

Yulin Patrisia - PhD, School of Engineering, RMIT University, Melbourne, Australia. Email: [email protected].

Kate Nguyen - PhD, Associate Professor, Leader of Innovative Fire and Facade Engineering Group, School of Engineering, RMIT University, Melbourne, Australia. Email: [email protected].
Open Research
DATA AVAILABILITY STATEMENT
The research data are included within the article, and further data are available from the first and corresponding author upon request.


