(ReMoV)X2 (X = S, Se) Ternary Alloy Nanosheets for Enhanced Electrocatalytic Hydrogen Evolution Reaction
Abstract
Modulating the electronic structure of 2D transition metal dichalcogenides via alloying can extend their potential applications. In this study, composition-tuned ternary alloy nanosheets of (ReMoV)X2 (X = S and Se) are synthesized using solvothermal and colloidal reactions, respectively. Ternary alloying occurred with homogeneous atomic mixing over a wide range of compositions (xV = 0.16–0.80). Compared to (ReV)X2 binary alloying, ternary alloying produces a more metallic phase with less oxidation. Increasing xV induces a phase change into a more metallic 1T phase. The (ReMoV)S2 nanosheets demonstrate enhanced electrocatalytic activity toward the acidic hydrogen evolution reaction (HER) compared to (ReV)S2. Density functional theory calculations predict that ternary alloying increases the metallicity of the nanosheets. In addition, the Gibbs free energy calculation for hydrogen adsorption (ΔGH*) shows that ternary alloying effectively activates the basal S atoms for the HER, supporting the enhanced catalytic performance observed experimentally.
1 Introduction
The rapid growth of fossil fuel consumption has caused significant energy crisis and environmental pollution, necessitating the development of clean and renewable energy sources. Among alternative energy resources, H2 produces only water through its combustion and has the highest mass-energy density (142 MJ kg−1). The generation of H2 via electrocatalytic water splitting (2H2O → 2H2 + O2) is probably the most environmentally friendly technique, and therefore, a tremendous amount of research is being conducted all over the world. An important issue is developing efficient and cheap electrocatalysts for the cathodic hydrogen evolution reaction (HER) because the most efficient HER electrocatalysts so far require Pt, an expensive noble metal.
Transition metal dichalcogenides (TMDs) have recently attracted attention for catalytic HER.[1-6] TMDs are typical 2D layered materials with the chemical formula MX2, where M is a group V–VII transition metal and X = S or Se. Each layer in TMD comprises a sublayer of M atoms sandwiched between two sublayers of X atoms. Pristine TMDs have intrinsically low electrical conductivity, and their exposed X sublayers are not often very catalytically active.[1-3] These drawbacks are usually resolved by forming chalcogen vacancies, substitutional/adatom doping, metal/molecule ion intercalation, or alloying.[4-6] Enhanced electrocatalytic activity toward HER or CO2 reduction has been demonstrated for a number of binary metal-site alloy systems such as MoW,[7, 8] MoRe,[9-11] NbTa,[12] MoNb,[13] MoV,[14] NbV,[15] WV,[16] WNb,[17] WRe.[18] and ReV.[19, 20] Notably, ternary alloy nanosheets like (MoNbV)Se2 and (MoWV)Se2 via colloidal reaction have demonstrated a synergistic effect to improve the HER performance of constitutional binary alloys.[21, 22] The use of a large variety of components allows researchers to optimize the electronic structure of TMD alloys for the electrocatalytic reaction.
Semiconducting ReX2 nanosheets exhibit excellent (photo)electrocatalytic performance.[23-47] In a pioneering work, Yang et al. reported enhanced HER performance of (ReMo)S2 alloy monolayers at xMo (mole fraction of Mo) = 0.45 synthesized via chemical vapor deposition.[9] Our research group synthesized (ReMo)S2 and (ReMo)Se2 nanosheets by hydrothermal reactions, and the best HER performance occurred at xMo = 0.5 and 0.1, respectively, because of the more metallic phase than the ReX2.[10, 11] Lee et al. reported the colloidal synthesis of (WRe)S2 monolayers quantum dots with enhanced catalytic HER at xRe = 0.49.[18] Alloying with metallic VX2 can also improve the catalytic activity of ReX2. We reported the synthesis of (ReV)Se2 and (ReV)S2 nanosheets via colloidal and solvothermal reactions, respectively, showing an enhanced HER performance at xV = 0.2–0.8.[19, 20] By introducing one more component, (ReMoV)X2 nanosheets are expected to exhibit even better catalytic activity, but the related results have not been reported.
In this study, (ReMoV)S2 and (ReMoV)Se2 ternary alloy nanosheets were synthesized using solvothermal and colloidal reactions, respectively. Their composition was successfully tuned over a wide range (xRe = 0.10 – 0.5, xMo = 0.10 – 0.5, and xV = 0.16–0.8). Atomic-resolution scanning transmission electron microscopy (STEM) was employed to examine the crystal structure with the atomic distributions of metals. We analyzed thoroughly their electronic structures using X-ray photoelectron spectroscopy (XPS) and extended X-ray absorption fine structure (EXAFS). The electrocatalytic activity toward the HER in acidic electrolytes was studied for both the sulfide and selenide alloys, in comparison with the (ReV)X2 binary alloys. We also monitored the electronic structures during the HER using ex situ EXAFS. First-principles calculations were performed to predict the crystal structures, density of states, and Gibbs free energy (ΔGH*) of the ternary alloy nanosheets. The calculation results support the observed crystal/electronic structures as well as the HER performance of ternary alloys.
2 Results and Discussion
As depicted in Scheme 1a, (ReMoV)S2 and (ReMoV)Se2 alloy nanosheets were synthesized using solvothermal and colloidal reactions, respectively. The precursors were ammonium perrhenate (NH4ReO4), bis(acetylacetonato)dioxo molybdenum (VI) (MoO2(C5H7O2)2), and vanadyl acetylacetonate (VO(C5H7O2)2). The procedures are the same as those of (ReV)X2, except for adding the Mo precursor.[19, 20] Starting from the three unitary compositions ReX2, MoX2, and VX2, we prepared 10 samples of sulfide alloys with xRe = 0.10–0.5, xMo = 0.10–0.5, and xV = 0.16–0.8, as shown in the ternary diagram of Scheme 1b. For comparison, thermally annealed samples were also prepared by heating the as-grown samples at 400 °C. Eight selenide alloys were also synthesized with xRe = 0.10–0.5, xMo = 0.10–0.5, and xV = 0.25–0.75, as shown in the ternary diagram of Scheme 1c. In the rest of the paper, the sulfide and selenide samples are sometimes referred to as “aS” and “bSe” (a = 1–10, b = 1–8), respectively. The ternary compositions may also be denoted as (ReMo)1-xVxX2 to highlight the V composition (xV).
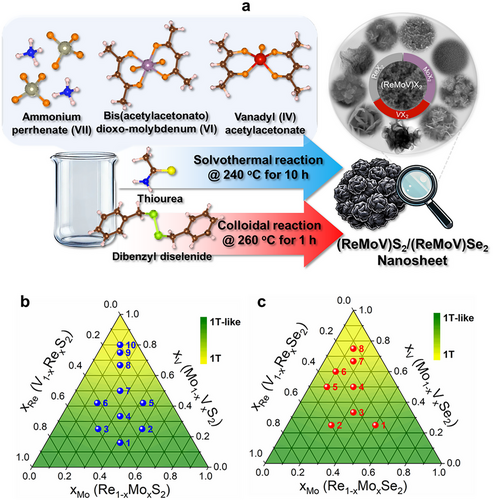
Figure 1a shows the scanning electron microscopy (SEM) and high-resolution transmission electron microscopy (HRTEM) images for 4S and 3Se (xRe = xMo = xV = 0.33). The layered nanosheets aggregated into flower-like nanoparticles (nanoflowers). Figures S1 and S2 (Supporting Information) show the SEM and HRTEM images of other sulfide and selenide samples, respectively. The ReX2 nanosheets comprised 2–5 layers (thickness: ≈2 nm) that aggregated into nanoflowers with a size of ≈100 nm. By contrast, the thickness and size of the VX2 nanosheets were ≈10 and 200 nm, respectively. The MoS2 nanosheets (thickness: 2–5 nm) aggregated to form random-sized nanoflowers (30–50 nm), whereas the MoSe2 nanosheets had a thickness of ≈2 nm and were bundled into nanoflowers ≈100 nm in size. After alloying, the size of the nanoflowers decreased to less than 50 nm. The interlayer distance (d001) of sulfide nanosheets was in a wider range and larger (≈10 Å) than that of selenide nanosheets (≈6 Å).
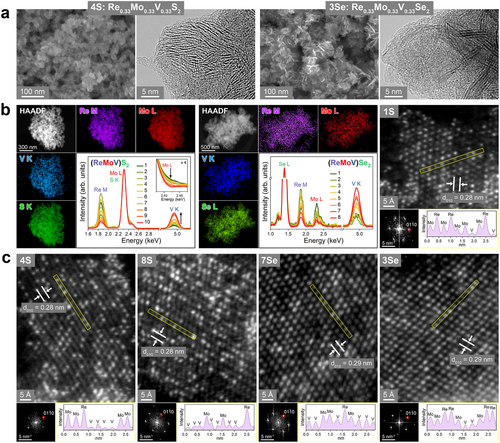
Energy-dispersive X-ray spectroscopy (EDX) data verified the successful composition tuning and homogeneous distribution of Re, Mo, V, and S (or Se) (see Figures S1 and S2, Supporting Information). EDX elemental mapping and the corresponding high-angle annular dark-field (HAADF) STEM images of 4S and 3Se are shown in Figure 1b. In the normalized EDX spectra, the relative intensities of Re, Mo, and V peaks changed throughout the series. The composition of each sample matched that of the precursor (Table S1, Supporting Information). Seven of the sulfide samples (1S–7S) have zero S vacancy (defined as CVX = 1- , where X = S or Se), and 8S–10S have 3%–6% (see Table S1, Supporting Information). The ternary alloys in either the as-grown or annealed conditions had smaller CVS than that of Re1-xVxS2.[20] By contrast, the selenide samples contained 4%–8% Se vacancies, which was comparable to that of Re1-xVxSe2.[19] These results consistently showed that the chalcogen vacancies increased with increasing xV. We have previously proposed a model for this, in which the slower reaction of VX2 produced X vacancies by forming V─O bonds.[19, 20]
Figure 1c shows the atomic-resolution HAADF STEM images of four sulfide samples 1S (xRe = 0.42, xMo = 0.42, xV = 0.16), 4S (0.33, 0.33, 0.33), 8S (0.167, 0.167, 0.67) and two selenide samples 3Se (0.33, 0.33, 0.33) and 7Se (0.167, 0.167, 0.67). The S atoms (Z = 16) were not clearly identified because of the brighter Re (Z = 75), Mo (Z = 41), and V (Z = 23) atoms. The darker regions corresponding to the VX2 sites become dominant at higher xV. The 1T structure is obviously the major one in both the sulfide and selenide alloys. The corresponding fast Fourier transform (FFT) image shows the [010] reflection spots of the 1T-like phase. The FFT image provides d010 = 2.8 Å for sulfide and 2.9 Å for selenide, corresponding to the lattice constant a = 3.24 and 3.35 Å, respectively, which are close to the reference value of VS2 and VSe2, as discussed later. The line profiles along the marked area support the homogeneous mixing of Re, Mo, and V atoms, and the increased number of V sites with increasing xV.
The crystal phases of the ternary alloys were examined using XRD. Figure 2a shows the data for ReS2, MoS2, VS2, and their ternary alloys. All samples showed a peak at 2θ = 9°, indicating that dL was ≈10 Å. The lattice constants of ReX2, MoX2, and VS2 were determined using spin-polarized density functional theory (DFT) calculations, as listed in Table S2 (Supporting Information). The data of ReS2 matched those of 1T″ phase, with (a, b, c) = (6.49, 6.39, 10.35) Å and (α, β, γ) = (105.10°, 91.82°, 118.82°). Except for the c value, all others are similar to those of JCPDS No. 24–0922; (a, b, c) = (6.455, 6.362, 6.401) Å and (α, β, γ) = (154.04°, 91.60°, 118.97°). For MoS2, the XRD peaks were matched to those of the 1T′ phase with c = 9.8 Å, based on the calculated lattice constants of (a, b, c) = (6.56, 3.19, 5.88) Å and γ = 119°. The broad peak feature of ReS2 and MoS2 was similar. In the case of VS2, the peaks matched the 3R-stacking 1T (referred to as 3R-1T) phase with a = 3.23 Å and c = 29.2 Å (dL = 9.7 Å).[20] After heating the as-grown samples at 400 °C, dL returned to 6 Å (see Figure S3, Supporting Information). The 1T′ phase MoS2 and 3R-1T phase VS2 transformed into 2H MoS2 and V3S4/V5S8 phases, respectively. The expansion of dL was already discussed in the work of (ReV)S2, using the intercalation of molecular ions (e.g., hydrated NH4+ with an ionic radius of 3.31 Å).[20] Spin-polarizedDFT calculations were also performed to show that intercalation of NH3 or NH4+ can occur over the entire composition range to expand the interlayer distance, and it also stabilizes the 3R-1T phase VS2.[20]
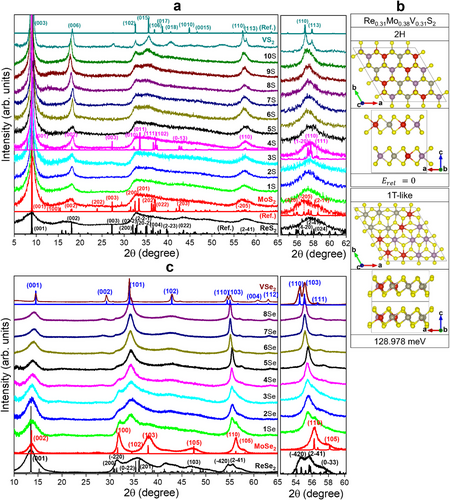
Samples 6S–10S show the peaks of 3R-1T VS2, e.g., (006)3R-1T at 2θ = 18.2°, (102)3R-1T at 2θ = 32.5°, and (015)3R-1T at 2θ = 35.4°. 10S exhibits a peak pattern closest to that of VS2. These XRD patterns suggest a phase transition to 3R-1T VS2 at xV = 0.42 (6S), similar to the case of Re1-xVxS2 (x = 0.5).[20] The right panel shows the magnified XRD peak at 2θ = 54°–62° for (2 1)1T′′ of ReS2, (05)1T′ of MoS2, and (110)3R-1T and (113)3R-1T of VS2. The ReS2, MoS2, and VS2 samples have similar lattice constant for the basal planes (a and b): a1T′′/2 (= 3.25 Å) and b1T′′/2 (= 3.20 Å) of ReS2, a1T′/2 (= 3.28 Å) and b1T′ (= 3.17 Å) of MoS2, and a3R (= 3.23 Å) of VS2. The negligible peak shift (Δ2θ = 0.4°) of alloy samples 1S–10S is due to the similar lattice constants of these three unitary phases.
We performed spin-polarized DFT calculations for the Re0.31Mo0.38V0.31S2 composition as a model for 4S (Re:Mo:V = 1:1:1) to understand the crystal phases of the alloys. The (4 × 4 × 1) supercell monolayers (48 atoms) were stacked infinitely; however, interlayer intercalation was not considered because of the complexity. For the V atoms, the effective Hubbard U parameter (Ueff) was set to 1 eV to correlate the localized d electrons. In our previous work, we showed that Ueff = 1 eV led to a better agreement with our experimental lattice constant of VSe2 than Ueff = 3 eV.[20] Both 2H- and 1T-like phases were considered for various configurations, as shown in Figure S4 (Supporting Information). The lattice parameters and the total and relative energies are summarized in Table S2 (Supporting Information).
Figure 2b shows the most stable configurations of the 2H and 1T-like phases. They comprise randomly dispersed Re, Mo, and V atoms, which are consistent with the STEM images. The lattice constants of the 1T-like structure are (a, b, c) = (3.23, 3.24, 5.93) Å and (α, β, γ) = (89.72°, 90.66°, 120.18°). Because a ≈ b, α ≈ β ≈ 90°, and γ ≈ 120°, this structure is closer to that of the 1T phase than that of 1T″ or 1T′. In the 1T″ and 1T′ phases, the metal−metal distance alternates along the a/b-axes and a-axis, respectively. In the ternary alloy, there exist only locally asymmetric metal–metal distances with almost no bond alternation, and thus the metal–metal distance was closer to that of the 1T phase (so we referred to it as 1T-like). The 2H structure (a = 3.14 Å and c = 12.35 Å) is more stable than the 1Τ-like structure by 128.978 meV per atom. We plotted the calculated XRD pattern using the lattice constants of the 1T-like structure with an expanded c = 9.8 Å (see Figure 2a). The experimental XRD peaks of 4S agree well with the calculated ones, indicating that the ternary samples prefer the 1T-like structure, which is also consistent with the STEM images.
The XRD patterns of the selenide samples are shown in Figure 2c. The peaks of ReSe2 matched the 1T″ phase ReSe2 with (a, b, c) = (6.716 Å, 6.602 Å, 6.90 Å) and (α, β, γ) = (104.15°, 91.82°, 118.15), close to the calculated ones. These values are close to those of the reference (JCPDS No. 74–0611, P̄1, a = 6.716 Å, b = 6.602 Å, c = 6.728 Å, α = 104.90°, β = 91.820°, γ = 118.94°). MoSe2 was in the 2H phase with (a, c) = (3.287 Å, 12.925 Å), corresponding to JCPDS No. 29–0914 (P63/mmc). The peaks of 1T phase VSe2 matched to the reference (JCPDS No. 89–1641; P3_m1) with (a, c) = (3.3587 Å, 6.1075 Å). The dL value of ReSe2 and MoSe2 is 6.5 Å, while that of VSe2 is 6.1 Å. As the sample number increases, the (001) peak shifts gradually from 2θ = 13.7° to 14.2°, indicating a decrease of dL due to the phase transition to 1T VSe2.
The right panel displays the magnified patterns at 2θ = 52°–62°, showing that the peak becomes sharper after 4Se (xV = 0.5). This peak shifts from 2θ = 55.5° to 55.1° with increasing xV. The expansion of the basal lattice constants is due to the phase transition to 1T VSe2. Therefore, the phase transition to 1T VSe2 probably occurs at xV = 0.5 (4Se), similar to the 1T″ → 1T phase transition of Re1-xVxSe2 that occurs at x = 0.5.[19] All alloy samples show the 1T phase peak at 2θ = 34°, which cannot be assigned to either 1T′′ ReSe2 or 2H MoSe2. Similar to the sulfide series, the selenide series probably has a 1T-like structure, which is supported by the STEM images. Therefore, as xV increases, both the sulfide and selenide alloys undergo a transition from the 1T-like to 1T VX2 phase. The favorable formation of the 1T-like phase in the experiment is probably related to the kinetically controlled solution reaction.
The whole XPS results are shown in Figure S5 (Supporting Information). Figure 3a presents the Re 4f, Mo 3d, and V 2p spectra of the (ReMoV)S2 alloys and the corresponding unitary samples. The Re 4f peaks correspond to Re-S bonding structures. The alloys exhibited a more redshifted peak than ReS2, probably owing to the higher metallicity of the 1T-like phase than the semiconducting 1T″ phase ReS2. As the sample number increases, the Re peaks redshift continuously, indicating a more metallic nature at higher V compositions. The redshift (41.1 eV at xV = 0.8) is more significant than that (41.4 eV at xV = 0.8) of binary counterparts, indicating more metallic properties than the binary alloys.[20] The Mo 3d peaks were resolved into the M1 and M2 bands that correspond to Mo─S bonds and defects, respectively. The S 1s peak appears at 226.5 eV, which is redshifted from that of S0 at 228.0 eV. As xV increases, the M1 band of Mo 3d5/2 redshifts from 229.0 eV (metallic 1T′ phase MoS2 and 1S) to 228.8 eV (10S), indicating the increased metallicity at higher xV. The V 2p peaks were resolved into the V1 (V─S bond with V4+) and V2 (V─O bond with V5+) bands; V1 (at 514 eV) and V2 (at 517–518 eV) bands for the V 2p3/2 peak. In samples 1S and 2S, the band at 519 eV is ascribed to Re 4p1/2 because of the higher Re compositions. As the sample number increases, the fraction of the V2 band increases. For VS2, the V1 band almost disappears. We calculated the oxidation number of V atoms using the ratio of V1 and V2 bands and found that it increases from 4.3 (1S) to 4.5 (10S). In the case of Re1-xVxS2, this value is 4.5–4.7. Therefore, sample oxidation is reduced in the ternary alloy samples. The XPS data of (ReMoV)Se2 alloys showed features similar to those of (ReMoV)S2 (Figure S5, Supporting Information). The oxidation number of V atoms is lower for the ternary alloy samples than for their Re1-xVxSe2 binary counterparts.
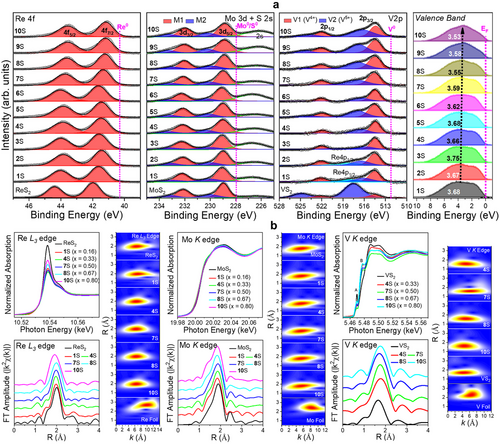
The rightmost panel of Figure 3a corresponds to the valence band spectrum (VBS) of the ternary sulfide alloys. The onset of the VBS can be used to predict the valence band maximum (VBM) below the Fermi energy level (EF), which corresponds to zero binding energy. All the samples showed VBM = 0 eV owing to the metallic phase. Band integration of the VBS from 0 to 10 eV provided the d-band center (ɛd). The ɛd value shifted slightly toward EF (−3.7 eV → −3.5 eV vs EF) with increasing xV. The ternary alloys exhibited smaller (negative) ɛd values compared to Re1-xVxS2 (–4.2 − –3.8 eV), indicating a more metallic character (Figure S5, Supporting Information). Ternary alloying of selenide also lifted the ɛd value (–3.3 − –3.2 eV) toward EF, where Re1-xVxSe2 has ɛd = –3.8 − –3.2 eV, with VBM = 0 eV. The XPS analysis results are summarized as follows. Metallicity increased with xV, similar to that of the Re1-xVxX2 binary alloys. The ternary alloy nanosheets are more metallic and less oxidized than the binary alloys.
Figure 3b shows the EXAFS above the Re L3-edge, Mo K-edge, and V-K edge for ReS2, MoS2, VS2, and their ternary alloy samples. The corresponding k- and R-space wavelet-transform (WT) EXAFS spectra are also plotted with the data for Re, Mo, and V foils for comparison. In the X-ray absorption near edge structure (XANES) of Re and Mo, the alloy samples exhibited a lower intensity of the white line than their unitary counterparts, which is correlated with their more metallic character. As xV increases to 0.5 (sample 7S), the intensity of Re L3-edge and Mo K-edge decreases, indicating an increase in metallicity. The increased intensity at xV = 0.8 could be due to the depleted electron density by oxidation. In the XANES of V K-edge, two pre-edge peaks appear at 5.47 keV (marked by A, originated from 1s → 3d transition) and 5.48 keV (marked by B, 1s → 4s-4p hybrid orbitals). Compared to VS2, the alloy samples exhibited a reduced intensity of the A peak, probably owing to the larger number of electrons occupying the 3d orbitals of the more metallic alloys. The increased intensity of the B peak can be explained by better structural symmetry due to less oxidation.
The Fourier-transform extended XAFS (FT EXAFS) results show the metal–S bonding peaks. The Re-S and Mo-S peaks showed lower intensities than those of the unitary samples, probably owing to their reduced number of bonds and lower crystallinity. By contrast, the higher intensity of the V-S peak resulted from lower oxidation, which increased the number of V─S bonds. Figure S6 and Table S3 (Supporting Information) summarize the fitting curves and fitted values, respectively. The value of dRe-S decreases from 2.39 Å in ReS2 to 2.38 Å in 10S, and the average value of dMo-S is 2.41 Å for all compositions. The WT EXAFS data showed no shift of the Re-S peak at k = 6.5 Å and the Mo-S peak at k = 5 Å, suggesting negligible changes in electronic structures at the Re and Mo sites, respectively. In the alloy samples, dV-S is ≈2.32 Å, whereas that in VS2 is 2.29 Å. In the k-space of WT EXAFS, samples 4S and 7S show the V-S peak at 5–6 Å−1, which is shifted from that of 10S and VS2 at 4 Å−1. Because the S atom is heavier than the O atom, it induces a large scattering amplitude at high k. Hence, this peak shift is ascribed to lower oxidation, which is consistent with the larger dV-S value.
Table S4 (Supporting Information) summarizes the electrocatalytic parameters of the ternary alloy and unitary samples toward the HER in an acidic electrolyte (0.5 M H2SO4). Figure 4a displays linear sweep voltammetry (LSV) curves of the sulfide samples ((ReMoV)S2), namely the current density (J) plotted as a function of the applied potential (vs reversible hydrogen electrode (RHE)). The applied potential is equal to the overpotential (η), and η at J = 10 mA cm−2 is denoted as ηJ = 10. All alloy samples have lower ηJ = 10 values (104–138 mV) than those of ReS2 (144 mV), MoS2 (172 mV), and VS2 (161 mV) (see Figure S7, Supporting Information). In Figure 4b, the Tafel plot (η vs log J) provided the Tafel slope (b) by a linear fit. Most of the alloy samples exhibited lower b values (53–76 mV dec−1) than those of ReS2 (103 mV dec−1), MoS2 (54 mV dec−1), and VS2 (77 mV dec−1). As a reference, we also measured the ηJ = 10 and b values of commercial 20 wt.% Pt/C to be 17 mV and 30 mV dec−1, respectively. The best HER performance was observed for sample 8S (xV = 0.67) with ηJ = 10 = 104 mV. The enhancement effect of alloying is consistent with previous observations of (MoNbV)Se2 and (MoWV)Se2 ternary alloys and many binary alloys (see Table S5, Supporting Information).[7-22]
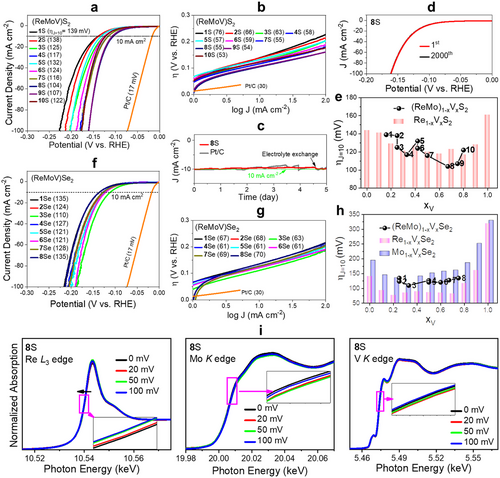
The charge transfer resistance (Rct) and double-layer capacitance (Cdl) were measured using electrochemical impedance spectroscopy and cyclovoltammetry (Figures S8 and S9, Supporting Information, respectively). The Rct and Cdl values showed a good correlation with the LSV data. Therefore, the enhanced HER performance of the ternary alloys is due to more efficient charge transfer and larger double-layer capacitance. The electrochemically active surface area (ECSA) was estimated using Cdl, as described in the Supporting Information (Experimental Section). In Figure S7 (Supporting Information), the LSV data were plotted using JECSA (defined as J divided by ECSA), showing the enhanced HER performance of ternary alloys compared to ReS2 and MoS2. The ternary alloying with xV = 0.6–0.8 (samples 8S and 9S) is consistently most effective in enhancing the HER performance. The chronoamperometry (CA) data of the best sample 8S show negligible current attenuation at ηJ = 10 after 5 days, which is like Pt/C (Figure 4d). The current level recovered when a fresh electrolyte was used after 4.6 days, indicating that the current decrease came from the pH change. The LSV curve after the 2000th scan showed negligible change (Figure 4e). The XRD, EDX, and XPS data confirmed that both the crystal structure and composition were retained after the CA test (Figure S10, Supporting Information). Furthermore, we evaluated the Faradaic yield (FY) and turnover frequency (TOF) at η = 0.15 V as described in the Supporting Information. The TOF value was estimated as 0.017 H2 s−1 based on FY = 96% (Supporting Information).
In Figure 4e, the ηJ = 10 value as a function of xV is overlaid on the data for Re1-xVxS2.[20] As xV increases, the HER performance is enhanced owing to the increased metallicity. However, due to sample oxidation at higher xV, the best HER performance was probably observed for sample 8S. The ternary alloys at xV = 0.67 (sample 8S) and 0.75 (sample 9S with ηJ = 10 = 107 mV) have lower ηJ = 10 than the values of Re1-xVxS2 (117–128 mV at xV = 0.6–0.8). At the same xV value, the Re-rich samples are always more HER-active than the Mo-rich ones;, i.e., ηJ = 10 = 138 and 125 mV for sample 2S (0.25, 0.5, 0.25) and 3S (0.50, 0.25, 0.25), and ηJ = 10 = 132 and 124 mV for samples 5S (0.16, 0.42, 0.42) and 6S (0.42, 0.16, 0.42), respectively. The HER performance data for the annealed binary/ternary samples are plotted in Figures S8,S9 and S11 (Supporting Information), showing a similar feature to that of as-grown samples. The d-band center (ɛd) theory has often been used to explain optimal HER performance.[48-50] As the ɛd of the catalyst shifts closer to EF (i.e., becomes less negative), the catalyst-H interaction becomes stronger owing to the more metallic character. As shown in Figure S5 (Supporting Information), the ɛd of the ternary alloys is closer to EF than that of the binary alloys, suggesting that the ternary alloying increased the metallicity than the binary alloys. Therefore, the alloying of (ReV)S2 with MoS2 enhanced the HER performance because of the increased metallicity.
Figure 4f shows the LSV curves of the (ReMoV)Se2 ternary alloy samples. All alloys exhibited ηJ = 10 = 110–136 mV. The Tafel slope b was 61–70 mV dec−1 (Figure 4g). Those values are lower than those of ReSe2 (141 mV and 67 mVdec−1), MoSe2 (130 mV and 73 mVdec−1), and VSe2 (320 mV and 103 mVdec−1), as shown in Figure S12 (Supporting Information), indicating the positive effects of the ternary alloying. The HER performance of selenide alloys was less dependent on the composition than that of the sulfide alloys. The Rct and Cdl values did not change significantly (Figures S8 and S9, Supporting Information). Figure 4h compares the ηJ = 10 values at different x for the (ReMo)1-xVxSe2, Re1-xVxSe2, and Mo1-xVxSe2 samples.[19, 14] These ternary alloy samples have a lower HER performance than the Re1-xVxSe2 samples, while they show much enhancement compared to Mo1-xVxSe2. Figure S12 (Supporting Information) shows the JECSA data for these (ReMoV)Se2 samples, consistently showing less enhancement effect than that of Re1-xVxSe2.
As shown in Figure S5 (Supporting Information), the ternary alloying shifts the ɛd values closer to EF than that binary alloying. According to Sabatier's rule, the catalytic performance is optimized when the interaction between H and the catalyst has an intermediate strength.[48-50] If ɛd is too negative or less negative, the catalyst-H interaction would be too weak or strong. Ternary alloying lowers ɛd to less negative values (–3.2−–3.3 eV), and thus, the interaction becomes stronger owing to excessive metallicity. Another possible model is based on the number of active sites. As we discussed in our previous work on Re1-xVxSe2, the Se vacancies on the Re atoms are the HER active sites.[19] The lower HER performance than that of Re1-xVxSe2 is due to the decreased concentration of active Re sites via the alloying with MoSe2. The higher HER performance than that of Mo1-xVxSe2 is due to the increased concentration of active Re sites via the alloying with ReSe2.
Ex situ XAFS measurements were performed on sample 8S after applying an overpotential (0–100 mV) under the HER conditions to gain insight into the electronic structures around the metal atoms during the HER. Figure 4i shows the XANES above the Re L3-, Mo K-, and V K-edge. The Re L3-edge was redshifted as 𝜂 increased to 100 mV (see inset). The Mo and V peaks also showed redshifts as 𝜂 increased to 100 mV, but less significantly compared to the Re L3-edge. Nevertheless, all metal atoms became more metallic as 𝜂 increased. The FT EXAFS data with the fitting curves and fitted values are displayed in Figure S6 and Table S3 (Supporting Information). The interatomic distance of Re-S increased due to the reduction, while that of Mo-S and V-S changed very little. This suggests that the Re atoms improve more effectively the HER activity compared to the Mo atoms. This model can explain why the Re-rich samples are more HER active than the Mo-rich ones. Furthermore, the less active Mo sites also support our model for the less enhancement of (ReMoV)Se2 samples.
For the Re0.31Mo0.38V0.31S2 model, the total electronic density of states (TDOS) near the Fermi level (EF) was calculated, as shown in Figure 5a. The 1T-like Re0.31Mo0.38V0.31S2 ternary alloy exhibits a significant TDOS at EF, indicating metallicity. The 2H phase alloy is a semiconductor. For comparison, Figure 5a displayed the TDOS of binary alloys Re0.25V0.75S2, Re0.5V0.5S2, and Re0.25V0.75S2, which were reported in our previous work.[20] As xV increases, the TDOS at EF > 0 increases significantly, which could be related to the higher metallicity. Compared to the binary alloys with xV = 0.25 and 0.5, the ternary alloy at xV = 0.31 shows a higher TDOS at EF > 0. Therefore, the incorporation of MoS2 enhances the metallicity, which is consistent with the experimental results.
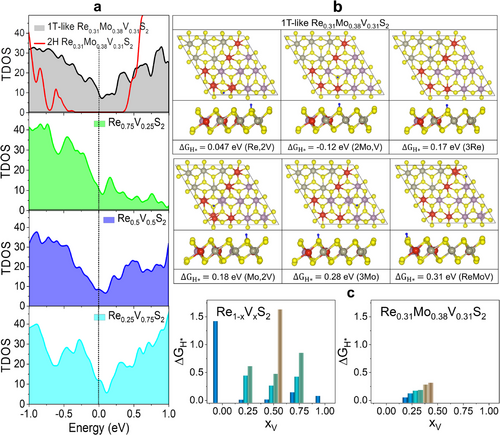
The Gibbs free energy change for H adsorption (|ΔGH*|) is a well-known parameter to predict the optimal HER activity using the condition of |ΔGH*| ≈ 0. For ReS2, the basal S atoms are not favorable for H adsorption (ΔGH* = 1.42 eV).[10, 20] The basal S atoms of 1T VS2 are HER active, in contrast, with ΔGH* = 0.072 eV.[20] In the case of VS2, significant oxidation reduces the HER performance. As shown in Figure 5b, alloying with 1T-like phase alloy activates six different S sites with ΔGH* = 0.047–0.31 eV. The S atoms coordinated with (Re, 2 V), (2Mo, V), (3Re), (Mo, 2V), (3Mo), and (ReMoV) are all HER-active. In the case of (ReV)S2 binary alloys, the S atoms coordinated with (3V) or (Re, 2V) are HER-active, but many of the S atoms coordinated with (3Re) or (2Re, V) are not.[20] The ΔGH* values are summarized in Figure 5c, suggesting that the ternary alloys possess more HER active sites than binary alloys, probably due to the more metallicity. Furthermore, the S site coordinated with Re has a higher HER activity than that coordinated with Mo: ΔGH* = 0.047 and 0.18 eV for (Re, 2V) and (Mo, 2V) coordination, and ΔGH* = 0.17 and 0.28 eV for (3Re) and (3Mo) coordination, respectively. This shows that compared to Mo, Re can more effectively activate the coordinated S atoms, which is consistent with the experimental results.
3 Conclusion
We synthesized (ReMoV)S2 ternary alloy nanosheets with full composition tuning using a solvothermal reaction and (ReMoV)Se2 nanosheets using a colloidal reaction. An increase of xV (from 0.16 to 0.80) induced a phase change into a metallic 1T phase. Atomically resolved STEM images revealed a homogeneous mixing of the three metals at the atomic scale in the 1T phase. Spin-polarized DFT calculations predicted consistently that ternary alloying produces the metallic 1T-like structure. The XPS and XAFS data that the alloying of (ReV)X2 with MoX2 produced a more metallic phase with less oxidation, and the d-band center (ɛd) more closely approached EF. As xV increases, the nanosheets become more metallic. The (ReMoV)S2 nanosheets exhibited enhanced HER catalytic activity in 0.5 m H2SO4, characterized by ηJ = 10 = 104 mV versus RHE at xV = 0.67. For the (ReMoV)Se2 nanosheets, less enhancement of HER was observed. The enhanced HER performance of (ReMoV)S2 was ascribed to the increased metallicity. Ex situ EXAFS data suggests that the metallicity of Re atoms improves the catalytic activity of (ReMoV)S2. The calculated ΔGH* showed that ternary alloying effectively optimized H adsorption on the basal S atoms, supporting the experimental HER data.
4 Experimental Section
Synthesis of (ReMoV)X2 Nanosheets
Ammonium perrhenate (NH4ReO4), Bis(acetylacetonato)dioxo molybdenum (VI) (MoO2(acac)2, MoO2(C5H7O2)2), vanadyl (IV) acetylacetonate (VO(acac)2, VO(C5H7O2)2) (total amount: 1 mmol) were prepared as metal precursors. For sulfide nanosheets, metal precursor and thioacetamide (CH3CSNH2, 8 mmol) were dissolved in 1-methyl-2-pyrrolidinone (10 mL) and reacted in a Teflon-lined stainless steel autoclave reactor at 240 °C for 12 h. For selenide nanosheets, metal precursor and 2 mmol of dibenzyl diselenide ((PhCH2)2Se2) were dissolved in 5 mL of oleylamine (OAm) and was degassed at 70 °C. 5 mL of oleylamine (OAm; C18H35NH2) in a three-necked flask was degassed and heated at 260 °C. The precursor solution (2 mL) was injected into the preheated OAm with an injection rate of 0.4 mL min−1 for 5 min, and the mixture was reacted for 1 h. After washing, the sulfide/selenide products were annealed in a quartz tube inside an electrically heated furnace under Ar flow at 400 °C for 1 h. Detailed experimental and calculation methods are provided in the Supporting Information.
Acknowledgements
J.I., J.Y.K., and I.H.K. contributed equally to this work. This study was supported by the National Research Foundation of Korea (NRF) grants funded by the Korean government (MSIT) (2020R1A2C2004392 and RS-2024-00412980), and the R&D program of Korea Basic Science Institute (No. C526111, C524200) supervised by MSIT. This work was also supported by the national supercomputing resources including technical support (KSC-2024-CRE-0187) from the Korea Institute of Science and Technology Information (KISTI). The authors would also like to thank Jeonju University for partial financial support.
Conflict of Interest
The authors declare no conflict of interest.
Open Research
Data Availability Statement
The data that support the findings of this study are available from the corresponding author upon reasonable request.


