Extracting Genetically-Imputed Causal Features From ECG Data
Funding: This work was supported by National Institutes of Health (NIH) grants R01AG065636, R01AG069895, RF1 AG067924, and U01AG073079, and by the Minnesota Supercomputing Institute.
ABSTRACT
Atrial fibrillation (AF), a cardiac arrhythmia characterized by an abnormal and rapid heartbeat, has the potential to develop into stroke, heart failure, and, ultimately, mortality. The electrocardiogram (ECG) is a pivotal tool in the diagnosis of AF, offering a quick, cost-effective, and non-invasive mean to record the heart's electrical activity. Recent studies are increasingly engaged in the implementation of deep learning techniques for ECG feature extraction for AF prediction. In addition, the application of Mendelian randomization (MR) methodologies has been investigated to identify causal associations between genetically imputed pre-defined ECG characteristics and cardiovascular diseases, such as AF. DeepFEIVR, a non-linear extension of the classical instrumental variable (IV) regression model, was designed with the objective of extracting disease-associated causal features from high-dimensional data, such as neuroimaging data. In this article, we applied DeepFEIVR as well as its variant (with residual inclusion), DeepFEIVR-RI, to the large UK Biobank dataset. The application of DeepFEIVR and DeepFEIVR-RI showed that the genetic components in ECGs could contribute to the development of AF statistically significantly (p values < ). Another contribution of this article is an extension to both DeepFEIVR and DeepFEIVR-RI to accommodate a large number of IVs. A comparison of results from DeepFEIVR and DeepFEIVR-RI, based on various choices of IVs, was conducted. Furthermore, we applied a recent algorithm called dnn-loc, enabling a visual examination on specific ECG components as extracted causal features for AF, thus advancing the understanding of the etiology of AF.
1 Introduction
Atrial fibrillation (AF), known as the most prevalent form of cardiac arrhythmia, is distinguished by fast and irregular heart rhythms [1, 2]. Epidemiological studies estimate that approximately 2% of the global population is affected by AF, with the prevalence of AF increasing to 10%–17% among those aged over 80 [3]. The clinical consequences of AF are substantial. Individuals with AF have a 5 times greater risk for stroke and a 3 times greater risk for death [3, 4]. The early diagnosis and proactive treatment of AF are important in mitigating these severe outcomes. However, approximately 27% of individuals with AF are asymptomatic, making their AF status frequently undetected [5]. The asymptomatic nature hinders the detection rate of AF; therefore, complicating the effective treatment of AF.
Pulse palpation and blood pressure tests are fast and economical screening tools for AF diagnosis, frequently serving as initial steps before a more definitive diagnosis [6, 7]. Electrocardiography (ECG) is the gold standard for the diagnosis of AF [7]. In data-based approaches for AF classification, they constructed interpretable features from ECG recordings and applied methodologies including support vector machine (SVM) and gradient boosting trees for the classification of AF [8, 9]. The interpretable features in these studies included summary statistics of the ECG recordings and durations of the QRS complex. Although pre-defined features are easy to interpret, their reliance on prior knowledge may neglect underlying details in ECG signals. Beyond interpretable data-based features, model-based features have become more commonly used. Signal processing techniques, such as wavelet transformations, along with time series models, such as autoregressive models, have been employed in extracting features from ECG recordings [10, 11]. The progression of deep learning has established a significant milestone in ECG classification and feature extraction. Within the framework of supervised learning, neural networks, such as deep convolutional neural networks (DCNN), bidirectional long short-term memory (BiLSTM) networks, inception networks, and residual networks, have been implemented to classify AF from ECG recordings [12-15]. In addition, unsupervised learning methodologies, including auto-encoders [16], variational auto-encoders [17], and contrastive learning such as patient contrastive learning of representations (PCLR) [18], have been applied to extract representative features from unlabeled ECG signals. These extracted features can subsequently be applied in transfer learning or other analytical tasks.
Despite considerable efforts directed toward the extraction of features from ECG recordings and other high-dimensional data, studies focusing on inferring the causality of the extracted features remain limited. A promising solution involves the initial extraction of features from ECG signals, followed by the implementation of causal inference tools, including univariate or multivariate instrumental variable regression. The application of two-stage least squares (2SLS) on interpretable ECG features has identified the causal influence of the variations in PR intervals on AF [19]. Furthermore, the causal association between genetically imputed spQRSTa in ECG signals and conditions including hypertrophic cardiomyopathy or idiopathic dilated cardiomyopathy was investigated using Mendelian randomization (MR) [20]. However, no evidence of causality was uncovered in the study. An alternative is to implement instrumental variable regression in a high-dimensional framework. DeepFEIVR [21] is such an approach, leveraging instrumental variable regression to directly extract causal features from high-dimensional data while maintaining the linear association between IVs and outcomes. It facilitates testing on the extracted causal features with only genome-wide association study (GWAS) summary statistics.
In this article, in addition to the application of DeepFEIVR, we propose a residual inclusion version of DeepFEIVR, named DeepFEIVR-RI, aiming at reducing the estimation variance as compared to DeepFEIVR. A detailed explanation of DeepFEIVR and its variant, DeepFEIVR-RI, is provided in Section 2. DeepFEIVR and DeepFEIVR-RI are designed to extract causal features from ECG data by employing genetic variants as IVs. The original version of DeepFEIVR was limited to considering only hundreds of IVs, which may not be enough for effective causal inference. To utilize a substantial number of single nucleotide polymorphisms (SNPs) as IVs, we consider assuming an independent relationship among IVs across linkage disequilibrium (LD) blocks or employing polygenic risk scores (PRS) within LD blocks as IVs to reduce the dimensionality. Subsequently, in Section 3, we focus on a comparative analysis of the results from the application of DeepFEIVR and DeepFEIVR-RI to the UK Biobank data [22] based on various IV choices. Section 4 is dedicated to the presentation of contribution maps, applying the dnn-locate [23] algorithm to analyze the relationships between ECG components and the outcome.
2 Materials and Methods
2.1 Causal Model
Since the confounder affects both (or ) and , ignoring the confounder and fitting in general leads to a biased estimate of the coefficient , as the new error term and the predictor are dependent. By inclusion of IVs in DeepFEIVR, can be instead estimated via , which eliminates terms containing the confounder. In addition, a notable benefit of DeepFEIVR is its capability to preserve the linear association between and . In a practical case involving the concerned outcome () and SNPs (as ), DeepFEIVR demonstrates its applicability to separate test data solely containing GWAS summary statistics.
2.2 DeepFEIVR
2.3 DeepFEIVR-RI
DeepFEIVR-RI extends the (linear) two-stage residual inclusion (2SRI) [24]. In contrast to the error term in Stage 2 of DeepFEIVR, the error term in DeepFEIVR-RI is reduced to after estimating with . Therefore, compared to DeepFEIVR, DeepFEIVR-RI may be able to improve prediction performance with the reduced variation of residuals, though it imposes an additional assumption that the residuals can sufficiently capture the hidden confounding.
2.4 Inference
2.5 Instrumental Variable Development
- Individual SNPs: SNPs in the UK Biobank with missing data rate exceeding 0.2 and minor allele frequency (MAF) below 0.01 are excluded. Subsequently, SNP clumping is implemented using a p value threshold of 0.01, a distance threshold of 250 kilobases (kb), and a linkage disequilibrium (LD) criterion . To simplify computation, we assume that IVs are independent if they are from different IV blocks.
- PRS-blks: PRS-blks are block-specific PRSs, constructed separately with only SNPs in each LD block utilizing PRS-cs [26], leveraging summary statistics from an AF GWAS. The data used in the AF GWAS should be independent of data in training and testing for DeepFEIVR and DeepFEIVR-RI.
Before applying DeepFEIVR or DeepFEIVR-RI, we first pre-train the network (without projection and residual inclusion parts) on an ECG AF classification task using the training subset. For both types of IVs, individual SNPs and PRS-blks, we select IVs as those marginally associated with the network extracted features without projection (using a p value threshold of 0.05 in the F-test).
2.6 DeepFEIVR-RI-CA
2.7 Data
2.7.1 UK Biobank and FinnGen Data
We used data from the UK Biobank to analyze the causal effect of ECGs on AF. The UK Biobank includes approximately 500,000 individuals from 22 centers in the United Kingdom, recruited starting from 2006 [22]. More information about the UK Biobank can be found on www.ukbiobank.ac.uk. After screening the individuals with AF status and good-quality ECG recordings and SNPs, we applied our models (DeepFEIVR and DeepFEIVR-RI) to 44,662 British white individuals in visit instance 2 (beginning 2014). The individuals with good quality of SNPs are defined by the UK Biobank data field 22020, from which related individuals up to the 3rd degree are removed. The number and proportion of AF cases are 1,801 and 4.03%, respectively. These individuals possess SNPs (as IVs ), ECGs (as the high-dimensional treatment/exposure ), and AF status (as the outcome ) concurrently. AF status is defined as a combination of self-reported AF from all four visits (starting from 2006, data field 20002 in the UK Biobank) and hospital diagnoses of AF (ranging from 1992 to 2022, data field 41270 in the UK Biobank).
To test the statistical significance of extracted features, we used AF GWAS summary statistics from FinnGen, a collaborated study involving Finnish biobanks, academic organizations, and global corporate collaborators [27]. In the FinnGen study, the age ranges from 18 to 90 with a median of 63. of individuals in the FinnGen study belong to the Finnish ancestry. The AF GWAS summary statistics of the FinnGen study were computed based on 45,766 AF cases and 191,924 controls. The proportion of AF cases in the FinnGen study is , which is higher than that in the UK Biobank (). In the real data analysis, we used both the individual-level test set in the UK Biobank and AF summary statistics in the FinnGen study for independent validation.
2.7.2 Data Preprocessing
2.7.2.1 ECG Data
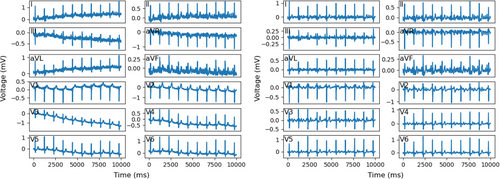
In this study, we utilized 12-lead resting ECG recordings in the UK Biobank for individuals in a calm situation. Each ECG recording was collected within 10 s with a sampling frequency of 500 Hz, resulting in a data dimension of . To mitigate issues of severe baseline wandering and heavy noise in the ECG signals, we implemented Daubechies 3 Wavelet transform [28] and extracted the 4th, 5th and 6th signals from ECG signals after transformation. A comparison of ECGs before and after this preprocessing approach is illustrated in Figure 1.
2.7.2.2 SNP Data
Regarding individual SNPs, an entirety of 2,339 SNPs were selected by screening and clumping as mentioned in Section 2.5. In training, instead of calculating the projection matrix across all individual SNPs, we subdivided these SNPs into 877 blocks. This block partitioning was pre-defined in the work of Berisa and Pickrell [29], dividing whole genome into 1,703 blocks and 877 of them contain selected individual SNPs. In addition, we assume SNPs across different blocks are independent. For SNPs within the -th block, denoted as , we calculated the block-specific projection matrix. Subsequently, we aggregated the projection matrices from all blocks by . Based on available SNPs in each block, we constructed block-based PRS (PRS-blk) using the PRS-cs algorithm with AF summary statistics derived from approximately 310,000 individuals in the UK Biobank with an LD reference panel from European individuals in the 1000 Genomes Project [30]. These individuals in the UK Biobank are distinct from those used for training, validating and testing DeepFEIVR or DeepFEIVR-RI. They possess high-quality genetic data and AF status, but lack ECG data. The proportions of AF cases in two datasets (for AF GWAS summary statistics and for training and inference) are 7.68% and 4.03%, respectively. The difference may be due to that some participants in the UK Biobank left the study and their ECG data were not collected in visit instance 2. The characteristics of covariates including age, gender and handedness are presented in Table 1. Among 1,703 PRS-blks, 271 of them are associated with extracted features in the AF classification task and selected as IVs.
| GWAS | Training/val/test | |
|---|---|---|
| Age (mean) | 57.10 | 54.92 |
| Gender (Prop. of male) | 45.77% | 49.40% |
| Right-handed (Prop.) | 88.69% | 88.74% |
| Left-handed (Prop.) | 9.65% | 9.71% |
| Both-handed (Prop.) | 1.65% | 1.54% |
3 Results
3.1 Main Results
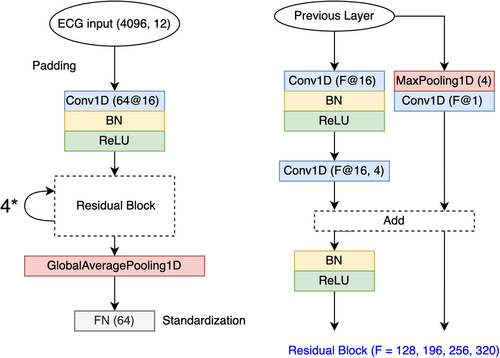
The dataset was partitioned into training, validation, and testing subsets with a split ratio of 80%, 10%, and 10%. The architectures of DeepFEIVR and DeepFEIVR-RI are illustrated in Figures 2 and 3, in which is derived from a residual network in Ribeiro et al. [14]. The network in this AF classification task was initialized by model weights provided in an unsupervised ECG study [18], and we converted the original ECG recordings of dimension in the UK Biobank to that of through interpolation for the compatibility with the model provided in this unsupervised study. For training DeepFEIVR and DeepFEIVR-RI, we used the Adam algorithm for optimization. Each batch consists of 320 individuals randomly chosen from the training subset. Due to the extreme imbalance of the two classes (with only 4% AF cases in the training set), we assigned weights of 0.96 to AF cases and 0.04 to controls. In training DeepFEIVR and DeepFEIVR-RI using PRS-blks as IVs, we did not standardize IVs because the scale of IVs measures their potential effects on AF. The number of extracted features was set to be 64, which is a hyper-parameter that can be tuned. We selected the number 64 after experimenting with a set of candidates {32, 64}. According to simulation results in Yao et al. [21], the number of extracted features had a minor impact on the results. When covariates were considered, we used age, gender and handedness as covariates, in which handedness was coded into three binary predictors: left-handed or not, right-handed or not, and both-handed or not. Those with unknown handedness were coded as (0,0,0) for the three binary predictors.
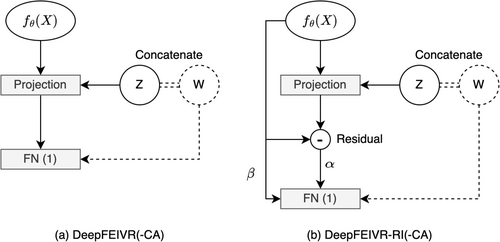
When covariates were not considered, upon obtaining the estimates of and , we utilized the entire training set for the estimation of . To evaluate and compare the performance, we defined two types of predictions: model and causal predictions. Causal predictions are the same for DeepFEIVR and DeepFEIVR-RI as . For DeepFEIVR, the model predictions are the same as the causal predictions , but for DeepFEIVR-RI, the model predictions are . For each model, on the test set , we computed the AUC scores (along with their corresponding confidence intervals (CIs)) between the model predictions and the true values . The AUC CIs were calculated using Delong's method. We also provided the test p values of associations between the causal predictions and . In addition, we obtained the p values from the global Wald tests between causal features and using the test set (individual-level data) and the FinnGen AF GWAS summary statistics [27] with the 1000 Genomes Project as the reference panel. Table 2 lists the AUC scores and p values for DeepFEIVR and DeepFEIVR-RI utilizing individual SNPs and PRS-blks as IVs.
| Prediction | IVs | AUC (CI) on UKB test (model) | p on UKB test (causal) |
|---|---|---|---|
| DeepFEIVR | Indv | 0.530 (0.487, 0.574) | 0.171 |
| DeepFEIVR | PRS-blk | 0.589 (0.546, 0.632) | 6.91 × 10⁻⁶ |
| DeepFEIVR-CA | PRS-blk | 0.692 (0.65, 0.735) | 4.89 × 10⁻⁶ |
| DeepFEIVR-RI | Indv | 0.642 (0.601, 0.683) | 0.349 |
| DeepFEIVR-RI | PRS-blk | 0.709 (0.668, 0.751) | 6.33 × 10⁻⁵ |
| DeepFEIVR-RI-CA | PRS-blk | 0.746 (0.706, 0.786) | 2.36 × 10⁻⁵ |
| 2SLS | PRS-blk | 0.572 (0.531, 0.613) | 8.37 × 10⁻⁴ |
| Causal features | IVs | p value on UKB Test | p value on FinnGen |
| DeepFEIVR | Indv | 0.180 | < 10−8 |
| DeepFEIVR | PRS-blk | 2.99 × 10⁻⁵ | < 10−8 |
| DeepFEIVR-CA | PRS-blk | 9.77 × 10⁻⁵ | < 10−8 |
| DeepFEIVR-RI | Indv | 0.344 | < 10−8 |
| DeepFEIVR-RI | PRS-blk | 2.06 × 10⁻⁵ | < 10−8 |
| DeepFEIVR-RI-CA | PRS-blk | 7.13 × 10⁻⁵ | < 10−8 |
| 2SLS | PRS-blk | 0.0284 | < 10−8 |
In Table 2, for the results without covariate adjustment, the model predictive performance of DeepFEIVR-RI was better than DeepFEIVR in terms of model predictive AUC scores for different choices of IVs. However, the hypothesis testing results were close for DeepFEIVR and DeepFEIVR-RI. We will discuss this more in the Section 4. Comparing the performance of using individual SNPs and PRS-blks, the model predictive AUC scores on the individual-level test set using PRS-blks were slightly higher than those of using individual SNPs. The p values from the Wald tests on their causal predictions also confirmed the superiority of using PRS-blks. The p values of extracted causal features from the Wald tests on the FinnGen AF GWAS summary statistics were close to 0 for both methods and both IV choices. For both DeepFEIVR and DeepFEIVR-RI, the causal predictions and extracted causal features were significantly associated with AF on the individual-level test set in the UK Biobank using PRS-blks as IVs while not significantly associated with AF using individual SNPs as IVs. The AUC scores of model predictions for DeepFEIVR and DeepFEIVR-RI with extracted ECG features imputed by PRS-blks were around 0.59 and 0.71, respectively. For comparison, the AUC score for the neural network without the projection layer (i.e., genetic imputation) was 0.789 with a CI of (0.751, 0.827). The differences, especially for DeepFEIVR, are reasonable because the features extracted by DeepFEIVR and DeepFEIVR-RI after projection are only those associated with genotypes. Causal (feature) predictions are restricted as a linear combinations of IVs (SNPs), which may exhibit limited performance in prediction but are suitable for causal inference. The aim of this study is to extract causal features from ECGs, then infer the causality between extracted features and AF. For computing time, the pre-training process took about 41 minutes, while the training of DeepFEIVR or DeepFEIVR-RI took approximately 50 minutes. Both were conducted on a single V100 GPU.
For comparison, we also applied 2SLS to the UK Biobank dataset. Due to the high dimension of ECG signals, principal component analysis was first implemented to reduce the dimension to 64. In the first stage, we imputed the principal components of ECG signals by a linear combination of IVs on the training set, denoted by , and then was used to predict on the test set. The predictions for 2SLS were defined as , where was trained using the training set of and . As using PRS-blks was shown to outperform using individual SNPs, we provided the results for 2SLS using PRS-blks as the IVs in Table 2. Although the p value of the association test between and the causal (feature) predictions was still small and comparable to those of DeepFEIVR and DeepFEIVR-RI, the p value of the association test between and the causal features was notably larger as well as still smaller than 0.05. For causal (feature) prediction, the p value of the association test was much smaller as was trained using the information from .
When the covariates are considered, the model predictions for DeepFEIVR-CA and DeepFEIVR-RI-CA are and , respectively. For both DeepFEIVR-CA and DeepFEIVR-RI-CA, the causal predictions and the causal features are and , respectively. The performance of model predictions was improved for both DeepFEIVR-CA and DeepFEIVR-RI-CA, mainly because the causal features in these models incorporate information from covariates. The procedures for hypothesis testing on causal features for the individual-level test set (with covariates) and the summary statistics (without covariates) were described in Section 2.6. Hypothesis testing of causal (feature) prediction involved an F-test between and , adjusted for covariates . For both DeepFEIVR-CA and DeepFEIVR-RI-CA, hypothesis testing of causal (feature) predictions and causal features from the individual-level UK Biobank test set produced comparable results to those of DeepFEIVR and DeepFEIVR-RI. The hypothesis testing using the summary statistics from the FinnGen study was based on the assumption that IVs and covariates are independent, and both models yielded highly significant inference results. In Table 3, we show the p values of association tests between each covariate and PRS-blks (IVs) in the training set. Only age was marginally associated with PRS-blks (IVs) with a p value of 0.014 (without adjustment for multiple testing), but age was expected and assumed to be independent of SNPs. The marginal association between age and PRS-blks was likely spurious due to a large training sample size of 35,728. In the following sections, we will only present the results without covariate adjustment.
| p of association tests with PRS-blks (IVs) | |
|---|---|
| Age | 0.014 |
| Gender | 0.210 |
| Right-handed | 0.924 |
| Left-handed | 0.912 |
| Both-handed | 0.381 |
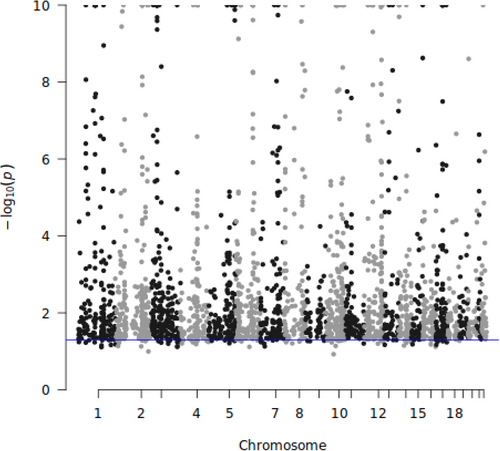
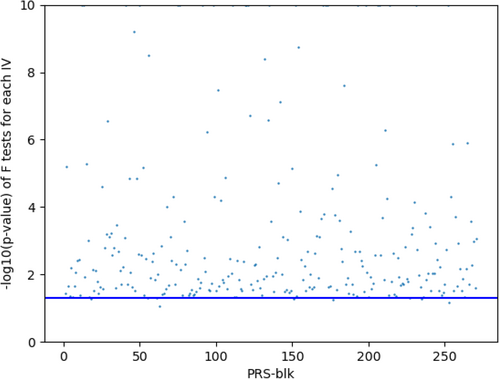
For DeepFEIVR or DeepFEIVR-RI using individual SNPs as IVs, we intend to include a large number of SNPs to ensure more accurate imputation of ECG features. Although the number of PRS-blks (as IVs) is smaller than the number of individual SNPs (as IVs), PRS-blks may contain more information from more SNPs, which may explain its improved prediction performance. To examine the strength of IVs, we computed the p values of extracted causal features before projection on each IV, as shown in Figures 4 (individual SNPs) and 5 (PRS-blks). In addition, we drawed a blue horizontal line indicating a significance level of 0.05. Based on Figures 4 and 5, 95.90% of individual SNPs and 97.42% of PRS-blks were at least marginally significantly associated with the extracted ECG features before projection. These results suggested that the selected IVs were not weak, satisfying the IV assumption of an association between the IVs and the features.
3.2 Model Interpretation
3.2.1 Canonical Correlation Analysis (CCA)
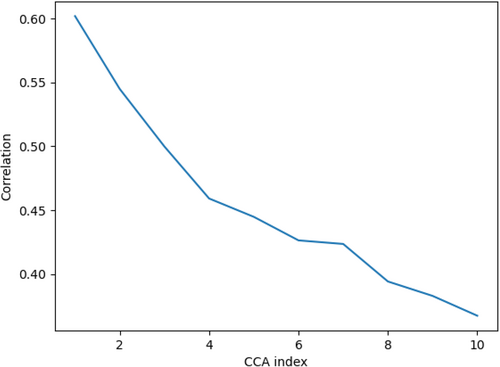
We conducted visual comparisons of features extracted by DeepFEIVR-RI using different IVs by canonical correlation analysis (CCA). CCA stands for a statistical technique to quantify the similarity between two linear subspaces by offering a sequence of maximal correlation coefficients between two sets of orthogonal vectors in the two corresponding subspaces. CCA coefficients are a non-increasing sequence and higher values of CCA coefficients, especially for the top ones, indicate a higher similarity between two features. Figure 6 showcases the comparison of the extracted causal features using individual SNPs and PRS-blks as IVs displaying the top ten CCA coefficients, respectively. With the top 10 canonical correlation coefficients ranging between 0.3 and 0.65, as shown in Figure 6, due to different IV choices, the IV-imputed features captured related but different sources of information from the ECG data.
3.2.2 Contribution Maps of PRS-blks or LD Blocks to ECG Causal Features
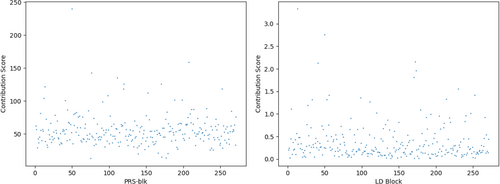
To help interpret the genetically-imputed (causal) ECG features, we proposed using contribution maps of 271 PRS-blks or associated LD blocks to the overall 64 ECG features in Figure 7. The contribution score of the -th PRS-blk to the overall features follows the path PRS-blk features, defined as the sum of absolute values of the corresponding weights , where is the element of the weight matrix at the -th row and the -th column. In addition to the contribution score from each PRS-blk, we also provided the contribution score from the -th corresponding LD block, following the path SNPs (block) PRS-blk features, and its contribution score was defined as , where is the -th PRS-blk for the -th individual. measures the strength of the -th PRS-blk, and the contribution score from the -th corresponding LD block measures how much the SNPs in the block contribute to the causal features. The left and right panels in Figure 7 present contribution scores for PRS-blks and SNPs in the corresponding blocks. 97.06% of PRS-blks significantly contribute to the causal ECG features with the median of contribution scores divided by 2 as the threshold.
3.2.3 Dnn-loc
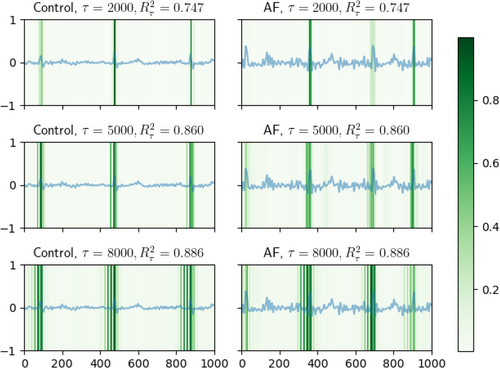
In Figure 8 for non-causal features (before projection) and Figure 9 for causal features (after projection), we present several representative ECG recordings, normalized by its maximum absolute value, along with the detected locations in ECG associated with the extracted features (marked by derived from dnn-loc) by DeepFEIVR-RI on PRS-blks. The detected locations were colored green. For both types of the extracted features in individuals with or without AF, when was small, the detected ECG locations were the R waves; as increased, the P waves were detected next. R waves are the high peaks in ECG recordings and P waves are the waves in the left side to the R waves.
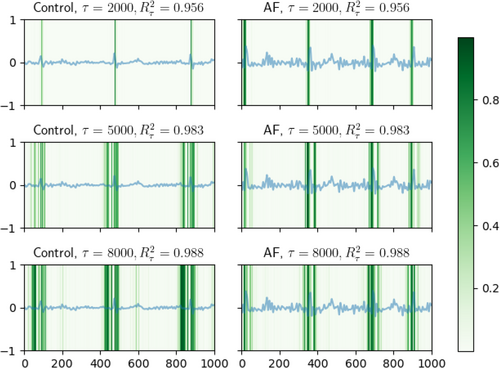
In addition to ECG recordings, the UK Biobank also provides ECG characteristics such as R-R intervals. In Table 4, we list the p values of the associations between each ECG characteristic and extracted non-causal features (before projection) or causal features (after projection) by DeepFEIVR-RI using PRS-blks as IVs on the test set. P axis measures atrial depolarization [31] and P onset and offset are the starting and ending points of a P wave, respectively. Visualization by dnn-locate could provide a visual interpretation, but only on individual examples, and association tests across all samples in the test set confirmed that the extracted non-causal (before projection) and causal features (after projection) from DeepFEIVR-RI were significantly associated with the R and P waves.
| ECG characteristics | Non-causal features | Causal features |
|---|---|---|
| R-R interval | < 10−8 | 0.028 |
| P axis | < 10−8 | 0.035 |
| P onset | < 10−8 | < 10−8 |
| P offset | < 10−8 | < 10−8 |
3.3 Simulations
In simulations, we generally followed the steps in a previous study [21]. The following was repeated for 500 replicates. In each replicate, two features were generated as , where in which was an identity matrix and 50 IVs , in which was a block diagonal matrix consisting of 10 compound symmetric matrices . The off-diagonal elements of were 0.1 and the diagonal ones were 1. The elements in were simulated independently from . Based on the two features in , we could then generate images as , where each element in followed independently. IMG was an image generating function based on , in which two features in determined the positions and values of two squares in the image. The details of image generating process can be found in Yao et al. [21]. Finally, the response was generated as , in which with and , , and each element in independently followed . Compared to the original simulation settings [21], we increased the influence from the hidden confounders.
In each replicate, we implemented DeepFEIVR and DeepFEIVR-RI using individual-level data and summary statistics, and compared their performance. The network model architecture was the same as used in Yao et al. [21]. Training, validation and test dataset sizes were 800, 200, and 4,000, respectively, and the sample size used to estimate in the test set (reference panel) was 20,000. In Table 5, the empirical type I errors when and power when and are presented. The results confirmed that using the summary statistics was sufficient in hypothesis testing for DeepFEIVR-RI, and DeepFEIVR-RI could outperform DeepFEIVR when was small, especially when . This finding is expected, as when is small, the variation of is largely explained by the confounder, under which DeepFEIVR-RI can estimate the confounder () well to reduce the variance of the error term.
| Model | Data | ||||
|---|---|---|---|---|---|
| DeepFEIVR | Individual-level | 0.076 | 0.080 | 0.160 | 0.432 |
| DeepFEIVR | Summary statistics | 0.078 | 0.074 | 0.172 | 0.428 |
| DeepFEIVR-RI | Individual-level | 0.068 | 0.112 | 0.170 | 0.430 |
| DeepFEIVR-RI | Summary statistics | 0.064 | 0.114 | 0.172 | 0.436 |
4 Discussion
In this article, we have applied DeepFEIVR and its extension, DeepFEIVR-RI, to the UK Biobank dataset to extract causal features of ECGs associated with AF. Our contributions include (1) application to a large dataset; (2) development of DeepFEIVR-RI, a residual inclusion extension of DeepFEIVR to reduce estimation variance; (3) construction of IVs from a large number of SNPs; and (4) adaption of dnn-loc for visual interpretation of causal features extracted by DeepFEIVR-RI. For IV selection, we have explored two distinct approaches: individual SNPs, and block-based PRSs (PRS-blks). We have observed that the model predictive AUC scores on the individual-level test data, using PRS-blks, are approximately 0.59 and 0.71 for DeepFEIVR and DeepFEIVR-RI, respectively, marginally surpassing the performance using individual SNPs. Note that the extracted causal features are genetically imputed; it is expected that the prediction performance of these extracted causal features will be less competitive, especially compared with direct classification models. The improvement of using PRS-blks over individual SNPs as IVs comes from its ability to incorporate information from numerous SNPs of weak effects while avoiding using a large number of IVs individually. It has been confirmed previously that the utilization of PRSs as IVs can reduce the bias in estimating the causal parameters by avoiding weak IV bias, compared to using individual genetic variants directly as IVs [32]. One advantage of DeepFEIVR and DeepFEIVR-RI is their ability to infer causal relationships in test data using solely GWAS summary statistics. The hypothesis testing on the FinnGen AF GWAS summary statistics shows that the genetically-imputed ECG features are indeed associated with AF in FinnGen, even when the proportion of AF cases in the FinnGen study is far different from the proportion in the UK Biobank. In addition, the application of CCA demonstrates both the relatedness and differences between the extracted features based on the two different IV choices. Application of the dnn-loc algorithm reveals that the R waves and P waves in ECGs are associated with AF through the extracted causal features by DeepFEIVR-RI, suggesting that the R waves and the P waves are putative causal features for AF. It has been known that AF is dominantly related to irregular R-R intervals (indicated by R waves) and flat P waves, confirming our findings [1, 33].
Nonetheless, there are some limitations in this study. First, although we standardize to alleviate the parameter identification issue, the estimate of is not sign-unique. But we note that the sign issue with and does not seem to affect the prediction and hypothesis testing (with a chi-squared null distribution that does not depend on the sign of the test statistic). Second, there are two main advantages of DeepFEIVR-RI compared to DeepFEIVR: (1) based on the real data analysis of the UK Biobank, the model predictive performance is improved by DeepFEIVR-RI as compared to DeepFEIVR; (2) based on the simulation studies, the improvement of power could be seen under certain scenarios, especially when the variance of hidden confounders is large compared to the causal effect. It is important to note that the superior model predictive performance does not necessarily lead to improved causal inference, as the model predictions from DeepFEIVR-RI contain terms of both non-causal and causal features. In the real data analysis, although the improvement of DeepFEIVR-RI over DeepFEIVR in model prediction performance was notable in terms of their model predictive AUC scores, the p values of association tests between true values and causal features were quite similar. A possible explanation is that in the real data, the variance of hidden confounders is not relatively large enough. Notably, even under such cases, applying DeepFEIVR-RI did not have a negative impact. Another possible reason is that simulation studies cannot reflect the structure of ECG signals. However, as a large number of replications are required in simulations, it is difficult to model ECG data in simulation studies due to its high dimensionality. Finally, we selected individual SNPs or PRS-blks associated with AF as IVs. This is based on the simple idea that an IV associated with any causal ECG features for AF is expected to be associated with AF. On the other hand, however, some of these IVs may directly affect AF and thus are likely to be invalid IVs. Due to the nature of the model structure, invalid IVs are difficult to identify. Without assuming valid IVs, as transcriptome-wide association studies (TWAS) [34, 35], our method can be interpreted as extracting genetic components of ECG data that are associated with AF, which are expected to be biologically more relevant and more robust to many environmental confounders and experimental artifacts. These issues warrant future studies.
Author Contributions
Yuchen Yao: methodology, implementation, data analysis, and writing. Zhaotong Lin: data analysis input and review. Xiaotong Shen: review and supervision. Lin Yee Chen: data analysis input and review. Wei Pan: supervision, funding provider, methodology, and writing.
Acknowledgments
We thank the reviewers for helpful comments and suggestions. This research was supported by National Institutes of Health (NIH) grants R01AG065636, R01AG069895, RF1 AG067924, and U01AG073079, and by the Minnesota Supercomputing Institute. This research was conducted utilizing data from UK Biobank through Application #35107. We would like to thank the FinnGen study, its investigators, and participants.
Conflicts of Interest
The authors declare no conflicts of interest.
Appendix A: Covariate Adjustment Versus no Adjustment
Therefore, we have (by neglecting as ). Thus we complete the proof.
Open Research
Data Availability Statement
The UK Biobank data can be accessed for approved users at https://www.ukbiobank.ac.uk. The FinnGen AF summary statistics data can be downloaded from https://www.finngen.fi/. The 1000 Genomes Project individual-level SNP data is available at http://www.internationalgenome.org.


